. 2022 Jan 28;13(1):557.
doi: 10.1038/s41467-022-28201-2.

Depletion of mitochondrial methionine adenosyltransferase α1 triggers mitochondrial dysfunction in alcohol-associated liver disease

Affiliations

Depletion of mitochondrial methionine adenosyltransferase α1 triggers mitochondrial dysfunction in alcohol-associated liver disease

Lucía Barbier-Torres et al. Nat Commun. .

Abstract

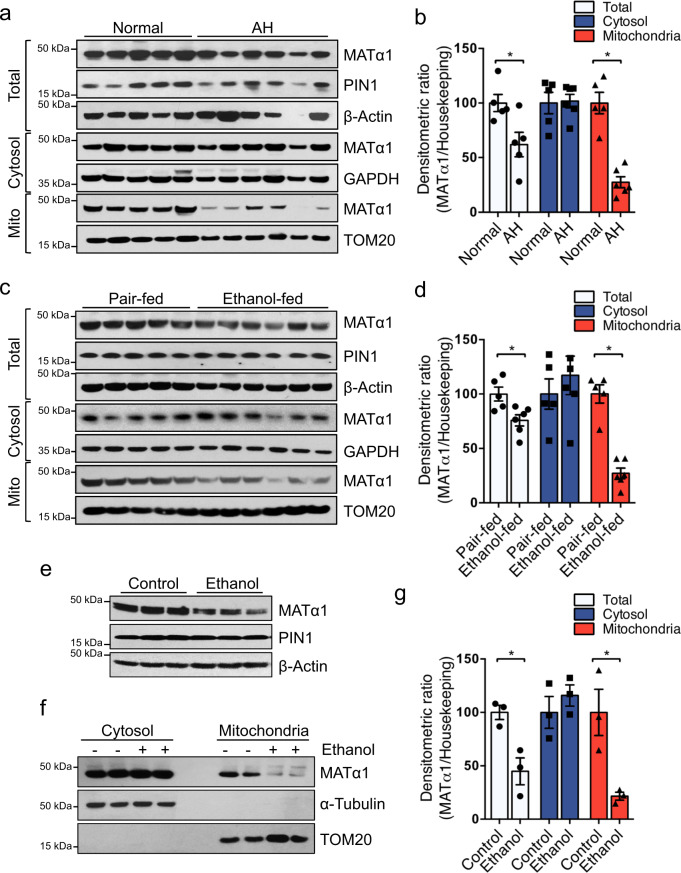
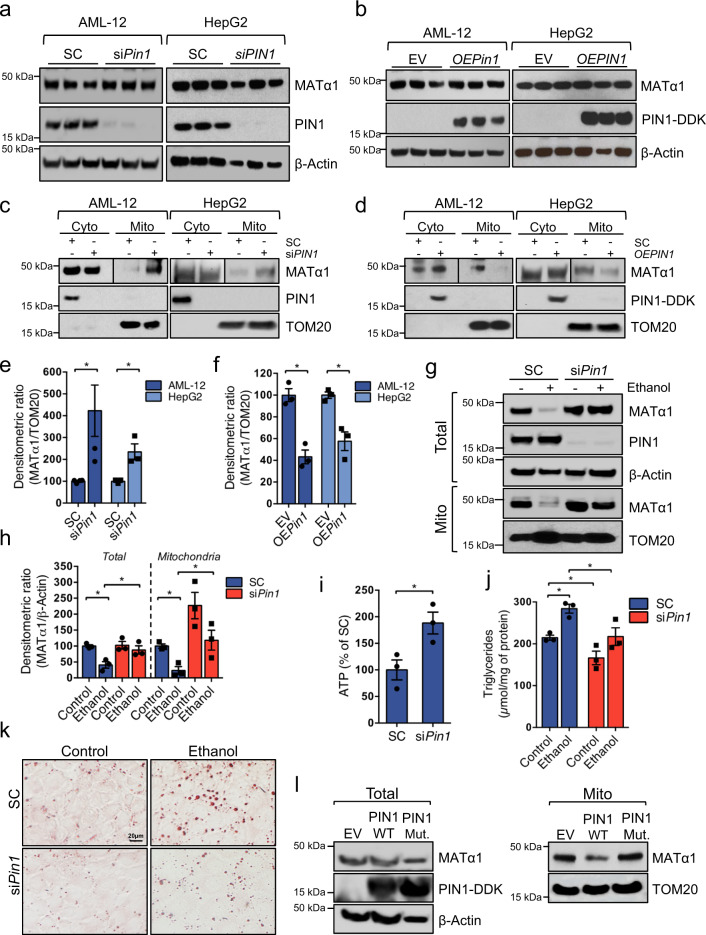
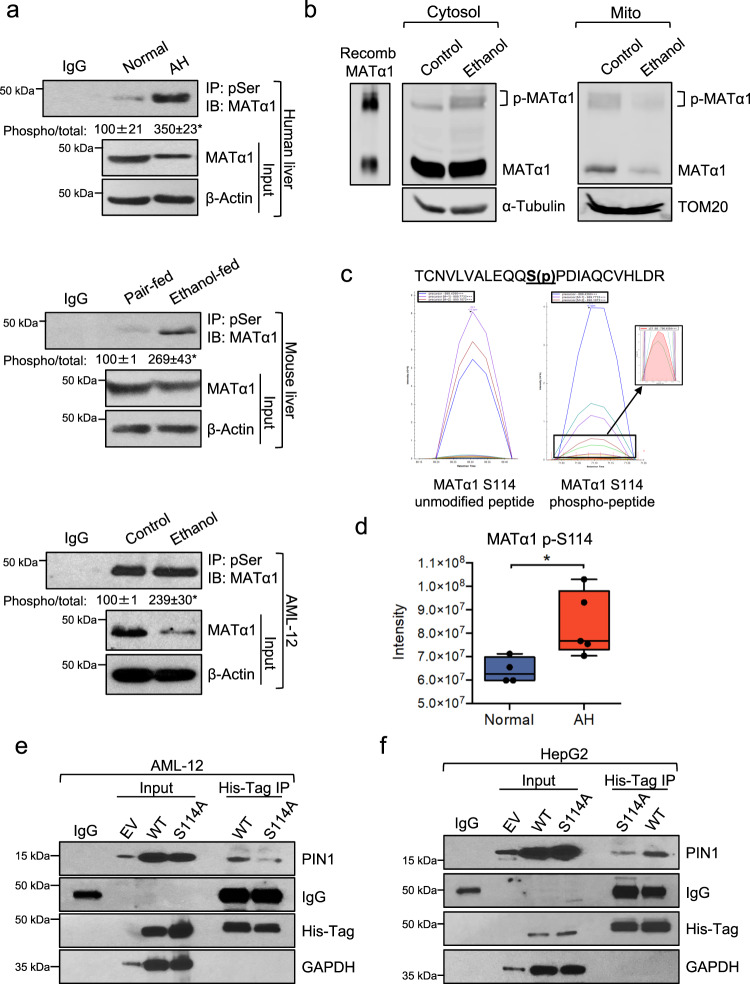
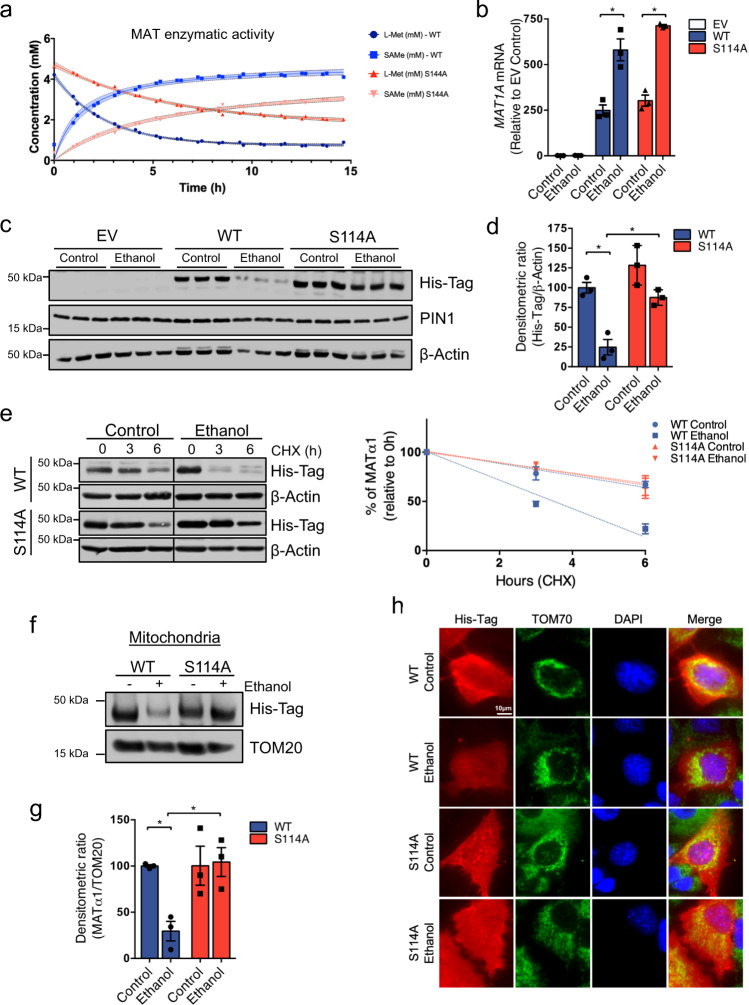
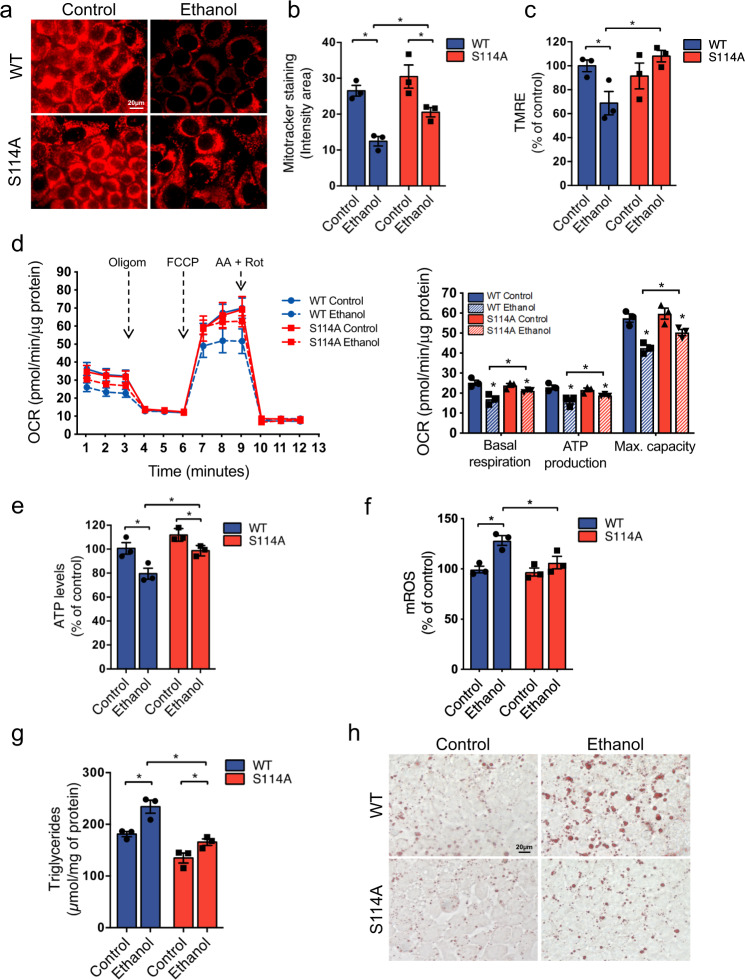
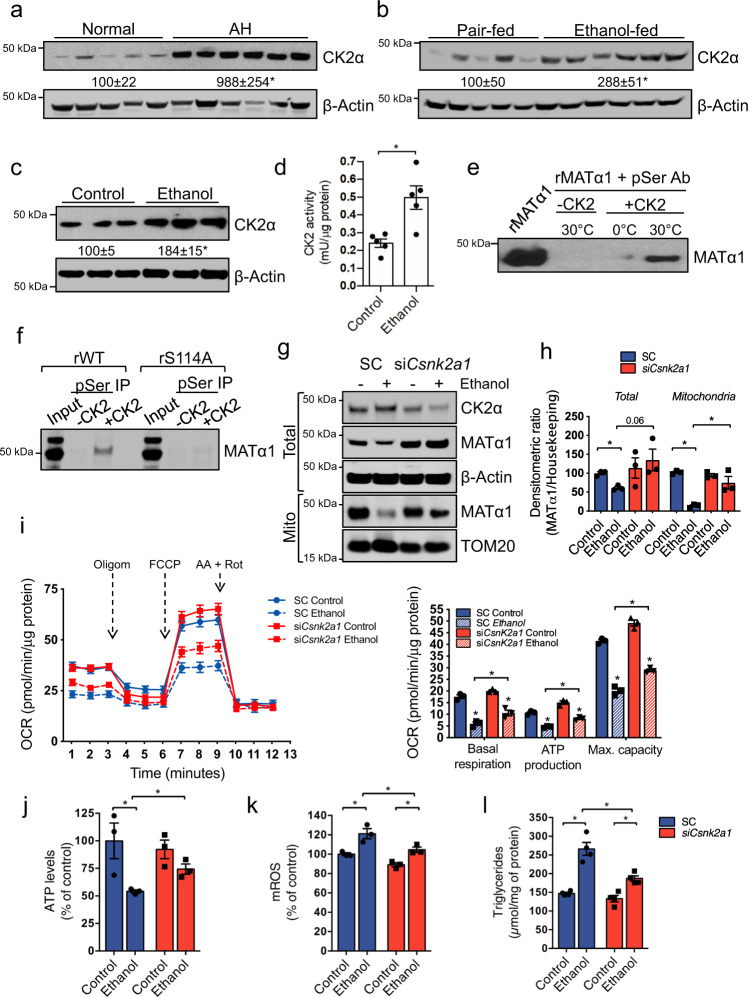
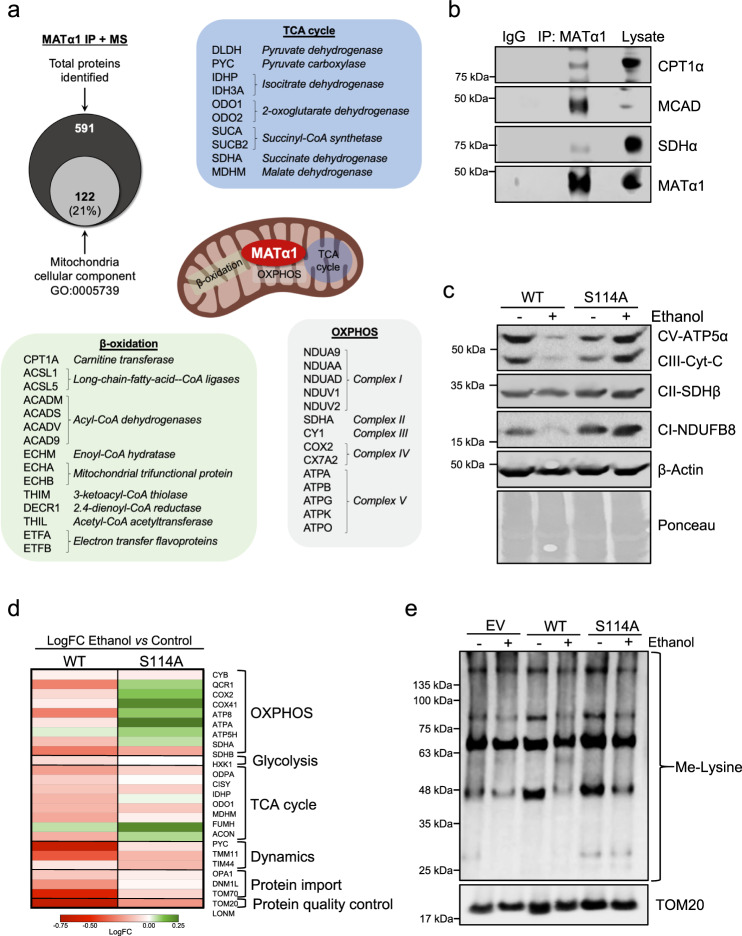
MATα1 catalyzes the synthesis of S-adenosylmethionine, the principal biological methyl donor. Lower MATα1 activity and mitochondrial dysfunction occur in alcohol-associated liver disease. Besides cytosol and nucleus, MATα1 also targets the mitochondria of hepatocytes to regulate their function. Here, we show that mitochondrial MATα1 is selectively depleted in alcohol-associated liver disease through a mechanism that involves the isomerase PIN1 and the kinase CK2. Alcohol activates CK2, which phosphorylates MATα1 at Ser114 facilitating interaction with PIN1, thereby inhibiting its mitochondrial localization. Blocking PIN1-MATα1 interaction increased mitochondrial MATα1 levels and protected against alcohol-induced mitochondrial dysfunction and fat accumulation. Normally, MATα1 interacts with mitochondrial proteins involved in TCA cycle, oxidative phosphorylation, and fatty acid β-oxidation. Preserving mitochondrial MATα1 content correlates with higher methylation and expression of mitochondrial proteins. Our study demonstrates a role of CK2 and PIN1 in reducing mitochondrial MATα1 content leading to mitochondrial dysfunction in alcohol-associated liver disease.


Conflict of interest statement

The authors declare no competing interests.

Figures

Fig. 1
Fig. 1. Mitochondrial MATα1 level is selectively reduced in alcohol-associated liver disease.
Western blots (a) and densitometry analyses (b) of total, cytosolic and mitochondrial MATα1 in human normal and AH livers (n = 5 normal and n = 6 AH independent patients. p = 0.027 for total and p = 0.0006 for mitochondrial MATα1). Western blots (c) and densitometry analyses (d) of total, cytosolic and mitochondrial MATα1 in pair-fed and ethanol-fed mouse livers (n = 5 pair-fed and n = 6 ethanol-fed independent animals. p = 0.049 for total and p = 0.0004 for mitochondrial MATα1). Western blots (e, f) and densitometry analyses (g) of total, cytosolic and mitochondrial MATα1 in AML-12 cells treated with ethanol (n = 3 independent experiments. p = 0.018 for total and p = 0.024 for mitochondrial MATα1). Data are presented as mean values ± SEM. *p < 0.05. Statistical significance was determined by using two-tailed, one-sample t-test. Source data are provided as a Source data file. Total lysate is shown in white, cytosolic fraction in blue and mitochondrial fraction in red. AH alcoholic hepatitis.
Fig. 2
Fig. 2. Alcohol enhances PIN1 and MATα1 interaction in the liver.
a Human and mouse MATα1 protein sequences showing that PIN1 binding motif is conserved between species. b IP analysis of human hepatocytes lysate using anti-PIN1 antibody followed by western blot analysis against MATα1. c IP analysis of WT mouse liver hepatocytes lysate with anti-PIN1 (left panel) or anti-MATα1 (right panel) antibody followed by western blot analysis against MATα1 (left panel) or PIN1 (right panel). d IP analysis using PIN1 and MATα1 recombinant proteins and beads conjugated to anti-PIN1 and anti-MATα1 antibodies. IgG was used as a negative control. IP analysis of human normal and end-stage cirrhotic ALD liver lysates (e) (n = 3 normal and n = 5 ALD independent patients. p = 0.044), pair-fed and ethanol-fed mouse livers whole lysates (f, n = 4 pair-fed and n = 4 ethanol-fed independent animals. p = 0.002) and (g, n = 3 pair-fed and n = 3 ethanol-fed independent animals p = 0.027) and cytosolic fractions (h, n = 3 pair-fed and n = 3 ethanol-fed independent animals. p = 0.038), and AML-12 cells treated with ethanol (i and j, n = 3 independent experiments. p = 0.005) using anti-PIN1 or anti-MATα1 antibodies followed by western blot analysis against MATα1 or PIN1. Densitometry analysis are shown; ethanol-fed vs pair-fed; and ethanol vs control. Results are shown as mean ± SEM. *p < 0.05. Statistical significance was determined by using two-tailed, one-sample t-tests. Source data are provided as a Source data file. ALD alcohol-associated liver disease, IP immunoprecipitation, r recombinant.
Fig. 3
Fig. 3. PIN1 negatively regulates MATα1 mitochondrial targeting.
Western blots of MATα1 and PIN1 in AML-12 and HepG2 cells after PIN1 silencing (a) and overexpression (b). Western blots and densitometry analyses of cytosolic and mitochondrial MATα1 and PIN1 in AML-12 and HepG2 cells after PIN1 silencing (c and e, AML-12: n = 4 independent experiments, p = 0.033 and HepG2: n = 3 independent experiments, p = 0.022) and overexpression (d and f, AML-12: n = 3 independent experiments, p = 0.003 and HepG2: n = 3 independent experiments, p = 0.009). AML-12 are shown in dark blue and HepG2 in light blue. g Western blot and h densitometry analyses of total and mitochondrial MATα1 in AML-12 cells after PIN1 silencing and ethanol treatment (n = 3 independent experiments, p = 0.006 for total and p = 0.005 for mitochondrial MATα1 SC ethanol vs SC control; p = 0.047 for total and p = 0.046 for mitochondrial MATα1 siPin1 ethanol vs SC ethanol). SC is shown in blue and siPin1 in red. i ATP levels in AML-12 cells after Pin1 silencing (n = 3 independent experiments, p = 0.034). j Triglycerides levels (n = 3 independent experiments, p = 0.004 SC ethanol vs control; p = 0.048 siPin1 control vs SC control; and p = 0.049 siPin1 ethanol vs SC ethanol) and k Oil red O staining in AML-12 after Pin1 silencing and ethanol treatment. SC is shown in blue and siPin1 in red. l Western blot of total and mitochondrial MATα1 in HepG2 cells after PIN1 WT or R68A/R69A catalytic mutant overexpression. *p < 0.05. Statistical significance was determined by using two-tailed, one-sample t-test for treatment comparisons and ANOVA test for group comparisons. Results are shown as mean ± SEM. Source data are provided as a Source data file. DDK DYKDDDDK-Tag, EV empty vector, Mut mutant, OE overexpression, SC scramble, si silencing.
Fig. 4
Fig. 4. Alcohol-induced MATα1 phosphorylation at Ser114 is required for PIN1 binding.
a IP analysis of human normal and AH liver lysates, pair-fed and ethanol-fed mouse livers, and AML-12 cells treated with ethanol using anti-phosphoserine antibody followed by western blot analysis against MATα1 (n = 3 independent samples/experiments, p = 0.001 for AH vs normal; p = 0.021 ethanol-fed vs pair-fed; and p = 0.008 ethanol vs control AML-12). b Phos-Tag gels of phosphorylated MATα1 in cytosolic and mitochondrial fractions of AML-12 cells treated with ethanol. Unphosphorylated and phosphorylated recombinant human MATα1 protein is shown as a control (left). c Area under the curve of the phosphorylated peptide which corresponds to MATα1 Ser114 and its unmodified counterpart in WT mouse liver. d Quantitation of the MATα1 Ser114 in normal (n = 4) and AH (n = 5) human livers (p = 0.03). The center line, bounds of box, and whiskers represent mean, 25th to 75th percentile range, and minimum to maximum range. Normal liver is shown in blue and AH in red. e IP analysis of AML-12 and f HepG2 overexpressing MATα1 WT or S114A cell lysates using anti-His-Tag antibody followed by western blot analysis against PIN1. *p < 0.05. Statistical significance was determined by using two-tailed, one-sample t-test for treatment comparisons and ANOVA test for group comparisons. Results are shown as mean ± SEM. Source data are provided as a Source data file. AH alcoholic hepatitis, EV empty vector, IP immunoprecipitation, pSer phosphor-serine, WT wild type.
Fig. 5
Fig. 5. Blocking the interaction with PIN1 protects MATα1 against alcohol-induced downregulation.
a MAT enzymatic activity measured as methionine consumption and SAMe production using recombinant MATα1 WT and S114A proteins. b MAT1A mRNA levels (n = 3 independent experiments, p = 0.007 for WT ethanol vs control and p = 0.0002 S114A ethanol vs control), c western blot, and d corresponding densitometry analysis of AML-12 cells lysates after transfection with EV, MATα1 WT or S114A vectors and ethanol treatment using anti-His-Tag antibody (n = 3 independent experiments, p = 0.003 for WT ethanol vs control and p = 0.005 S114A ethanol vs WT ethanol). e Western blot analysis of AML-12 cells expressing MATα1 WT or S114A and treated with ethanol before CHX addition and graph on the right showing the t1/2 for MATα1 WT and S114A with and without ethanol treatment. f Western blot and g densitometry analysis of the mitochondrial fraction of AML-12 cells expressing MATα1 WT or S114A after ethanol treatment (n = 3 independent experiments, p = 0.003 for WT ethanol vs control and p = 0.016 S114A ethanol vs WT ethanol). h His-Tag (red) and TOM70 (green) immunofluorescence and mitochondrial. *p < 0.05. Statistical significance was determined by using two-tailed, one-sample t-test for treatment comparisons and ANOVA test for group comparisons. Results are shown as mean ± SEM. Source data are provided as a Source data file. WT is shown in blue and S114A is shown in red. CHX cycloheximide, EV empty vector, WT wild type.
Fig. 6
Fig. 6. Blocking PIN1-MATα1 interaction protects against alcohol-induced mitochondrial injury by increasing MATα1 mitochondrial content.
a Mitotracker staining (red) and b quantification (n = 10 pictures/3 independent experiments, p = 0.002 for WT ethanol vs control; p = 0.047 for S114A ethanol vs control; p = 0.013 S114A ethanol vs WT ethanol), c mitochondrial membrane potential (n = 3 independent experiments, p = 0.045 for WT ethanol vs control; p = 0.022 S114A ethanol vs WT ethanol), d mitochondrial respiration and basal respiration (p = 0.015 for WT ethanol vs control; p = 0.049 S114A ethanol vs control; p = 0.035 WT ethanol vs S114A ethanol), ATP production (p = 0.022 for WT ethanol vs control; p = 0.041 S114A ethanol vs control; p = 0.041 WT ethanol vs S114A ethanol) and maximal respiratory capacity (p = 0.005 for WT ethanol vs control; p = 0.040 S114A ethanol vs control; p = 0.004 WT ethanol vs S114A ethanol from 3 independent experiments), e ATP (n = 3 independent experiments, p = 0.035 for WT ethanol vs control; p = 0.022 S114A ethanol vs control; p = 0.041 WT ethanol vs S114A ethanol), f mROS levels (n = 3 independent experiments, p = 0.013 for WT ethanol vs control; p = 0.04 WT ethanol vs S114A ethanol), g triglycerides content (n = 3 independent experiments, p = 0.017 for WT ethanol vs control; p = 0.008 WT ethanol vs S114A ethanol), and h Oil red O staining in AML-12 cells expressing MATα1 WT or S114A after ethanol treatment. *p < 0.05. Statistical significance was determined by using two-tailed, one-sample t-test for treatment comparisons and ANOVA test for group comparisons. Results are shown as mean ± SEM. Source data are provided as a Source data file. WT is shown in blue and S114A is shown in red. AA antimycin A, FCCP Carbonyl cyanide-p-trifluoromethoxyphenylhydrazone, mROS mitochondrial reactive oxygen species, OCR oxygen consumption rate, Oligom oligomycin, Rot rotenone, WT wild type.
Fig. 7
Fig. 7. CK2 phosphorylates MATα1 at Ser114 to inhibit its mitochondrial localization in ALD.
Western blots and densitometry analyses of CK2α in a human normal (n = 5) and AH livers (n = 6) (p = 0.017), b pair-fed (n = 5) and ethanol-fed (n = 6) mouse livers (p = 0.026), and c AML-12 cells treated with ethanol (p = 0.005). d CK2 activity in AML-12 cells treated with ethanol (n = 5 independent experiments, p = 0.014). In vitro kinase assay of CK2 on e recombinant human MATα1, and f recombinant MATα1 WT and S114A proteins. g Western blot and h densitometry analyses of total and mitochondrial MATα1 in AML-12 cells after Csnk2a1 silencing and ethanol treatment (n = 3 independent experiments. For mitochondrial MATα1 p = 0.00002 SC ethanol vs control; p = 0.007 SC ethanol vs siCsnk2a1 ethanol. For total MATα1 p = 0.002 SC ethanol vs control; p = 0.007 SC ethanol vs siCsnk2a1 ethanol). i Mitochondrial respiration and basal respiration (p = 0.004 for SC ethanol vs control; p = 0.002 siCsnk2a1 ethanol vs control; p = 0.03 SC ethanol vs siCsnk2a1 ethanol), ATP production (p = 0.0003 for SC ethanol vs control; p = 0.001 siCsnk2a1 ethanol vs control; p = 0.002 SC ethanol vs siCsnk2a1 ethanol) and maximal respiratory capacity (p = 0.0009 SC ethanol vs control; p = 0.0002 siCsnk2a1 ethanol vs control; p = 0.003 SC ethanol vs siCsnk2a1 ethanol), j ATP levels (p = 0.047 WT ethanol vs control; p = 0.013 SC ethanol vs control; p = 0.041 SC ethanol vs siCsnk2a1 ethanol), k mROS levels (p = 0.0017 WT ethanol vs control; p = 0.013 SC ethanol vs control; p = 0.047 SC ethanol vs siCsnk2a1 ethanol), and l triglycerides content (n = 4 independent experiments, p = 0.006 WT ethanol vs control; p = 0.005 SC ethanol vs control; p = 0.041 SC ethanol vs siCsnk2a1 ethanol) in AML-12 Csnk2a1 silenced cells after ethanol treatment. n = 3 independent experiments unless specified. *p < 0.05. Statistical significance was determined by using two-tailed, one-sample t-test for treatment comparisons and ANOVA test for group comparisons. Results are shown as mean ± SEM. Source data are provided as a Source data file. SC is shown in blue and siCsnk2a1 is shown in red. AA antimycin A, FCCP Carbonyl cyanide-p-trifluoromethoxyphenylhydrazone, IP immunoprecipitation, mROS mitochondrial reactive oxygen species, OCR oxygen consumption rate, Oligom oligomycin, pSer phosphoserine, r recombinant, Rot rotenone, SC scramble, si silencing, WT wild type.
Fig. 8
Fig. 8. Mitochondrial MATα1 protects mitochondrial proteome against ethanol-induced degradation.
a Overlap of mitochondrial and total proteins identified by MS in human livers after MATα1 co-IP and list of mitochondrial proteins involved in TCA cycle, OXPHOS, and fatty acid β-oxidation found to interact with MATα1 in human liver. b IP analysis of human normal liver lysates using anti-MATα1 antibody followed by western blot analysis against CPT1α, MCAD, and SDHα. c Western blot analysis using an OXPHOS antibody cocktail which detects ATP5A (Complex V), UQCRC2 (Complex III), SDHB (Complex II), and NDUFB8 (complex I) in lysates of AML-12 cells expressing MATα1 WT or S114A after ethanol treatment (n = 3 independent experiments). d Protein abundance heatmap for MitoPlex proteins detected in AML-12 cells expressing MATα1 WT or S114A after ethanol treatment. Expression is displayed as LogFC of ethanol versus control, ranging from downregulated (red) to upregulated (green) (n = 4 independent experiments). e Western blot analysis using a methyl-lysine antibody in mitochondrial fractions of AML-12 cells transfected with empty vector (EV), MATα1 WT or S114A after ethanol treatment (n = 3 independent experiments). Results are shown as mean ± SEM. Source data are provided as a Source data file. IP immunoprecipitation, LogFC Log2 fold change, MS mass spectrometry, OXPHOS oxidative phosphorylation, TCA tricarboxylic, WT wild type.
Fig. 9
Fig. 9. PIN1 impairs MATα1 mitochondrial targeting iEn alcohol-associated liver disease.
Graphical summary of the study. Alcohol promotes CK2 phosphorylation of MATα1 at Ser114 and interaction with PIN1, thereby inhibiting MATα1 mitochondrial targeting. Alcohol-induced mitochondrial MATα1 depletion contributes to mitochondrial dysfunction and the pathogenesis of ALD.

References

    1. Gao B, Bataller R. Alcoholic liver disease: pathogenesis and new therapeutic targets. Gastroenterology. 2011;141:1572–1585. - PMC - PubMed
    1. Asrani SK, Devarbhavi H, Eaton J, Kamath PS. Burden of liver diseases in the world. J. Hepatol. 2019;70:151–171. - PubMed
    1. Murray B, et al. Methionine adenosyltransferase α1 is targeted to the mitochondrial matrix and interacts with cytochrome P450 2E1 to lower its expression. Hepatol. Baltim. Md. 2019;70:2018–2034. - PMC - PubMed
    1. Lu SC, Mato JM. S-adenosylmethionine in liver health, injury, and cancer. Physiol. Rev. 2012;92:1515–1542. - PMC - PubMed
    1. Tsukamoto H, Lu SC. Current concepts in the pathogenesis of alcoholic liver injury. FASEB J. 2001;15:1335–1349. - PubMed

Publication types

MeSH terms