. 2022 Apr;234(2):578-591.
doi: 10.1111/nph.18003. Epub 2022 Feb 21.

Impaired photoprotection in Phaeodactylum tricornutum KEA3 mutants reveals the proton regulatory circuit of diatoms light acclimation

Affiliations

Impaired photoprotection in Phaeodactylum tricornutum KEA3 mutants reveals the proton regulatory circuit of diatoms light acclimation

Claire Seydoux et al. New Phytol. 2022 Apr.

Abstract

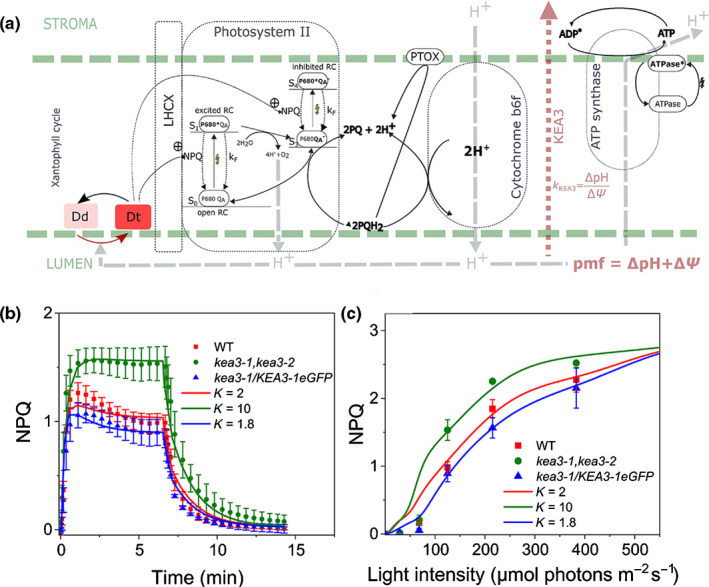
Diatoms are successful phytoplankton clades able to acclimate to changing environmental conditions, including e.g. variable light intensity. Diatoms are outstanding at dissipating light energy exceeding the maximum photosynthetic electron transfer (PET) capacity via the nonphotochemical quenching (NPQ) process. While the molecular effectors of NPQ as well as the involvement of the proton motive force (PMF) in its regulation are known, the regulators of the PET/PMF relationship remain unidentified in diatoms. We generated mutants of the H+ /K+ antiporter KEA3 in the model diatom Phaeodactylum tricornutum. Loss of KEA3 activity affects the PET/PMF coupling and NPQ responses at the onset of illumination, during transients and in steady-state conditions. Thus, this antiporter is a main regulator of the PET/PMF coupling. Consistent with this conclusion, a parsimonious model including only two free components, KEA3 and the diadinoxanthin de-epoxidase, describes most of the feedback loops between PET and NPQ. This simple regulatory system allows for efficient responses to fast (minutes) or slow (e.g. diel) changes in light environment, thanks to the presence of a regulatory calcium ion (Ca2+ )-binding domain in KEA3 modulating its activity. This circuit is likely tuned by the NPQ-effector proteins, LHCXs, providing diatoms with the required flexibility to thrive in different ocean provinces.

Keywords: diatoms; ion channels; nonphotochemical quenching; photosynthesis; phytoplankton; proton motive force.


Figures

Fig. 1
Fig. 1
Nonphotochemical quenching (NPQ) in Phaeodactylum tricornutum is pH and ∆pH dependent. (a) Fluorescence quenching transients in P. tricornutum wild‐type (WT) cells exposed to high light (HL, 1200 µmol photons m−2 s−1, white box), low light (LL, 25 µmol photons m−2 s−1, grey box) and dark (black box) at different pH values. Arrows indicate addition of nigericin (20 µM, black), acetic acid (5 mM, red) and potassium hydroxide (2.5 mM, blue). (b) NPQ kinetics (circles) calculated from the fluorescence traces shown in (a). black symbol: de‐epoxidation state (DES) in the dark. White symbol: DES in HL. Grey symbol: DES upon NPQ relaxation in LL. Red symbol: DES at pH 4.5 (in the dark). n = 5–8. Mean ± SD. (c) The pH dependency of NPQ in the presence of 20 µM nigericin during an acidic (red squares) or a neutral (blue circles) shift. Black dot: apparent pKa of the NPQ vs pH relationship. The acid shift was done from an initial external pH of 7.8 to the indicated pH values. The pH neutral shift was done from an initial external pH of 4.5 to the indicated pH values. Data represent different experiments performed with six biological samples. (d) Nig sensitivity of NPQ in P. tricornutum cells. Different concentrations of Nig were added before measuring NPQ induction under HL (1200 µmol photons m−2 s−1, white box) and relaxation under LL (25 µmol photons m−2 s−1, grey box). n = 3. Mean ± SD.
Fig. 2
Fig. 2
Molecular and physiological characterization of KEA3 mutants in Phaeodactylum tricornutum. (a) Localization of a full‐length PtKEA3:eGFP fusion protein expressed in P. tricornutum. Bright field, light microscope images; chlorophyll, chlorophyll auto‐fluorescence; eGFP, enhanced green fluorescence protein; merge, merged channel. Bar, 5 μm. (b) Immunodetection of KEA3 in total protein extracts from wild‐type (WT, red arrow) and kea3‐1, kea3‐2 and kea3‐1/KEA3‐eGFP (blue arrow) strains. A 30 μg total protein content was loaded per well. Note that the higher molecular weight in the complemented lines is due to the presence of eGFP. The antibody specificity is shown in Supporting Information Fig. S7. Loading control: β subunit of the plastidial ATP synthase complex (ATPB). Representative picture of an experiment repeated three times with similar results. (c) Quantitative polymerase chain reaction (qPCR) quantification of KEA3 messenger RNA (mRNA) steady state in WT (red) and complemented kea3‐1/KEA3‐eGFP genotypes (blue). n = 3 mean ± SD. Expression was normalized on three house‐keeping genes (RPS, TBP and EF1‐a). The asterisks indicate significant differences in expression between the WT and kea3‐1/KEA3‐eGFP genotypes (P < 0.05). (d) Nonphotochemical quenching (NPQ) features in WT (red), knockout (KO) (green) and complemented (blue) genotype under moderate light (ML: 125 µmol photons m−2 s−1, upper panels) and high light (HL: 1200 µmol photons m−2 s−1, lower panels) in control conditions (solid symbols) and upon addition of 10 µm nigericin (open symbols). White box: HL; light grey box: ML; dark grey box: low light (LL, 25 µmol photons m−2 s−1) to facilitate NPQ recovery. ML: n = 6 mean ± SD. HL: n = 15 mean ± SD. Asterisks indicate significant differences in NPQ between control and nigericin treated samples (P < 0.05). (e) Western blot analysis of photosynthetic complexes in WT and mutant genotypes. Total protein extracts were analysed by immunodetection using specific antisera. PSBA, photosystem II D1 protein, 25 µg protein loaded; Cyt f, cytochrome b6f complex PETA protein, 50 µg protein loaded; PSAD, photosystem I subunit, 20 µg protein loaded; LHCX, 20 µg protein loaded; ATPB, β subunit of ATPase, 20 µg protein loaded, as loading control. Representative picture of an experiment repeated three times with similar results. (f) Relationship between NPQ capacity and de‐epoxidation state (DES) in the different genotypes. Same colour code as in (c, d). n = 5 mean ± SD. Solid symbols: control; open symbols: Nig (10 µM). (g) Estimates of the two components of the transthylakoid proton motive force (PMF): the electric potential (charge gradient, left) via the electro chromic shift (ECS) signal (left; n = 6 mean ± SD) and the pH gradient (proton gradient, right) via the quenching of 9‐aminoacridine (9‐aa) fluorescence (n = 4 mean ± SD). Raw data are shown in Fig. S12. Asterisks indicate significant differences in ΔΨ or ΔpH signals between the kea3‐1, kea3‐2 (pooled data from the two lines), the WT and the kea3‐1/KEA3‐eGFP genotypes (P < 0.05).
Fig. 3
Fig. 3
Mathematical model recapitulating nonphotochemical quenching (NPQ) features of diatoms. (a) General features of the computational model used to describe diatom NPQ. Based on a previous model for NPQ in plants (Matuszyńska et al., 2016), the model used here adopts some modifications (see also ‘the Materials and Methods section’ and the Supporting Information Methods S1) including: (1) a more neutral pK for diadinoxanthin de‐epoxidase (6.3) relative to violaxanthin de‐epoxidase; (2) partitioning of the proton motive force (PMF) between the ΔΨ and the ΔH is included via the K KEA3 parameter (K KEA3 = ΔpH/ΔΨ). (b) Simulations of NPQ kinetics of wild‐type (WT) and mutants under moderate light (raw data from Fig. 2d (symbols ± SD) were simulated (lines) considering changes in the ΔpH : ΔΨ ratio calculated based on Cruz et al. (2001)). (c) Light dependency of NPQ in the different genotypes. Raw data from Fig. S10 (symbols ± SD) were simulated (lines) considering the same changes in the ΔpH/ΔΨ as in (b).
Fig. 4
Fig. 4
Role of PtKEA3 in promoting diel variations in the ΔpH sensitivity of nonphotochemical quenching (NPQ) in Phaeodactylum tricornutum. Cells were grown in a 12 h : 12 h, photoperiod and harvested either 1.5 or 8 h after the onset of illumination. (a) Variation in NPQ amplitude and nigericin sensitivity measured in wild‐type (WT), kea3‐1 and kea3‐2 (pooled data from the two lines) and kea3‐1/KEA3‐eGFP cells after 1.5 h (solid, open) and 8 h (dashed) of exposure to moderate light (ML, 125 µmol photons m−2 s−1, left) and high light (HL, 1200 µmol photons m−2 s−1, right). n = 7–16. ns, not significant. (b) Quantification of PtKEA3 messenger RNA (mRNA) accumulation by quantitative polymerase chain reaction (qPCR) after 1.5 h (solid) and 8 h (dashed) of light exposure to ML light (inset) in WT cells. n = 3. Expression was normalized on three house‐keeping genes (RPS, TBP and EF1‐a). The asterisk indicates significant differences in KEA3 expression levels (P < 0.05). (c) Immunodetection of PtKEA3 protein in WT cells steady state in the thylakoids after 1.5 and 8 h of illumination. The sensitivity of the Western blot analysis using progressive dilutions of the sample is shown. Representative picture of an experiment repeated three times with similar results. ATPB immunodetection was used as loading control. (d) Oligomerization state of KEA3 in WT cells harvested 1.5 or 8 h after the onset of illumination during the day. Thylakoid membranes of WT were solubilized with α‐dodecyl maltoside (α‐DM) and loaded on 4–16% acrylamide BN gel (top arrows). A mix of thyroglobuline (660 kDa), aldolase (158 kDa) and Conalbumine (76 kDa) was used as molecular weight markers (dashed lines). KEA3 was detected on two‐dimensional (2D) denaturizing condition using α‐KEA3 antiserum and α‐PSBA antiserum was used as running control. Molecular weight markers are reported on the right. Red asterisk: KEA3 monomer; blue asterisk: KEA3 dimer. Representative picture of an experiment repeated three times with similar results.
Fig. 5
Fig. 5
Calcium ion (Ca2+) binding controls KEA3 activity in Phaeodactylum tricornutum through an EF‐hand motif. Immunodetection of KEA3 of total protein extracts from two different kea3‐1/KEA3‐eGFP overexpressing strains (Supporting Information Fig. S8). The polypeptides were separated by SDS‐PAGE and revealed with an antibody directed against enhanced green fluorescent protein (eGFP) (Miltenyi Biotech, Cambridge, MA, USA). (a) Control conditions: kea3‐1/KEA3‐eGFP appears as a doublet (orange and blue asterisks). (b) In the presence of 1 mM calcium chloride (CaCl2), only a single band is visible. (c) The Ca2+‐chelator EGTA (10 mM) suppresses the effect of Ca2+, restoring the presence of two bands in the gel. (d) Replacement of CaCl2 with 1 mM magnesium chloride (MgCl2) has no consequences on the polypeptide migration. Representative picture of an experiment repeated three times with similar results. (e) Quantification of KEA3 messenger RNA (mRNA) accumulation by quantitative polymerase chain reaction (qPCR) in the wild‐type (WT) (red) and in two KEA mutants lacking the EF calcium binding motif (ΔEF‐1 and ΔEF‐2, pooled data from the two lines). Expression was normalized on three house‐keeping genes (RPS, TBP and EF1‐a) n = 3. ns, not significant. (f) Nonphotochemical quenching (NPQ) amplitude and nigericin sensitivity measured in the wild‐type (WT) and in ΔEF lines (ΔEF‐1 and ΔEF‐2, pooled data from the two lines). n = 12–27. Asterisks indicate significant differences in NPQ (P < 0.05). Statistical parameters concerning (a, f) are the same as in Fig. 4(b). ns, not significant.

Similar articles

Cited by

References

    1. van Aalst M, Ebenhöh O, Matuszyńska A. 2021. Constructing and analysing dynamic models with modelbase v.1.2.3: a software update. BMC Bioinformatics 22: 1–15. - PMC - PubMed
    1. Allorent G, Guglielmino E, Giustini C, Courtois F. 2018. Generation of mutants of nuclear‐encoded plastid proteins using CRISPR/Cas9 in the diatom Phaeodactylum tricornutum . Methods in Molecular Biology 1829: 367–378. - PubMed
    1. Allorent G, Tokutsu R, Roach T, Peers G, Cardol P, Girard‐Bascou J, Seigneurin‐Berny D, Petroutsos D, Kuntz M, Breyton C et al. 2013. A dual strategy to cope with high light in Chlamydomonas reinhardtii . Plant Cell 25: 545–557. - PMC - PubMed
    1. Armbruster U, Carrillo LR, Venema K, Pavlovic L, Schmidtmann E, Kornfeld A, Jahns P, Berry JA, Kramer DM, Jonikas MC. 2014. Ion antiport accelerates photosynthetic acclimation in fluctuating light environments. Nature Communications 5: 5439. - PMC - PubMed
    1. Armbruster U, Leonelli L, Galvis VC, Strand D, Quinn EH, Jonikas MC, Niyogi KK. 2016. Regulation and levels of the thylakoid K+/H+ antiporter KEA3 shape the dynamic response of photosynthesis in fluctuating light. Plant and Cell Physiology 57: 1557–1567. - PMC - PubMed

Publication types