. 2022 Apr;52(4):566-581.
doi: 10.1002/eji.202149228. Epub 2022 Feb 12.

A population of naive-like CD4+ T cells stably polarized to the TH 1 lineage

Affiliations

A population of naive-like CD4+ T cells stably polarized to the TH 1 lineage

Jonathan W Lo et al. Eur J Immunol. 2022 Apr.

Abstract

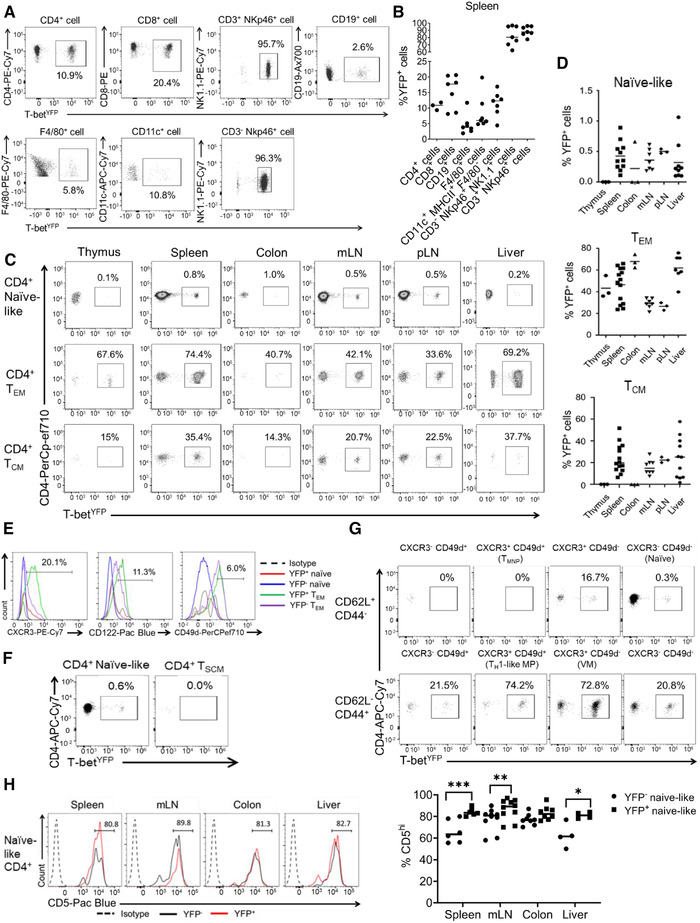
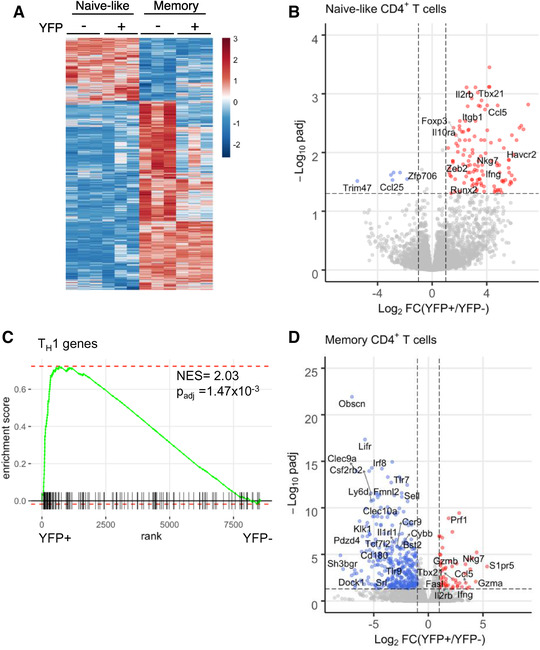
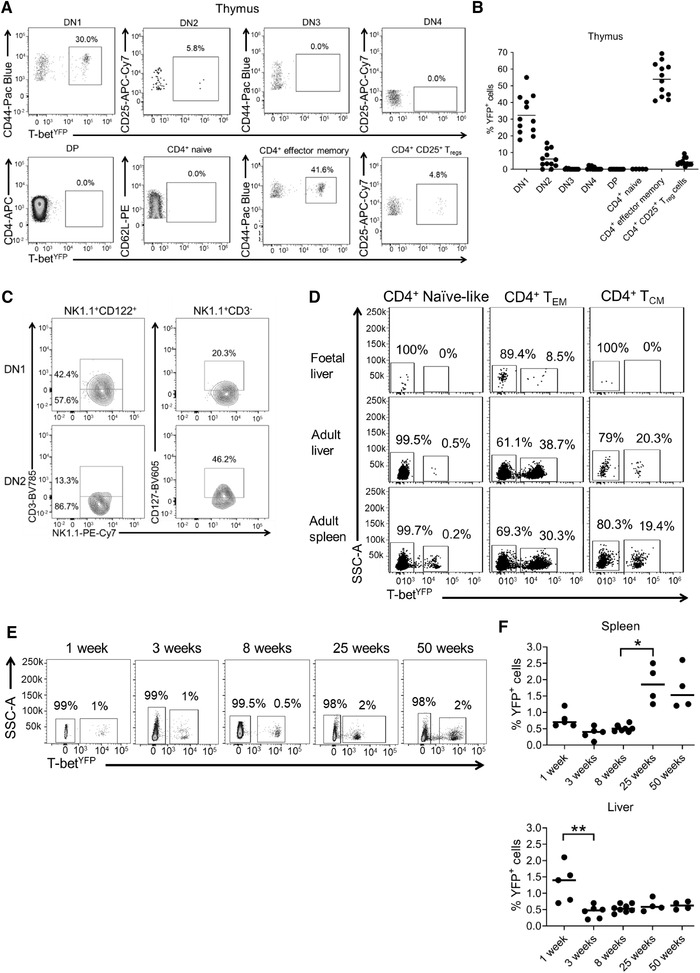
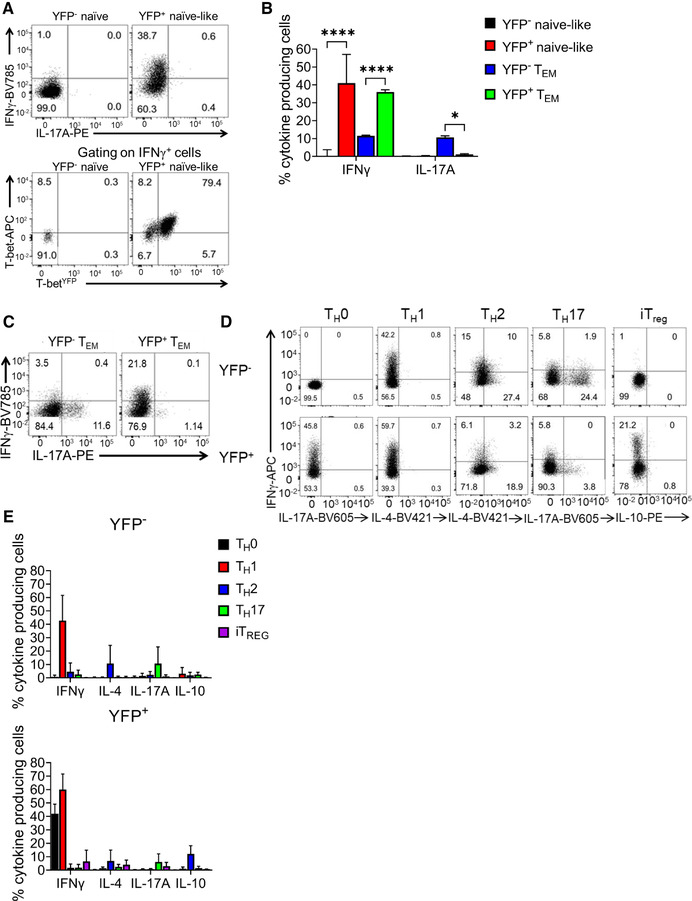
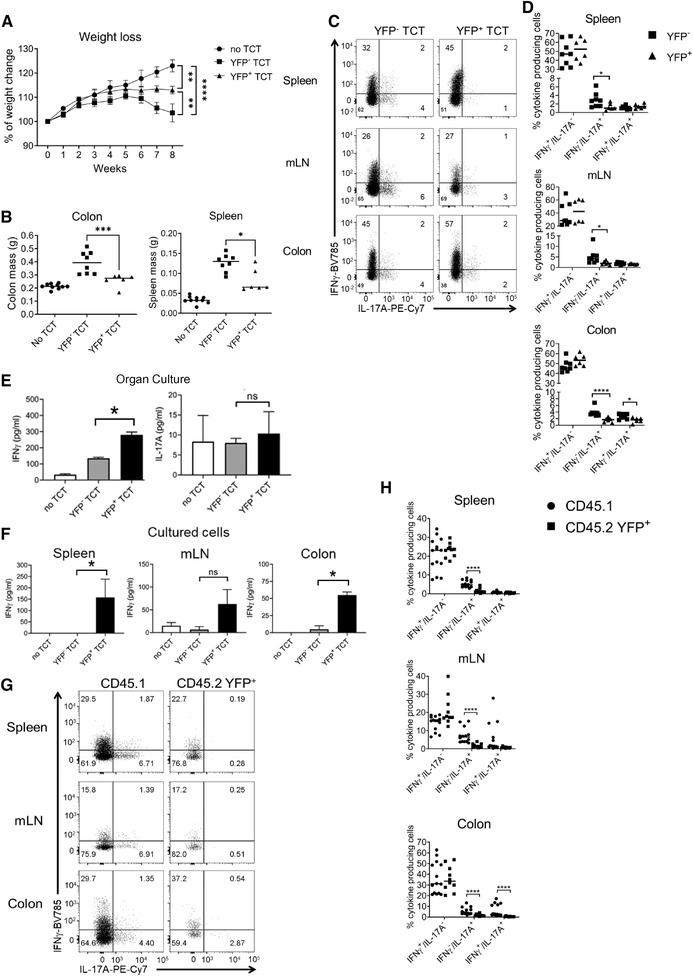
T-bet is the lineage-specifying transcription factor for CD4+ TH 1 cells. T-bet has also been found in other CD4+ T cell subsets, including TH 17 cells and Treg, where it modulates their functional characteristics. However, we lack information on when and where T-bet is expressed during T cell differentiation and how this impacts T cell differentiation and function. To address this, we traced the ontogeny of T-bet-expressing cells using a fluorescent fate-mapping mouse line. We demonstrate that T-bet is expressed in a subset of CD4+ T cells that have naïve cell surface markers and transcriptional profile and that this novel cell population is phenotypically and functionally distinct from previously described populations of naïve and memory CD4+ T cells. Naïve-like T-bet-experienced cells are polarized to the TH 1 lineage, predisposed to produce IFN-γ upon cell activation, and resist repolarization to other lineages in vitro and in vivo. These results demonstrate that lineage-specifying factors can polarize T cells in the absence of canonical markers of T cell activation and that this has an impact on the subsequent T-helper response.

Keywords: CD4 T cells; Gene regulation; IFNg; Immune regulation; T cells; T helper cells; T-bet; TH1; Transgenic models; colitis; mouse model; naive T cells.


Conflict of interest statement

The authors declare that there is no conflict of interest.

Figures

Figure 1
Figure 1
T‐bet fate mapping identifies a population of peripheral naïve‐like CD4+ T cells that have experienced T‐bet expression. (A) Representative flow plots from two independent experiments showing YFP expression in different splenic immune cells populations (n = 7 except for CD4+ T cells where n = 3). (B) Quantification of the mean proportions of YFP+ cells for each cell type shown in A (n = 7 except for CD4+ T cells where n = 3). (C) Representative flow plots from two independent experiments showing YFP expression in the naïve‐like (CD62L+ CD44 CD28+ CD27+), TCM (CD62L+ CD44+ CD28+ CD27+), and TEM (CD62L CD44+ CD28+ CD27) compartments in the thymus, spleen, colon, mesenteric lymph nodes, peripheral lymph nodes, and liver (n = 3 for thymus, colon, and pLN, n = 7 for mLN and liver, and n = 11 for spleen). (D) Mean proportions of YFP+ cells in the naïve, effector memory, and central memory CD4+ T‐cell populations shown in C (n = 3 for thymus, colon, and pLN, n = 7 for mLN and liver, and n = 11 for spleen). (E) Representative histograms from three independent experiments showing surface marker expression of CXCR3, CD122, CD49d in YFP versus YFP+ naïve‐like (live CD3+ CD4+ CD62L+ CD44) and effector memory (live CD3+ CD4+ CD62L CD44+) CD4+ T cells from the spleen. Percentages of YFP+ naïve CD4+ T cells positive for each marker are shown (n = 16). (F) Representative flow plots from three independent experiments showing YFP expression by conventional naïve‐like CD4+ T cells (CD62L+ CD44 CD28+ CD27+ CD127+ CD122 CD95) compared with TSCM (CD62L+ CD44 CD28+ CD27+ CD127+ CD122+ CD95+) from the spleen (n = 16). (G) Representative flow plots from three independent experiments showing YFP expression in splenic CD28+ CD27+ T‐cell populations divided by CD62L, CD44, CXCR3, and CD49d expression. Naïve (CD62L+ CD44 CXCR3 CD49d), TMNP (CD62L+ CD44 CXCR3+ CD49d+), TH1‐like MP (CD62L CD44+ CD49d+ CXCR3+), and VM (CD62L CD44+ CD49d CXCR3+) T‐cell populations are labeled (n = 16). (H) Representative histograms and mean proportions of CD5hi expressing cells from naïve‐like YFP+ CD4+ T cells (live CD3+ CD4+ CD62L+ CD44) and naïve YFP CD4+ T cells in the spleen, mLN, colon, and liver from two independent experiments (n = 6 for spleen and mLN, n = 10 for colon, n = 4 for liver). Percentages shown for YFP+ naïve‐like CD4+ T cells. *< 0.05, **p < 0.01, ***p < 0.005 (Mann–Whitney U‐test).
Figure 2
Figure 2
YFP+ naïve‐like CD4+ T cells have a naïve‐like gene expression profile but exhibit Th1 polarization. (A) Heatmap of relative gene expression between YFP naïve (live CD3+ CD4+ CD62L+ CD44), YFP+ naïve‐like, YFP TEM (live CD3+ CD4+ CD62L CD44+), and YFP+ TEM cells (n = 3). Each row represents a gene and each column a cell sample. Gene expression is shown as z‐score and coloured according to the scale on the right. (B) Volcano plot showing differential gene expression between YFP+ and YFP naïve‐like CD4+ T cells (log2‐fold change vs. adjusted p‐value). Genes more highly expressed in YFP+ cells are in red and those more highly expressed in YFP cells are in blue (p adj < 0.05, |log2FC|>1, n = 3). Selected differentially expressed genes are labeled. (C) Gene set enrichment analysis (GSEA) demonstrating enrichment of TH1 genes within the genes more highly expressed in naïve‐like YFP+ CD4+ cells versus naïve‐like YFP CD4+ cells. (D) As B, except showing differential gene expression between YFP+ and YFP TEM CD4+ T cells (n = 3).
Figure 3
Figure 3
Naïve CD4+ T cells develop and exit the thymus without expressing T‐bet and are not found in utero. (A) Representative flow plots from three independent experiments with four mice in each experiment showing YFP expression in thymic DN1 (CD3 CD44+ CD25), DN2 (CD3 CD44+ CD25+), DN3 (CD3+ CD44 CD25+), DN4 (CD3+ CD44 CD25), DP (CD3+ CD4+ CD8+), naïve CD4+ T cells (CD3+ CD4+ CD8 CD62L+ CD44), effector memory CD4+ T cells (CD3+ CD4+ CD8 CD62L CD44+) and Treg (CD3+ CD4+ CD8 CD25+). (B) Mean proportions of YFP+ cells in the different thymic cell subsets shown in A (n = 12). (C) Representative flow plots from three independent experiments with four mice in each experiment showing NK and NKT markers on YFP+ cells from DN1 (live CD4 CD8 CD44+ CD25 CD122+ NK1.1+) and DN2 (live CD4 CD8 CD44+ CD25+ CD122+ NK1.1+) cells from the thymus. (D) Representative flow plots from one experiment showing YFP expression in naïve‐like (CD62L+ CD44), effector (CD62L CD44+) and central memory (CD62L+ CD44+) CD4+ T cells in the fetal liver (n = 12 fetuses pooled into one sample), adult liver (n = 6), and adult spleen (n = 6). (E) Representative flow plots showing YFP expression in splenic naïve (CD62L+ CD44) CD4+ T cells from 1‐week (n = 5), 3‐week (n = 6), 8‐week (n = 8), 25‐week (n = 4), and 50‐week (n = 4) old mice. (F) Mean proportions of YFP+ cells in the naïve (CD62L+ CD44) CD4+ T‐cell population from 1‐week (n = 5), 3‐week (n = 6), 8‐week (n = 8), 25‐week (n = 4), and 50‐week (n = 4) old mice. *< 0.05, **p < 0.01 (Kruskal–Wallis test with Dunn's corrections).
Figure 4
Figure 4
YFP+ naïve‐like CD4+ T cells resist polarization toward other CD4+ T‐cell lineages. (A) Representative flow plots from three independent experiments (each comprising three replicates) showing cytokine expression (top) or T‐bet and YFP expression (bottom) in YFP and YFP+ naïve‐like (CD62L+ CD44) CD4+ T cells after in vitro activation with anti‐CD3/CD28 and culture with IL‐2. (B) Percentage of cultured YFP and YFP+ naïve‐like (CD62L+ CD44) CD4+ T cells and TEM (CD62LCD44+) producing IFN‐γ or IL‐17A after activation with anti‐CD3/CD28 and culture with IL‐2 (median with range shown, n = 9), *p < 0.05, ****p < 0.0001 (Two‐way ANOVA). (C) Representative flow plots from three independent experiments (each comprising three replicates) showing cytokine expression from in vitro cultured YFP and YFP+ TEM after activation with anti‐CD3/CD28 and culture with IL‐2. (D) Representative flow plots from three independent experiments (each comprising two replicates) showing cytokine expression in naïve‐like (CD62L+ CD44) YFP and YFP+ CD4+ T cells after activation with anti‐CD3/CD28 and polarization in TH0, TH1, TH2 TH17 and iTreg conditions in vitro. (E) Proportion of naïve‐like (CD62L+ CD44) YFP and YFP+ CD4+ T cells producing cytokines after activation with anti‐CD3/CD28 and polarization in TH1, TH2 TH17 and iTreg conditions in vitro (median with range shown, n = 6).
Figure 5
Figure 5
YFP+ cells induce less inflammation and more IFN‐γ compared to conventional naïve CD4+ T cells after transfer to Rag2 / mice. (A) Mean weight change from two independent experiments in Rag2–/– mice after receipt of 25,000 purified naïve‐like YFP+ or naïve YFP CD4+ T cells, or no cell transfer control (n = 8 for YFP transfer, n = 6 for YFP+ transfer, and n = 10 for control). ** p < 0.01, ****p < 0.0001 (Mann‐Whitney U test performed on week 8). (B) Mean spleen and colon mass in Rag2–/– mice after receipt of 25,000 purified naïve‐like YFP+ or naïve YFP CD4+ T cells or no cell transfer control (n = 8 for YFP transfer, n = 6 for YFP+ transfer, and n = 10 for control.) *p < 0.05, ***p < 0.005. (Kruskal–Wallis test with Dunn's corrections). (C) Representative flow plots from two independent experiments showing the proportion of YFP and YFP+ naïve‐like CD4+ T cells that produce IFN‐γ and IL‐17A after transfer into Rag2–/– mice, separated by organ (n = 8 for YFP transfer, n = 6 for YFP+ transfer). (D) Mean proportion of YFP and YFP+ naïve‐like CD4+ T cells, shown in C, that produce IFN‐γ alone, IL‐17A alone, or both IFN‐γ and IL‐17A after transfer into Rag2–/– mice, separated by organ (n = 8 for YFP transfer, n = 6 for YFP+ transfer, from two independent experiments). *p < 0.05 ****p < 0.001 (Mann‐Whitney U test). (E) Quantification of IFN‐γ and IL‐17A in the supernatant by ELISA after 48 h of colon organ culture (n = 3 experiments, each with three technical replicates, except n = 6 experiments for the no transfer control, also with three technical replicates). *p < 0.05 (Kruskal–Wallis test with Dunn's corrections). (F) Quantification of IFN‐γ and IL‐17A in the supernatant of unfractionated cell cultures from colon, spleen, and mLN (n = 3, each with three technical replicates, except n = 6 for the no transfer control, also with three technical replicates). *p < 0.05 (Kruskal–Wallis test with Dunn's corrections). (G) Representative flow plots from two independent experiments showing IFN‐γ and IL‐17A production by naïve‐like CD45.1+ and CD45.2 YFP+ CD4+ T cells after cotransfer at a ratio of 9:1 (n = 8). (H) Proportions of naïve‐like CD45.1+ and CD45.2 YFP+ CD4+ T cells producing IFN‐γ alone, IL‐17A alone, or both IFN‐γ and IL‐17A after cotransfer at a ratio of 9:1 (n = 9). ****p < 0.001 (Mann–Whitney U test).

References

    1. Mosmann, T. R. , Cherwinski, H. , Bond, M. W. , Giedlin, M. A. and Coffman, R. L. , Two types of murine helper T cell clone. I. Definition according to profiles of lymphokine activities and secreted proteins. J. Immunol. 1986. 136: 2348. - PubMed
    1. Szabo, S. J. , Kim, S. T. , Costa, G. L. , Zhang, X. , Fathman, C. G. and Glimcher, L. H. , A novel transcription factor, T‐bet, directs Th1 lineage commitment. Cell 2000. 100: 655–669. - PubMed
    1. Lazarevic, V. , Glimcher, L. H. and Lord, G. M. , T‐bet: a bridge between innate and adaptive immunity. Nat. Rev. Immunol. 2013. 13: 777. - PMC - PubMed
    1. Jenner, R. G. , Townsend, M. J. , Jackson, I. , Sun, K. , Bouwman, R. D. , Young, R. A. , Glimcher, L. H. and Lord, G. M. , The transcription factors T‐bet and GATA‐3 control alternative pathways of T‐cell differentiation through a shared set of target genes. Proc. Natl. Acad. Sci. 2009. 106: 17876. - PMC - PubMed
    1. Lord, G. M. , Rao, R. M. , Choe, H. , Sullivan, B. M. , Lichtman, A. H. , Luscinskas, F. W. and Glimcher, L. H. , T‐bet is required for optimal proinflammatory CD4+ T‐cell trafficking. Blood 2005. 106: 3432. - PMC - PubMed

Substances