. 2022 Apr;25(4):876-888.
doi: 10.1111/ele.13965. Epub 2022 Jan 28.

Leapfrog dynamics in phage-bacteria coevolution revealed by joint analysis of cross-infection phenotypes and whole genome sequencing

Affiliations

Leapfrog dynamics in phage-bacteria coevolution revealed by joint analysis of cross-infection phenotypes and whole genome sequencing

Animesh Gupta et al. Ecol Lett. 2022 Apr.

Abstract

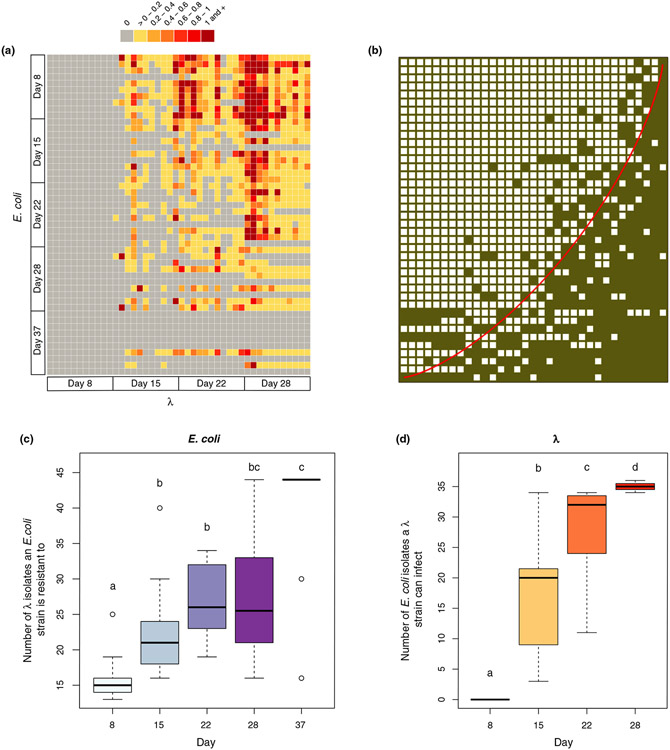
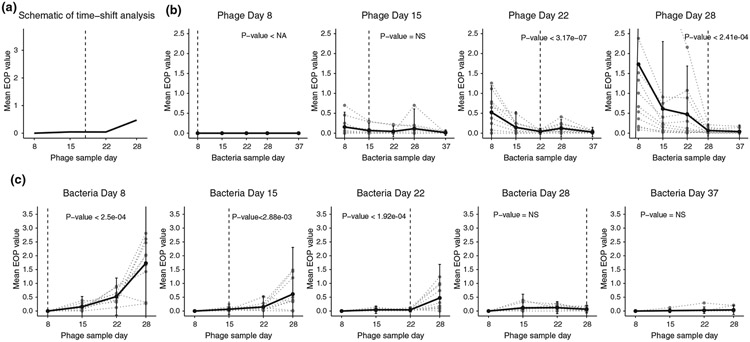
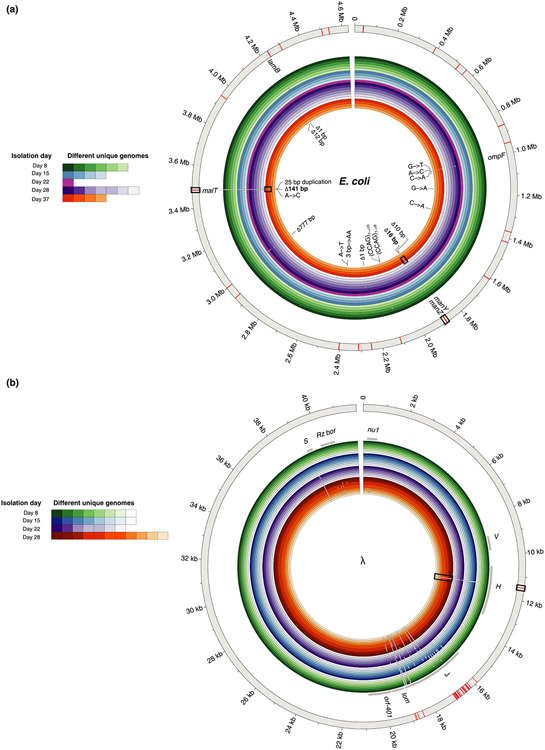
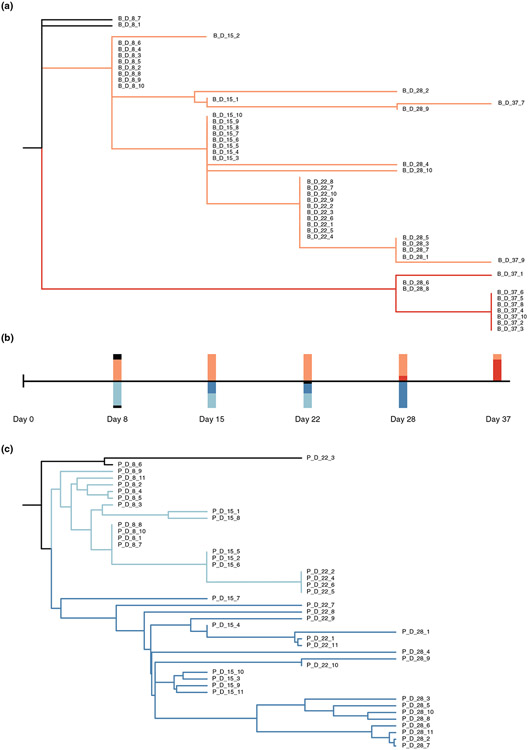
Viruses and their hosts can undergo coevolutionary arms races where hosts evolve increased resistance and viruses evolve counter-resistance. Given these arms race dynamics (ARD), both players are predicted to evolve along a single trajectory as more recently evolved genotypes replace their predecessors. By coupling phenotypic and genomic analyses of coevolving populations of bacteriophage λ and Escherichia coli, we find conflicting evidence for ARD. Virus-host infection phenotypes fit the ARD model, yet genomic analyses revealed fluctuating selection dynamics. Rather than coevolution unfolding along a single trajectory, cryptic genetic variation emerges and is maintained at low frequency for generations until it eventually supplants dominant lineages. These observations suggest a hybrid 'leapfrog' dynamic, revealing weaknesses in the predictive power of standard coevolutionary models. The findings shed light on the mechanisms that structure coevolving ecological networks and reveal the limits of using phenotypic or genomic data alone to differentiate coevolutionary dynamics.


Conflict of interest statement

CONFLICT OF INTEREST

The authors declare no competing interests.

Figures

FIGURE 1
FIGURE 1
Host resistance and phage infectivity measured by pairwise plaque assays. (A) Phage-bacteria infection network where the colour of each cell is determined by the efficiency of plating (EOP) values obtained for that host-phage interaction pair; grey cells represent no infection by λ on the given Escherichia coli strain, yellow represents low infectivity and red represents high infectivity. (B) The original network in (a) reassembled using the software BiMat to visualise maximal nestedness (Flores et al., 2016). Filled squares indicate a combination of host and phage that result in successful interactions (EOP >0), and the red line highlights the isocline using the nestedness temperature calculator algorithm. The nestedness value of the network utilises the nestedness based on overlapping and decreasing fill metric, which was significantly greater than the null expectation when constraining the fill of the bipartite network (measured value of nestedness 0.839 vs. null value of nestedness 0.638 ± 0.011 based on 200 trials). (C) Boxplots showing the total number of λ isolates from all days that E. coli genotypes are resistant to across different sampling days. (D) Boxplots showing the total number of E. coli isolates from all days that λ genotypes can infect across different sampling days. Lowercase letters in (c) and (d) denote significant difference between different days via Tukey's honest significance test: (c) ANOVA: F4,45 = 13.3, p = 3.11e-07, (d) ANOVA: F3,40 = 67.05, p = 1.17e-15. A simple linear regression model with time as the predictor variable was also used to test if E. coli evolved increasing resistance in (c) and λ evolved increasing host range in (d) (statistics in the main text)
FIGURE 2
FIGURE 2
Time-shift analysis results from different checkpoints. (a) Schematic for the time-shift analysis that compares the mean efficiency of plating (EOP) from hosts or phage interacting with their counterparts from the past, contemporary and the future. (b) Time-shift results from phage checkpoints day 8, 15, 22 and 28 respectively. The grey dotted line shows the time-shift curve for each individual phage and the black line shows the average. The vertical dashed line represents the phage sample day. The p-values shown here are the maximum p-value from one-sided paired t-tests comparing the initial checkpoints with each of the later checkpoints. (c) Time-shift results from host checkpoints day 8, 15, 22, 28 and 37 respectively. The grey dotted line shows the time-shift curve for each individual host and the black line shows the average. The vertical dashed line represents the host sample day. The p-values shown here are the maximum p-value from one-sided paired t-tests comparing the final checkpoints with each of the previous checkpoints
FIGURE 3
FIGURE 3
Genomic diversity in clones isolated from different days and whole population sequencing for (a) Escherichia coli and (b) λ. The outermost grey ring represents the reference genome. The inner coloured rings represent the isolates sequenced from different time points (outer rings are genomes isolated from earlier time points). Shades within each colour depict unique genomes sequenced from each time point. White gaps in the genomic rings indicate the location of mutations. All 18 unique mutations found in clonal isolates have been labelled for E. coli in (a); however, due to the large number of mutations in λ, only the gene names that harbour mutations from clonal isolates have been identified (grey bars). Note that white gaps corresponding to mutations are larger than a single base, so occasionally a single gap represents multiple adjacent mutations. The red bars in the outermost grey ring indicate the placement of mutations uncovered by the whole population sequencing at day 8. The mutations that become dominant at later stages of coevolution and were also found in day 8 population sequencing have been highlighted with rectangular boxes
FIGURE 4
FIGURE 4
Reconstructed phylogenetic trees of the host and phage. (a) The host phylogenetic tree based on host mutation profiles. All completely resistant host strains are located on the red branch. Bars above the time scale in (b) represents the proportion of host strains from each coloured branch across different checkpoints. (c) The phage phylogenetic tree based on the phage mutation profiles. All day 28 phage strains are located on the dark blue branch. Bars below the time scale in (b) represents the proportion of phage strains from each coloured branch across different checkpoints

References

    1. Adams MH (1959) Bacteriophages. New York: Interscience Publishers Inc.
    1. Agrawal A & Lively CM (2002) Infection genetics: gene-for-gene versus matching-alleles models and all points in between. Evolutionary Ecology Research, 4, 79–90.
    1. Almeida-Neto M, Guimarães P, Guimarães PR Jr, Loyola RD & Ulrich W (2008) A consistent metric for nestedness analysis in ecological systems: reconciling concept and measurement. Oikos, 117, 1227–1239.
    1. Andrews S (2010) FastQC: A Quality Control Tool for High Throughput Sequence Data [Online]. Available at: http://www.bioinformatics.babraham.ac.uk/projects/fastqc/ [Accessed May 2018].
    1. Ashby B, Iritani R, Best A, White A & Boots M (2019) Understanding the role of eco-evolutionary feedbacks in host-parasite coevolution. Journal of Theoretical Biology, 464, 115–125. - PubMed

LinkOut - more resources