. 2022 Mar;9(9):e2105696.
doi: 10.1002/advs.202105696. Epub 2022 Jan 29.

Mouse Modeling Dissecting Macrophage-Breast Cancer Communication Uncovered Roles of PYK2 in Macrophage Recruitment and Breast Tumorigenesis

Affiliations

Mouse Modeling Dissecting Macrophage-Breast Cancer Communication Uncovered Roles of PYK2 in Macrophage Recruitment and Breast Tumorigenesis

Anna-Katharina Müller et al. Adv Sci (Weinh). 2022 Mar.

Abstract

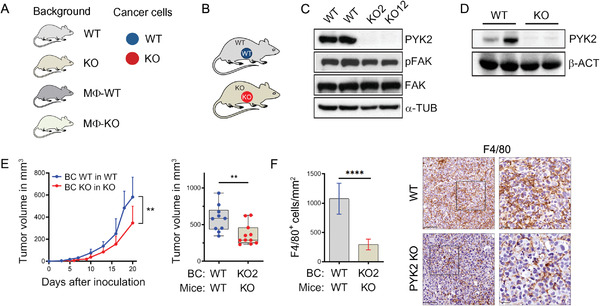
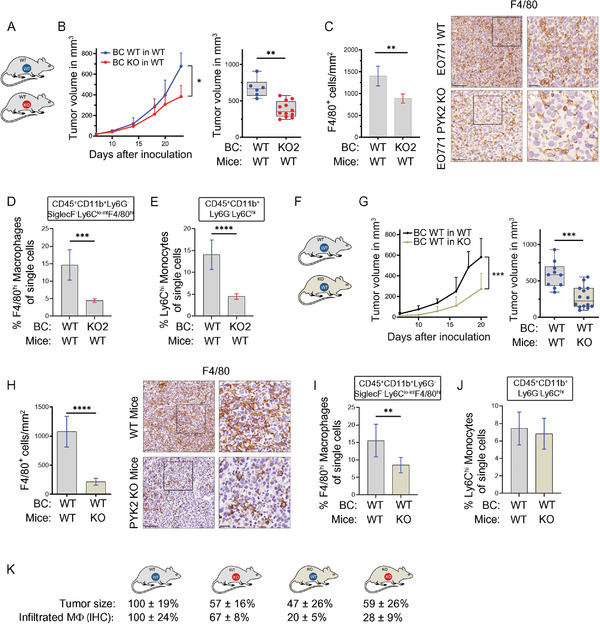
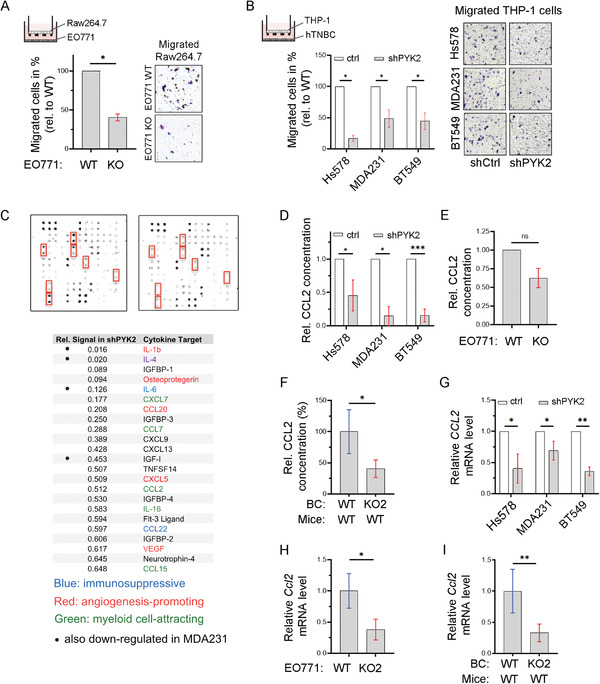
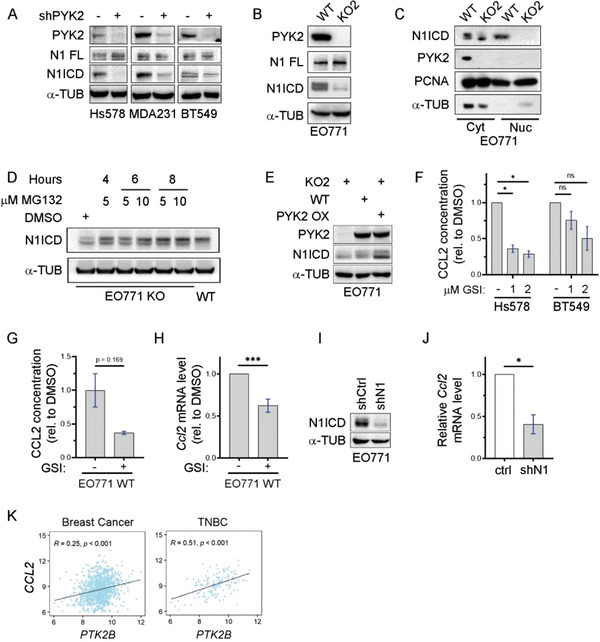
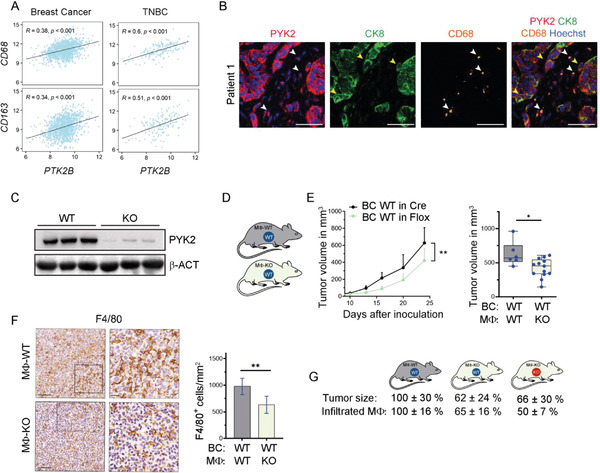
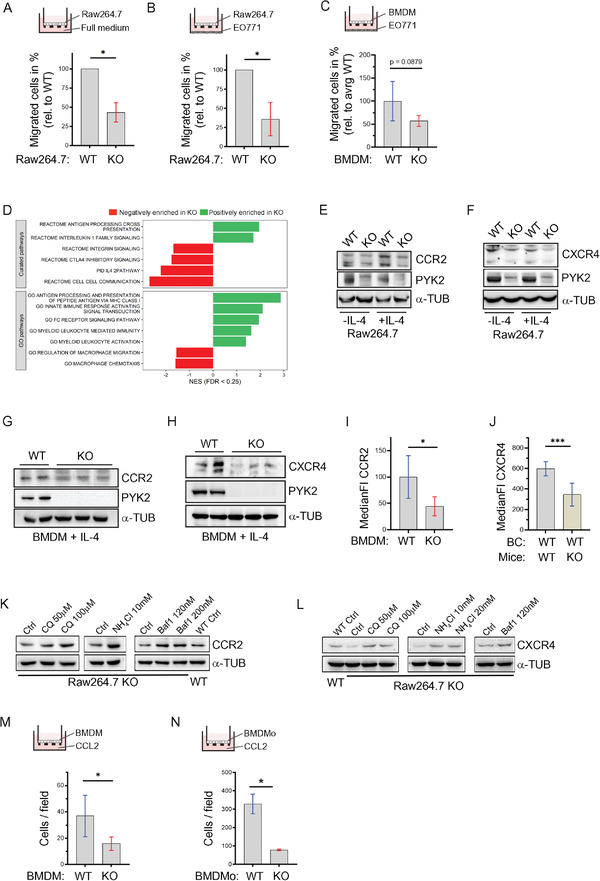
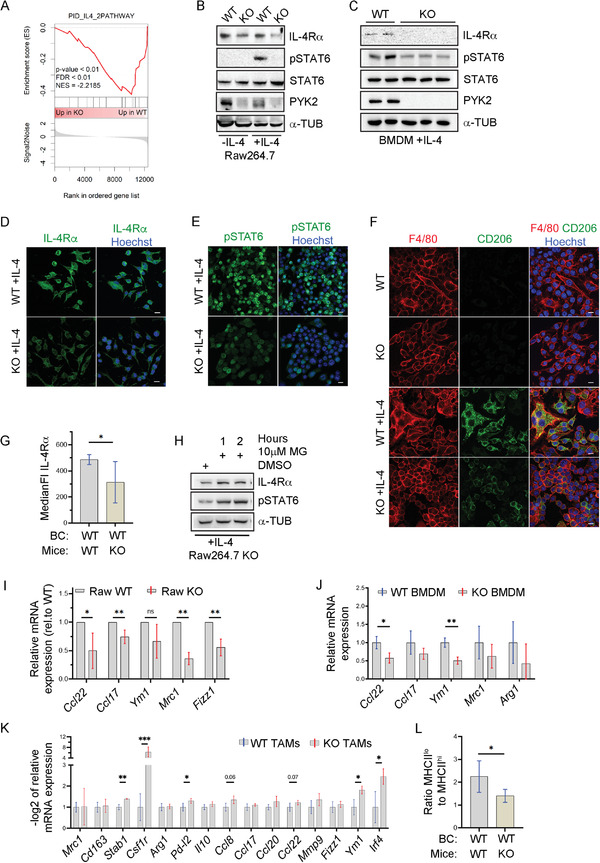
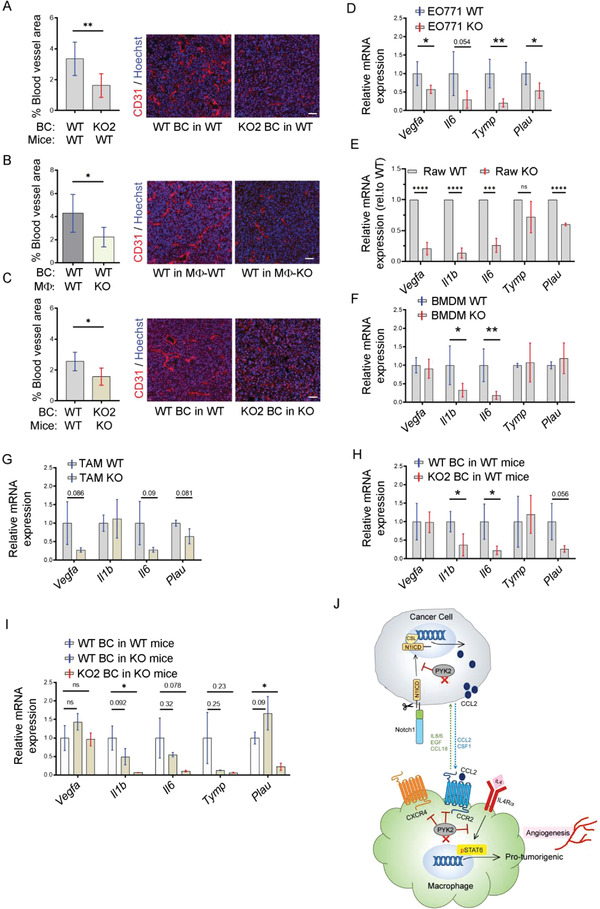
Macrophage infiltration in mammary tumors is associated with enhanced tumor progression, metastasis, and poor clinical outcome, and considered as target for therapeutic intervention. By using different genetic mouse models, the authors show that ablation of the tyrosine kinase PYK2, either in breast cancer cells, only in the tumor microenvironment, or in both, markedly reduces the number of infiltrating tumor macrophages and concomitantly inhibits tumor angiogenesis and tumor growth. Strikingly, PYK2 ablation only in macrophages is sufficient to induce similar effects. These phenotypic changes are associated with reduced monocyte recruitment and a substantial decrease in tumor-associated macrophages (TAMs). Mechanistically, the authors show that PYK2 mediates mutual communication between breast cancer cells and macrophages through critical effects on key receptor signaling. Specifically, PYK2 ablation inhibits Notch1 signaling and consequently reduces CCL2 secretion by breast cancer cells, and concurrently reduces the levels of CCR2, CXCR4, IL-4Rα, and Stat6 activation in macrophages. These bidirectional effects modulate monocyte recruitment, macrophage polarization, and tumor angiogenesis. The expression of PYK2 is correlated with infiltrated macrophages in breast cancer patients, and its effects on macrophage infiltration and pro-tumorigenic phenotype suggest that PYK2 targeting can be utilized as an effective strategy to modulate TAMs and possibly sensitize breast cancer to immunotherapy.

Keywords: Notch1; PYK2; breast cancer; crosstalk signaling; tumor microenvironment; tumor-associated macrophages.


Conflict of interest statement

The authors declare no conflict of interest.

Figures

Figure 1
Figure 1
Ablation of PYK2 reduced breast cancer growth and TAM numbers. A) Schematic overview of the different mouse backgrounds and breast cancer cell genotypes used throughout the manuscript figures. Mouse background: gray (WT), gold (total PYK2 KO), dark gray (MΦ‐WT), and light green (MΦ‐KO). Breast cancer cells: WT (blue) or PYK2 KO (red) EO771 cells. B) Schematic presentation of the analyzed tumor models: wild‐type (WT) or PYK2 KO (KO) EO771 cells were orthotopically injected into WT or PYK2 KO (KO) mice. C,D) Western blot analyses confirmed PYK2 deletion in the two CRISPR/Cas9‐mediated PYK2 KO EO771 cell lines (KO2 and KO12) (C), and in normal breast tissue from PYK2 KO mice (D). E) Tumor growth curves over 20 days show the mean tumor volume at the indicated time points following EO771 implantation (WT and KO) in WT mice (n = 10) or PYK2 KO mice (n = 11); statistical significance was determined by mixed‐effects model. Volume of individual tumor at day 20 is shown in the box plot; statistical significance was determined by Welch t‐test. F) Quantification of F4/80‐positive cells in tumor sections from WT (n = 9) and PYK2 KO (n = 6) mice at day 20 following implantation (Experimental Section). Statistical significance was determined by Welch t‐test. Representative immunohistochemical images are shown. Scale bar: 50 µm. BC (breast cancer).
Figure 2
Figure 2
PYK2 affects macrophage infiltration and breast cancer growth in different mouse models. A) Schematic presentation of the analyzed tumor models; wild‐type (WT) or PYK2 KO (KO) EO771 BC cells were orthotopically injected into WT C57B/L6 mice. B) Tumor growth curves over 24 days show the mean tumor volume at the indicated time points following implantation of WT (n = 6) and PYK2 KO2 (n = 12) EO771 cells into WT mice; statistical significance was determined by 2‐way ANOVA. Volume of individual tumors at day 24 is shown in the box plot; statistical significance was determined by Welch t‐test. C) Quantification of F4/80‐stained cells on sections from WT and BC PYK2 KO tumors in WT mice (WT/WT vs KO2/WT). Representative IHC images of WT/WT (n = 6) and KO2/WT (n = 5) are shown. Scale bar: 100 µm, 25 µm (for inset). Statistical significance was determined by Welch t‐test. D,E) Flow cytometry analysis of WT/WT (n = 8) and KO2/WT (n = 8) tumors depicted as percentages of single cells showing F4/80hi macrophages (CD45+CD11b+Ly6Clo‐intLy6GSiglecFF4/80hi) (D) and Ly6Chi monocytes (CD45+CD11b+Ly6ChiLy6GSiglecF) (E). Statistical significance was determined by Welch t‐test. F) Schematic representation of the analyzed tumor model: WT BC cells (EO771) were injected into WT and PYK2 KO mice. G) Tumor growth curves over 20 days show the mean tumor volume at the indicated time points following implantation of WT EO771 cells into WT (n = 10) and PYK2 KO (n = 14) mice; statistical significance was determined by mixed‐effects model. Volume of individual tumor at day 20 is shown in the box plot; statistical significance was determined by Welch t‐test for individual time points. H) Quantification of F4/80‐stained cells on sections from WT tumors in WT and PYK2 KO mice (WT/WT vs WT/KO). Representative IHC images of WT/WT (n = 9, the same as in Figure 1F) and WT/KO (n = 6) are shown. Scale bar: 100 µm, 25 µm (for inset). The same WT/WT data was used in panels G, H and in Figures 1E, F. I,J) Flow cytometric analysis of WT/WT (n = 8) and WT/KO (n = 8) tumors depicted as percentages of single cells showing F4/80hi macrophages (CD45+CD11b+Ly6Clo‐intLy6GSiglecFF4/80hi) (I) and Ly6Chi monocytes (CD45+CD11b+Ly6ChiLy6GSiglecF) (J). K) Graphical summary of tumor volume and relative numbers of tumor‐associated macrophages (IHC) in the different models studied. Effects were calculated as fold of control (%).
Figure 3
Figure 3
PYK2 deletion in breast cancer cells modulates secretion of CCL2 and other cytokines. A) Scheme of the transwell system with murine WT Raw264.7 macrophages in the upper chamber and control or PYK2 KO EO771 breast cancer cells in the bottom. Migration of Raw264.7 cells was quantified 4 h after seeding. Shown are mean values (ratios of KO to WT) ± SD of two independent experiments. Statistical significance was determined by one sample t‐test. Representative images are shown on the right. B) Schematic diagram of a transwell system with human THP‐1 monocytes in the upper chamber and control or PYK2 KD (by shRNA) human TNBC cell lines (Hs578T, MDA‐MB‐231, and BT549) in the bottom. Migration of THP‐1 was quantified 16 h after seeding. Shown are mean values (ratios of KD to control) ± SD of 2 (MDA‐MB‐231) or 3 (Hs578T, BT549) independent experiments. Statistical analysis was determined by one sample t‐test. Representative images are shown on the right. C) Conditioned media of control and PYK2 KD BT549 and MDA‐MB‐231 (Figure S3A, Supporting Information) cells were collected and analyzed by a Human Cytokine array (Experimental Section). Results of control and PYK2‐depleted BT549 cells are shown. Relative signal intensities of significantly downregulated secreted cytokines/chemokines from PYK2‐depleted BT549 cells relative to control cells are shown in the table. D) Levels of secreted CCL2 in conditioned media of control and PYK2 KD human TNBC cell lines (Hs578T, MDA‐MB‐231, and BT549) were assessed by ELISA. Shown are relative values in PYK2 KD as ratio of control, as obtained in two independent experiments with two samples each. Statistical significance was determined by one sample t‐test. E) Relative levels of CCL2 in conditioned medium of PYK2 KO (KO2) EO771 cells compared to WT control was determined by ELISA. Shown are results (ratios of KO to WT) from two independent experiments. Statistical significance was determined by one sample t‐test. F) Relative levels of CCL2 protein in tumor lysates from PYK2 KO (KO2) EO771 tumors (n = 4) compared to WT tumors (n = 4). Breast cancer cells were injected into WT mice and CCL2 level was assessed by ELISA. Statistical significance was determined by Welch t‐test. G) Relative levels of human CCL2 transcripts in control and PYK2 KD human TNBC cell lines (Hs578T, MDA‐MB‐231, and BT549) were determined by qPCR. Shown are mean values (ratios of KD to control) ± SD of 3 (Hs578T, BT549) or 5 (MDA‐MB‐231) independently generated sample groups (ratios of KD to control each). Statistical significance was determined by one sample t‐test. H) Relative levels of mouse Ccl2 transcripts in WT and PYK2 KO (KO2) EO771 cells were determined by qPCR. Shown are mean values ± SD of 3 (KO2) or 4 (WT) independently generated samples. Statistical significance was determined by Welch t‐test. I) Relative levels of mouse Ccl2 transcripts in tumors driven from WT (n = 5) or PYK2 KO2 (n = 6) EO771 cells were determined by qPCR. Statistical significance was determined by Welch t‐test.
Figure 4
Figure 4
Link between PYK2, Notch1, and CCL2 in breast cancer. A,B) Protein levels of full length Notch1 (N1 FL) and N1ICD in either control or PYK2 KD (shPYK2) TNBC cell lines (A), or in control (WT) and PYK2 KO (KO2) EO771 cells (B) were assessed by Western blot. C) Western blot analysis of N1ICD in cytosolic (Cyt) and nuclear (Nuc) fractions from WT and PYK2 KO (KO2) EO771cells. D) PYK2 KO EO771 cells (KO2) were treated with the indicated concentrations of the proteasome inhibitor MG132 for the indicated time points. The protein levels of N1ICD in untreated (DMSO), MG132 treated, and control WT EO771 lysates were determined by Western blotting E) PYK2 overexpression in EO771 PYK2 KO cells restored N1ICD levels as shown by Western blot analysis using the indicated antibodies. F) Effect of gamma secretase inhibitor (GSI, LY411575) on the level of secreted CCL2 from Hs578T and BT549 TNBC cells was assessed by ELISA using conditioned media from control (−) and GSI‐treated cells (1 × 10⁻⁶ m, 2 × 10⁻⁶ m) for 24 h. Shown are relative concentration of treated samples compared to untreated control as obtained from two independent experiments. Shown are mean values (ratios of treated to untreated) ± SD. Statistical significance was determined by one sample t‐test. G) Relative CCL2 level in conditioned medium from EO771 WT cells treated with GSI (1 × 10⁻⁶ m LY411575) for 24 h, as compared to vehicle control (−). Shown are mean values (ratios of treated to untreated) ± SD from two independent experiments. Statistical significance was determined by Welch t‐test. H) Relative Ccl2 mRNA levels in EO771 cells treated with GSI (1 × 10⁻⁶ m LY411575) for 24 h as determined by qPCR analysis. Shown are mean values ± SD of five independently generated sample groups (ratios of treated (+) to untreated (−)). Statistical significance was determined by one sample t‐test. I) Western blot analysis confirmed Notch1 deletion upon lentivirus‐mediated knockdown (shN1) in EO771 WT cells. J) Relative Ccl2 mRNA levels in EO771 Notch1 knockdown cells as compared to control cells were determined by qPCR analysis. Shown are mean values ± SD of four independently generated sample groups (ratios of KD to control each). Statistical significance was determined by one sample t‐test. K) Correlation between PTK2B and CCL2 expression in all breast cancer samples (n = 958) or only in TNBC samples (n = 138) using the TCGA datasets. Pearson's correlation coefficient (R) and p‐values are indicated.
Figure 5
Figure 5
PYK2 correlates with macrophage markers in human TNBC and its macrophage‐specific ablation reduces tumor growth and TAM numbers. A) Pearson's correlation between PTK2B and CD68 or CD163 expression in all breast cancer samples (n = 958) or only in TNBC samples (n = 138) using the TCGA datasets. Pearson's correlation coefficient (R) and p‐values are indicated. B) Representative images of human TNBC sections immuno‐stained for PYK2 (red), cytokeratin 8 (CK8, green), and the macrophage marker CD68 (orange). Macrophages (white arrowheads), tumor cells (yellow arrowheads). Scale bar: 50 µm. C) Western blot analysis for PYK2 of BMDMs from Cre control (MΦ‐WT) and macrophage specific PYK2 KO (MΦ‐KO) mice. D) Schematic representation of the analyzed tumor model; EO771 WT BC cells were injected into Cre control (Mϕ‐WT) or macrophage‐specific PYK2 KO (MΦ‐KO) mice. E) Tumor growth curves over 24 days show the mean tumor volume at the indicated time points following implantation of WT EO771 cells into MΦ‐WT (n = 6) and MΦ‐KO (n = 13) mice; statistical significance was determined by two‐way ANOVA. Volume of individual tumors at day 24 is shown in the box plot; statistical significance was determined by Welch t‐test. F) Quantification of F4/80‐stained cells on sections from WT tumors in MΦ‐WT (n = 6) and MΦ‐KO (n = 14) mice. Representative IHC images are shown. Scale bar: 100 µm, 25 µm (for inset). G) Graphical summary of tumor volume and relative numbers of TAMs (IHC) in the different models studied. Effects were calculated as fold of control (%).
Figure 6
Figure 6
PYK2 ablation modulates the transcriptome, migration, chemotaxis, and protein levels of CCR2 and CXCR4 in macrophages. A) Migration of WT and PYK2 KO Raw264.7 cells toward full medium was assessed by transwell migration assay. Ratios of KO to WT (depicted in %) from two independent experiments are shown. Statistical significance was determined by one sample t‐test. B) Migration of WT and PYK2 KO Raw264.7 cells toward EO771 WT cells was assessed by transwell migration assay. Ratios of KO to WT (depicted in %) from three independent experiments are shown. Statistical significance was determined by one sample t‐test. C) Results of transwell migration assay of BMDMs from MΦ‐WT (n = 5) and MΦ‐KO (n = 5) mice toward EO771 cells are shown. Values are depicted as migrated cells in percentage relative to average WT value. Statistical significance was determined by Welch t‐test. D) Gene set enrichment analysis (GSEA) of RNA‐Seq data from WT and PYK2 KO BMDMs. Bone marrow cells were derived from WT and PYK2 KO mice (n = 3 each) (Experimental Section). RNA was extracted and subjected to RNA‐Seq analysis. GSEA was performed using curated signatures from the MSigDB database, as well as the gene ontology (GO) biological processes pathways. Shown is the normalized enrichment score (NES) of relevant significant (FDR < 0.25) pathways. E,F) Western blot analysis shows the levels of CCR2 (E), CXCR4 (F), and PYK2 proteins in untreated (−IL‐4) or IL‐4‐treated (+IL‐4) Raw264.7 cells (WT and PYK2 KO). G,H) Western blot analysis shows the levels of CCR2 (G), CXCR4 (H), and PYK2 proteins in IL‐4‐treated (+‐IL4) BMDMs. I) Levels of CCR2 on the surface of BMDMs from WT (n = 5) and PYK2 KO (n = 5) mice was determined by flow cytometry (Experimental Section). Median fluorescent intensity (MFI) for CCR2 was measured and MFI of the respective isotype control subtracted. Statistical significance was determined by Welch t‐test. J) Levels of CXCR4 on the surface of F4/80hi macrophages from EO771 WT tumors in WT (n = 8) and PYK2 KO (n = 8) mice was determined by flow cytometry (Experimental Section). MFI for CXCR4 was measured and MFI of the respective isotype control subtracted. Statistical significance was determined by Welch t‐test. K) Western Blot analysis of CCR2 levels in Raw264.7 cells (WT and KO) treated with the indicated lysosomal inhibitors (CQ = chloroquine, Baf1 = bafilomycin) for 12 h. L) Western Blot analysis of CXCR4 levels in Raw264.7 cells (WT and PYK2 KO) treated with the indicated lysosomal degradation inhibitors as described in (J). M) Results of transwell migration assay of BMDMs from WT (n = 5) and PYK2 KO (n = 5) mice toward medium containing 0.5% heat inactivated FBS and 20 ng mL−1 murine CCL2. Statistical significance was determined by Welch t‐test. N) Results of transwell migration assay of BMDMo (bone marrow derived monocytes enriched fraction) from WT (n = 3) and PYK2 KO (n = 3) mice toward medium containing 0.5% heat inactivated FBS and 20 ng mL−1 murine CCL2. Statistical significance was determined by Welch t‐test.
Figure 7
Figure 7
PYK2 depletion affects IL‐4Rα levels, STAT6 phosphorylation, macrophage polarization, and pro‐tumorigenic markers. A) GSEA of the IL‐4 pathway reveals its relative enrichment in WT compared to PYK2 KO BMDMs. B,C) Western blot analysis shows the levels of IL‐4Rα, STAT6, pSTAT6, and PYK2 proteins in untreated (−IL‐4) or IL‐4‐treated (+‐IL4) Raw264.7 cells (WT and KO) (B), and IL‐4‐treated BMDMs (C). D) Representative immunofluorescence (IF) images of IL‐4‐treated WT and PYK2 KO Raw264.7 cells immunostained for IL‐4Rα. Scale bar: 10 µm. E) Representative immunofluorescence (IF) images of IL‐4‐treated WT and PYK2 KO Raw264.7 cells immunostained for pSTAT6. Scale bar: 10 µm. F) Representative immunofluorescence (IF) images of non‐ and IL‐4‐treated WT and PYK2 KO Raw264.7 cells double immunostained for F4/80 and CD206. Scale bar: 10 µm. G) Levels of IL‐4Rα on the surface of F4/80hi macrophages sorted from tumors of EO771 WT (n = 8) and PYK2 KO (n = 8) mice was determined by flow cytometry (Experimental Section). MFI for IL‐4Rα was measured and MFI of the respective isotype control subtracted. Statistical significance was determined by Welch t‐test. H) IL‐4‐treated PYK2 KO Raw264.7 cells were treated with the proteasome inhibitor MG132 (MG, 10 × 10−6 m) for the indicated time points. The protein levels of IL‐4Rα and pSTAT6 in untreated (DMSO) and MG132 treated Raw264.7 cell lysates were determined by Western blotting. I) Expression of pSTAT6 target genes in IL‐4‐treated PYK2 KO Raw267.4 cells relative to WT control was assessed by qPCR. Shown are mean values of 4–5 independently generated sample groups (ratios of KO to WT each). Statistical significance was determined by one sample t‐test for each target. J) Expression of pSTAT6 target genes in IL‐4‐treated WT (n = 3) and PYK2 KO (n = 3) BMDMs was assessed by qPCR. Statistical significance was determined by Welch t‐test for each target. K) Expression of polarization marker genes in TAMs sorted from EO771 WT tumors induced in WT and PYK2 KO mice was assessed by qPCR. Shown are −log2 values ± SD of relative mRNA expression (ΔCt) in PYK2 KO TAMs to WT control (n = 3–6). Statistical significance was determined by Welch t‐test for each target gene. L) Ratio of MHCIIlow to MHCIIhigh macrophages in WT tumors of WT and KO mice. Percentages of MHCIIhigh and MHCIIlow macrophages were determined by flow cytometry and the ratio calculated subsequently. Statistical significance was determined by Welch t‐test.
Figure 8
Figure 8
PYK2 depletion reduces tumor angiogenesis. A–C) Quantification and representative IF images of blood vessel area in tumors induced by injection of (A) WT EO771 (n = 6) or PYK2 KO2 EO771 (n = 7) cells into WT mice (B) WT EO771 cells into either MΦ‐WT (n = 6) or MΦ‐KO (n = 8) mice; and (C) WT EO771 cells into WT mice (n = 5) or PYK2 KO2 EO771 cells into PYK2 KO mice (n = 6). Statistical significance was determined by Welch t‐test. Scale bar: 50 µm. D–I) Expression of angiogenesis‐related genes in WT (n = 5) and PYK2 KO (n = 5) EO771 cells (D), in WT (n = 5) and PYK2 KO (n = 5) Raw264.7 cells (E), in WT (n = 5) and PYK2 KO (n = 5–6) BMDMs (F), and TAMs sorted from EO771 WT tumors induced in WT (n = 4) and PYK2 KO (n = 3) mice (G), in EO771 WT (n = 4) and KO (n = 5–6) tumors induced in WT mice (H), and in EO771 WT tumors induced in WT (n = 3–4) and KO (n = 4) mice and in EO771 KO tumors induced in KO (n = 3) mice (I). Statistical significance was determined by Welch t‐test for (D), (F), (G), and (H); by one sample t‐test for (E); and by Brown‐Forsythe and Welch ANOVA with Dunnett's T3 multiple comparison test for (I). J) Model showing the multifaceted roles of PYK2 in breast cancer–macrophages communication, macrophages recruitment, and polarization. In breast cancer cells, PYK2 stabilizes N1ICD, which regulates CCL2 transcription and consequently CCL2 release. CCL2 secreted from cancer cells is required for recruitment of monocytes/macrophages through their CCR2 receptor. In addition to the CCL2/CCR2 axis, macrophage recruitment is regulated by other chemotactic receptors, such as CXCR4, and by cell autonomous migratory properties, which are also affected by PYK2 deficiency. Ablation of PYK2 in macrophages also reduced the level of IL‐4Rα, the main receptor needed for pro‐tumorigenic polarization, and robustly reduced STAT6 activation. Consequently, transcriptions of STAT6 target genes are decreased, leading to less pro‐tumorigenic TAMs, reduced angiogenesis, and tumor growth. CSL (CBF‐1, Suppressor of Hairless, Lag‐2), a transcriptional regulator and N1CD binding protein.

References

    1. Tariq M., Zhang J., Liang G., Ding L., He Q., Yang B., J. Cell. Biochem. 2017, 118, 2484. - PubMed
    1. Dehne N., Mora J., Namgaladze D., Weigert A., Brune B., Curr. Opin. Pharmacol. 2017, 35, 12. - PubMed
    1. Laoui D., Movahedi K., Van Overmeire E., Van den Bossche J., Schouppe E., Mommer C., Nikolaou A., Morias Y., De Baetselier P., Van Ginderachter J. A., Int. J. Dev. Biol. 2011, 55, 861. - PubMed
    1. Qiu S. Q., Waaijer S. J. H., Zwager M. C., de Vries E. G. E., van der Vegt B., Schroder C. P., Cancer Treat. Rev. 2018, 70, 178. - PubMed
    1. Salemme V., Centonze G., Cavallo F., Defilippi P., Conti L., Front. Oncol. 2021, 11, 610303. - PMC - PubMed

Publication types

Substances