. 2022 Apr;28(4):214.e1-214.e11.
doi: 10.1016/j.jtct.2022.01.019. Epub 2022 Jan 31.

Antibody Response to SARS-CoV-2 Vaccination in Patients following Allogeneic Hematopoietic Cell Transplantation

Affiliations

Antibody Response to SARS-CoV-2 Vaccination in Patients following Allogeneic Hematopoietic Cell Transplantation

Alice Huang et al. Transplant Cell Ther. 2022 Apr.

Abstract

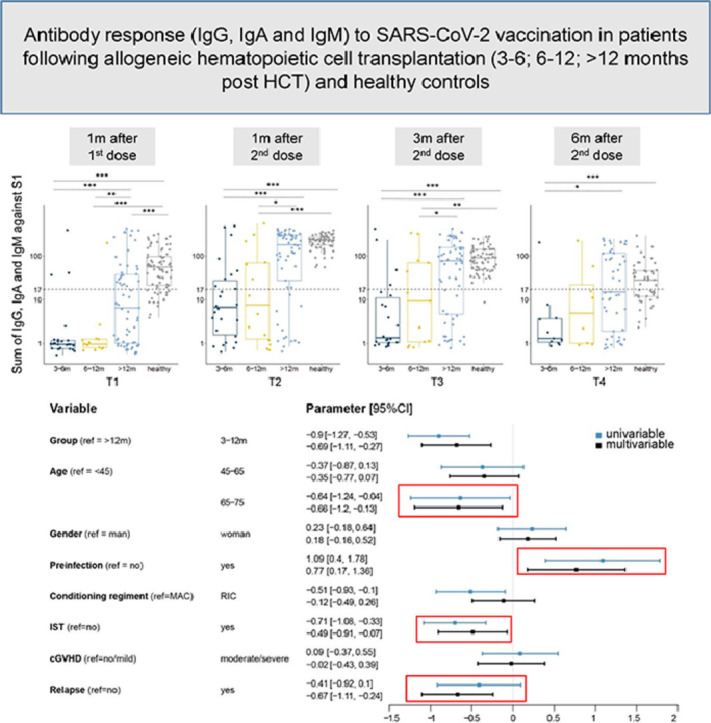
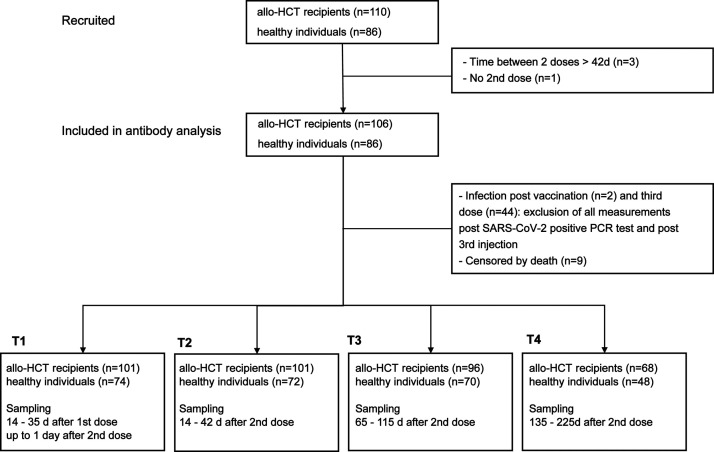
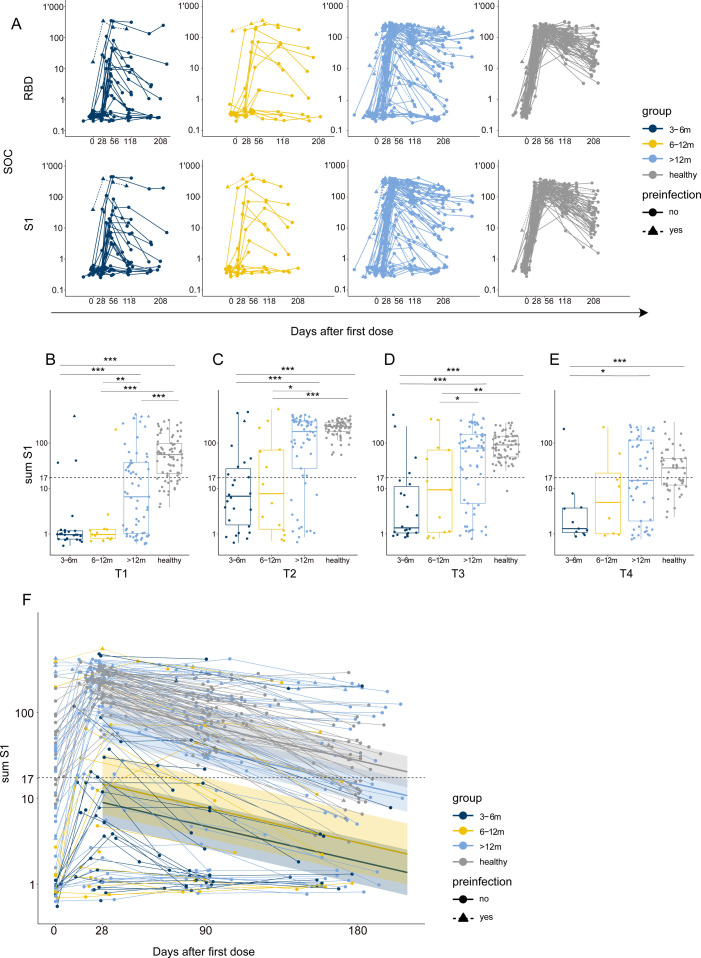
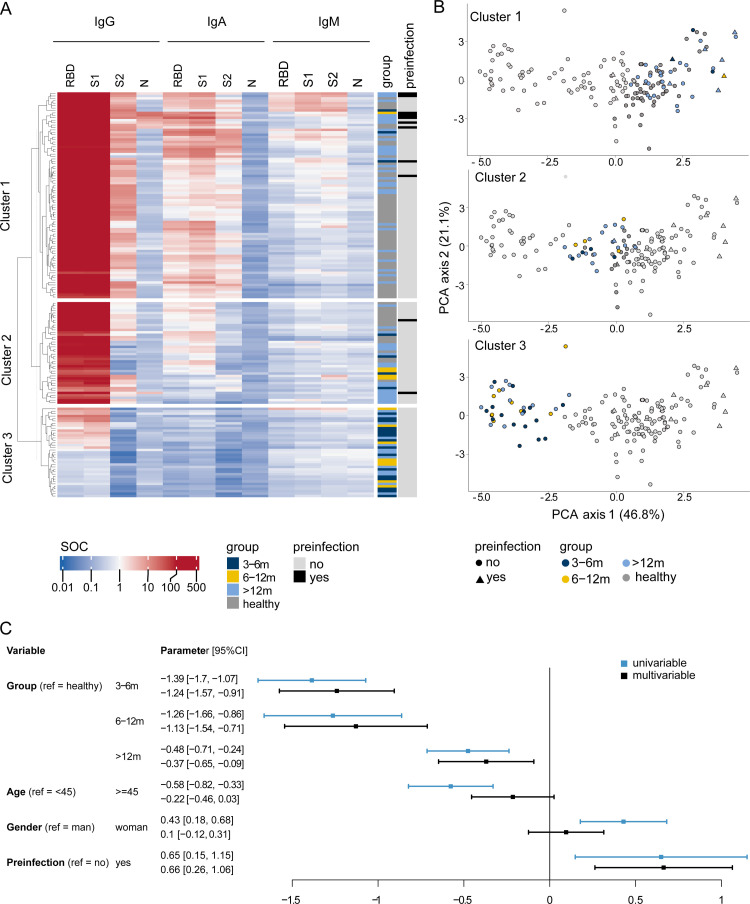
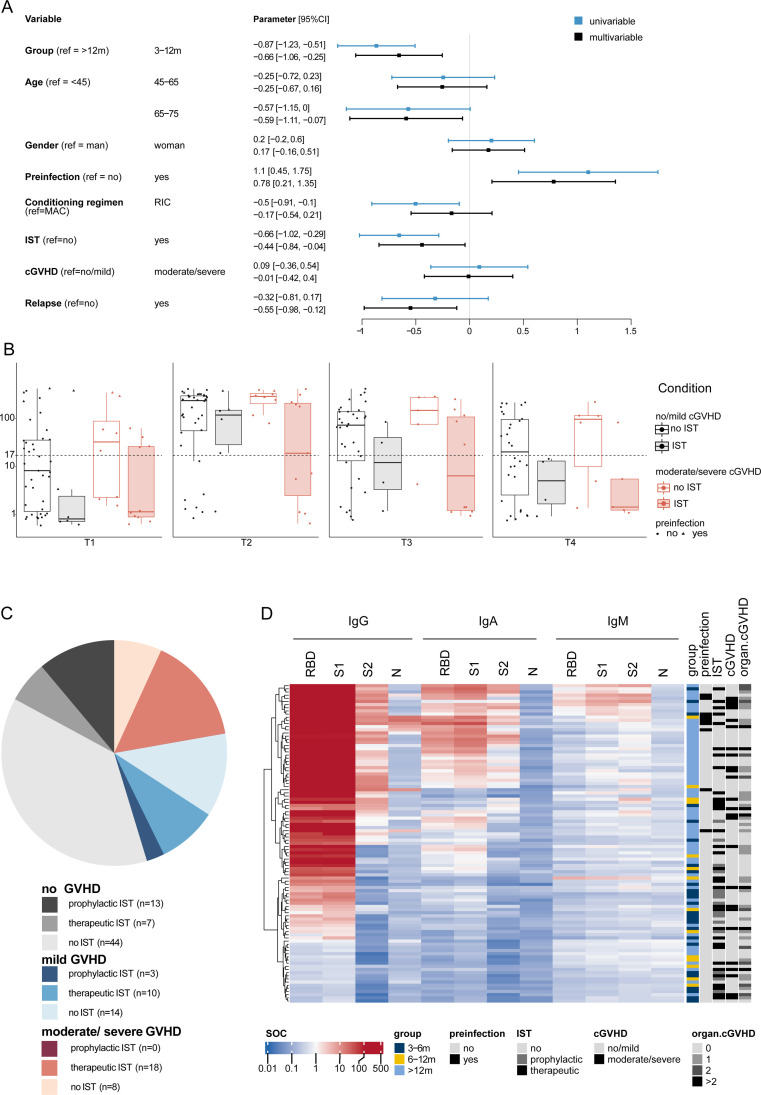
Vaccines against SARS-CoV-2 have been rapidly approved. Although pivotal studies were conducted in healthy volunteers, little information is available on the safety and efficacy of mRNA vaccines in immunocompromised patients, including recipients of allogeneic hematopoietic cell transplantation (allo-HCT). Here we used a novel assay to analyze patient- and transplantation-related factors and their influence on immune responses to SARS-CoV-2 vaccination over an extended period (up to 6 months) in a large and homogenous group of allo-HCT recipients at a single center in Switzerland. We examined longitudinal antibody responses to SARS-CoV-2 vaccination with BNT162b2 (BioNTech/Pfizer) and mRNA-1273 (Moderna) in 110 allo-HCT recipients and 86 healthy controls. Seroprofiling recording IgG, IgA, and IgM reactivity against SARS-CoV-2 antigens (receptor-binding domain, spike glycoprotein subunits S1 and S2, and nucleocapsid protein) was performed before vaccination, before the second dose, and at 1, 3, and 6 months after the second dose. Patients were stratified to 3 groups: 3 to 6 months post-allo-HCT, 6 to 12 months post-allo-HCT, and >12 months post-allo-HCT. Patients in the 3 to 6 months and 6 to 12 months post-allo-HCT groups developed significantly lower antibody titers after vaccination compared with patients in the >12 months post-allo-HCT group and healthy controls (P < .001). Within the cohort of allo-HCT recipients, patients age >65 years (P = .030), those receiving immunosuppression for prevention or treatment of graft-versus-host disease (GVHD) (P = .033), and patients with relapsed disease (P = .014) displayed low humoral immune responses to the vaccine. In contrast, the intensity of the conditioning regimen, underlying disease (myeloid/lymphoid/other), and presence of chronic GVHD had no impact on antibody levels. Antibody titers achieved the highest levels at 1 month after the second dose of the vaccine but waned substantially in all transplantation groups and healthy controls over time. This analysis of long-term vaccine antibody response is of critical importance to allo-HCT recipients and transplant physicians to guide treatment decisions regarding revaccination and social behavior during the SARS-CoV-2 pandemic.

Keywords: Allogeneic hematopoietic cell transplantation; SARS-CoV-2; Vaccination.


Figures

Image, graphical abstract
Graphical abstract
Figure 1
Figure 1
Flow chart of the study. A total of 110 allo-HCT recipients and 86 healthy controls were enrolled. Results are available for 101 patients and 74 healthy controls at T1 (14 to 35 days post-first dose), for 101 patients and 72 controls at T2 (14 to 42 days post-second dose), for 96 patients and 70 controls at T3 (65 to 115 days post-second dose), and for 68 patients and 48 controls at T4 (135 to 225 days post-second dose).
Figure 2
Figure 2
Differences in antibody responses between the allo-HCT recipients and healthy controls. (A) Dynamics of binding IgG response against the SARS-CoV-2 antigens RBD and S1, represented as SOC values, in allo-HCT recipients stratified by time between transplantation and vaccination (dark blue, 3 to 6 months; yellow, 6 to 12 months; light blue, >12 months) and healthy controls (gray). Preinfected individuals are represented by triangles and dashed lines. (B-E) Boxplots showing sum S1 reactivity in allo-HCT recipients stratified by time between transplantation and vaccination (dark blue, 3 to 6 months; yellow, 6 to 12 months; light blue, >12 months) and healthy controls (gray) at different time points: (B) T1, 1 month post-first dose; (C) T2, 1 month post-second dose; (D) T3, 3 months post-second dose; and (E) T4, 6 months post-second dose. The dashed line corresponds to a sum S1 of 17. Preinfected individuals are represented by triangles. Results from the Wilcoxon test used to compare each group to the other groups are shown. *P < .05; **P < .01; ***P < .001. (F) Longitudinal sum S1 response since the second dose and decline prediction obtained from a single exponential decline model. Each line corresponds to 1 patient, color-coded by group (dark blue, 3 to 6 months; yellow, 6 to 12 months; light blue, >12 months; gray, healthy controls). Preinfected individuals are represented by triangles and dashed lines. The solid line corresponds to the estimated marginal mean of the non-preinfected vaccinated individuals in each group, and the shaded area corresponds to the 95% CI of the prediction.
Figure 3
Figure 3
Humoral immunity to the SARS-CoV-2 vaccine improves over time after allo-HCT. (A) Heatmap of SARS-CoV-2 seroprofiles (IgG, IgA, and IgM SOC values against 4 SARS-CoV-2 antigens: RBD, S1, S2, and N) at T2 in allo-HCT recipients (dark blue, 3 to 6 months; yellow, 6 to 12 months; light blue, >12 months) and healthy controls (gray), and their preinfection status (black, yes; light gray, no). Patients are grouped in rows in 3 different clusters, and antibody responses are displayed in columns. (B) Principal component analysis (PCA) of SARS-CoV-2 seroprofiles (IgG, IgA, and IgM SOC values against 4 SARS-CoV-2 antigens: RBD, S1, S2, and N) at T2 of allo-HCT recipients (dark blue, 3 to 6 months; yellow, 6 to 12 months; light blue, >12 months) and healthy controls (gray), and their preinfection status (black, yes; light gray, no). Each subfigure highlights one of the clusters previously defined in the heatmap—cluster 1 (top), cluster 2 (middle) and cluster 3 (bottom)—and patients not belonging to the cluster of interest are shown in light gray. (C) Results from univariable (light blue) and multivariable (black) linear regression predicting log10 of the sum S1 value at T2 in allo-HCT recipients and healthy controls.
Figure 4
Figure 4
Risk factors associated with impaired immune response to the SARS-CoV-2 vaccine. (A) Results from univariable (light blue) and multivariable (dark blue) linear regression predicting log10 of the sum S1 value at T2 in allo-HCT recipients. (B) Boxplots showing sum S1 reactivity in allo-HCT recipients from the >12 months group at T1, T2, T3, and T4 stratified by immunosuppressive treatment (no, clear; yes, shaded) and chronic GVHD (none/mild, black; moderate/severe, red). (C) Repartitioning of patients receiving prophylactic, therapeutic, or no immunosuppressive treatment with no (gray shaded), mild (blue shaded), or moderate/severe (red shaded) chronic GVHD. (D) Heatmap of SARS-CoV-2 seroprofiles (IgG, IgA, and IgM SOC values against 4 SARS-CoV-2 antigens: RBD, S1, S2, and N) at T2 in allo-HCT recipients (dark blue, 3 to 6 months; yellow, 6 to 12 months; light blue, >12 months). Also shown is their preinfection status (light gray, no; black, yes), IST (light gray, no; dark gray, prophylactic; black, therapeutic), chronic GVHD (black, none/mild; light gray, moderate/severe), and the number of organs affected by chronic GVHD (shades of light gray to black: 0, 1, 2, and >2). Patients are grouped in rows, and antibody responses are displayed in columns.
Figure 5
Figure 5
Characteristics of low vaccine responders. (A) Mosaic plot displaying the proportion of responders (NT 50>250, light gray) and low responders (NT 50<250, dark gray) at T2 in the 3 to 12 months and >12 months post-allo-HCT groups (x-axis), with or without IST (y-axis). (B) Mosaic plot displaying the proportion of responders (NT 50>250, light gray) and low responders (NT 50<250, dark gray) at T2 in the subgroups of patients age <45 years, 45 to 65 years, and >65 years (x-axis) with or without IST (y-axis). (C) Mosaic plot displaying the proportion of responders (NT 50>250, light green) and low responders (NT 50<250, dark green) (y-axis) after the third vaccine dose in the 3 to 12 months and >12 months post-allo-HCT groups (x-axis).
Figure 6
Figure 6
Immune reconstitution patterns correlate with vaccine antibody response. (A) Boxplots showing the level of immune reconstitution in allo-HCT recipients stratified by the time between transplantation and vaccination (dark blue, 3 to 6 months; yellow, 6 to 12 months; light blue, >12 months). The gray shaded areas correspond to normal ranges for each cell subpopulation. (B) Correlation of immune reconstitution and sum S1 values at T2 in allo-HCT recipients stratified by the time between transplantation and vaccination (dark blue, 3 to 6 months; yellow, 6 to 12 months; light blue, >12 months).

References

    1. World Health Organization. WHO coronavirus (COVID-19) dashboard. Available at: https://covid19.who.int/. Accessed November 8th 2021.
    1. Swissmedic. Swissmedic grants authorisation for the COVID-19 vaccine from Moderna. Available at: https://www.swissmedic.ch/swissmedic/en/home/humanarzneimittel/authorisa.... Accessed August 1st 2021.
    1. Sharma A, Bhatt NS, St Martin A, et al. Clinical characteristics and outcomes of COVID-19 in haematopoietic stem-cell transplantation recipients: an observational cohort study. Lancet Haematol. 2021;8:e185–e193. - PMC - PubMed
    1. Passamonti F, Cattaneo C, Arcaini L, et al. Clinical characteristics and risk factors associated with COVID-19 severity in patients with haematological malignancies in Italy: a retrospective, multicentre, cohort study. Lancet Haematol. 2020;7:e737–e745. - PMC - PubMed
    1. Polack FP, Thomas SJ, Kitchin N, et al. Safety and efficacy of the BNT162b2 mRNA Covid-19 vaccine. N Engl J Med.2020;383:2603-2615. - PMC - PubMed

Publication types