. 2022 Apr 20;34(5):277-289.
doi: 10.1093/intimm/dxac002.

Cancer-derived cholesterol sulfate is a key mediator to prevent tumor infiltration by effector T cells

Affiliations

Cancer-derived cholesterol sulfate is a key mediator to prevent tumor infiltration by effector T cells

Takaaki Tatsuguchi et al. Int Immunol. .

Abstract

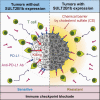
Effective tumor immunotherapy requires physical contact of T cells with cancer cells. However, tumors often constitute a specialized microenvironment that excludes T cells from the vicinity of cancer cells, and its underlying mechanisms are still poorly understood. DOCK2 is a Rac activator critical for migration and activation of lymphocytes. We herein show that cancer-derived cholesterol sulfate (CS), a lipid product of the sulfotransferase SULT2B1b, acts as a DOCK2 inhibitor and prevents tumor infiltration by effector T cells. Using clinical samples, we found that CS was abundantly produced in certain types of human cancers such as colon cancers. Functionally, CS-producing cancer cells exhibited resistance to cancer-specific T-cell transfer and immune checkpoint blockade. Although SULT2B1b is known to sulfate oxysterols and inactivate their tumor-promoting activity, the expression levels of cholesterol hydroxylases, which mediate oxysterol production, are low in SULT2B1b-expressing cancers. Therefore, SULT2B1b inhibition could be a therapeutic strategy to disrupt tumor immune evasion in oxysterol-non-producing cancers. Thus, our findings define a previously unknown mechanism for tumor immune evasion and provide a novel insight into the development of effective immunotherapies.

Keywords: DOCK2; SULT2B1b; immune evasion; tumor immunotherapy.


Figures

Graphical abstract
Graphical abstract
Fig. 1.
Fig. 1.
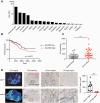
CS production and CD8+ T-cell infiltration are inversely correlated in colon cancer tissue samples. (A) Comparison of the SULT2B1 expression in 17 human cancer types. Data are from the Human Protein Atlas (https://www.proteinatlas.org) and are indicated as medians of the fragments per kilobase million (FPKM) values. (B) Kaplan–Meier curves showing survival of colon cancer patients with high (n = 404) or low (n = 193) SULT2B1 expression. The cut-off value was set at 5.68. P = 0.0077 (log-rank test). (C) Comparison of CS production between normal colon tissues and colon cancer tissues. Data are presented as the mean ± SD. **P < 0.01 (two-tailed Mann–Whitney test). (D) Representative images for CS production and CD8+ T-cell infiltration in colon cancer tissue samples. Scale bars indicate 1 mm (the second column) and 250 µm (the third and fourth columns). The graph shows the comparison of the number of infiltrating CD8+ T cells between the CS-high and CS-low regions (n = 10). Data are presented as the mean ± SD. **P < 0.01 (two-tailed unpaired Student’s t-test).
Fig. 2.
Fig. 2.
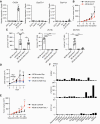
CS production in tumors inhibits infiltration of effector T cells. (A) CS production in cells (n = 6) and culture supernatant (n = 5) were compared between E0771-SULT and E0771-MOCK. Data are presented as the mean ± SD. **P < 0.01 (two-tailed unpaired Student’s t-test). (B) Trans-cancer migration assays showing that the presence of E0771-SULT (SULT+) and CS-treated E0771-MOCK (SULT–) in Matrigel reduces CCL21-induced T-cell migration (n = 5–7). Data are presented as the mean ± SD. *P < 0.05, **P < 0.01 (one-way ANOVA followed by Dunnett’s post hoc test). (C) In vitro growth was compared between E0771-MOCK and E0771-SULT (n = 5). (D and E) After transplantation, tumor growth in wild-type (WT) or Sult2b1–/– C57BL/6 mice was compared between E0771-MOCK and E0771-SULT (n = 8–9). Data are presented as the mean + SD. *P < 0.05, **P < 0.01 (two-tailed unpaired Student’s t-test). (F) viSNE plots highlighting the distribution of tumor-infiltrating lymphocytes in E0771-SULT and E0771-MOCK. (G) The percentages of CD8+ T cells and NK cells in infiltrating leukocytes and their expression of granzyme B were compared between E0771-SULT and E0771-MOCK (n = 9). Data are presented as the mean ± SD. *P < 0.05 (two-tailed unpaired Student’s t-test). (H and I) After transplantation, tumor growth in BALB/c nude mice (H; n = 7) or DOCK2–/– mice (I; n = 6) was compared between E0771-SULT and E0771-MOCK. (J) After transplantation, tumor growth in C57BL/6 mice was compared between Pan02-control and Pan02-ΔSULT (n = 10, 8). Data are presented as the mean + SD. **P < 0.01 (two-tailed Mann–Whitney test). (K) The percentages of CD8+ T cells in infiltrating leukocytes were compared between Pan02-control and Pan02-ΔSULT (n = 9). Data are presented as the mean ± SD. **P < 0.01 (two-tailed unpaired Student’s t-test).
Fig. 3.
Fig. 3.
CS production renders tumor cells resistant to immune checkpoint blockade. (A) viSNE plots highlighting the distribution of tumor-infiltrating myeloid cells in E0771-MOCK and E0771-SULT. (B) The percentage of PD-L1+ cells in infiltrating leukocytes or CD11b+ cells was compared between E0771-MOCK and E0771-SULT (n = 9). Data are presented as the mean ± SD. (C) Schematic illustration of the protocol used for anti-PD-L1 treatment. (D and E) After transplantation, tumor growth of E0771-MOCK-PD-L1 (D, n = 5) or E0771-SULT-PD-L1 (E, n = 6) was compared between mice treated with anti-PD-L1 antibody and those treated with isotype-matched control. Data are presented as the mean + SD. *P < 0.05, **P < 0.01 (two-tailed Mann–Whitney test).
Fig. 4.
Fig. 4.
SULT2B1b-mediated CS production in tumors dampens anti-tumor T-cell responses. (A) The effect of OTI CD8+ T-cell transfer on tumor growth in C57BL/6 mice was compared between E.G7-OVA-MOCK (n = 5) and E.G7-OVA-SULT (n = 6). After the intravenous injection of activated Vα2+Vβ5+ OTI T cells on day 10, the infiltration of OTI T cells was analyzed on day 15 (n = 7). Data are presented as the mean + SD or ± SD. *P < 0.05, **P < 0.01 (two-tailed Mann–Whitney test for both tumor growth and infiltration of OTI T cells). (B) The effect of OTI CD8+ T-cell transfer on tumor growth in C57BL/6 mice was compared between E0771-OVA-control (n = 8) and E0771-OVA-SULT (n = 8). After the intravenous injection of activated Vα2+Vβ5+ OTI T cells on day 10, the infiltration of OTI T cells was analyzed on day 15 (n = 7 or 8). Data are presented as the mean + SD or ± SD. *P < 0.05, **P < 0.01 (two-tailed Mann–Whitney test for tumor growth and two-tailed unpaired Student’s t-test for infiltration of OTI T cells). (C) Schematic representation of the interaction between OTII CD4+ T cells and tumor cells expressing I-Ab molecule covalently bound to OVA peptide. (D and E) The effect of OTII CD4+ T-cell transfer on tumor growth in C57BL/6 mice was compared between (D) E0771-control-I-Ab/OVA (n = 8) and E0771-SULT-I-Ab/OVA (n = 7) or (E) 3LL-control-I-Ab/OVA (n = 8) and 3LL-SULT-I-Ab/OVA (n = 8). After the intravenous injection of activated Vα2+Vβ5+ OTII T cells on day 9, infiltration of OTII T cells was analyzed on day 14 (D, n = 9; E, n = 7). Data are presented as the mean + SD or ± SD. *P < 0.05, **P < 0.01 (two-tailed unpaired Student’s t-test for tumor growth and two-tailed Mann–Whitney test for infiltration of OTII T cells). (F) Comparison of the effect of DOCK2+/+ OTII CD4+ T cells and DOCK2–/– OTII CD4+ T cells (n = 7) on the growth of E0771-control-I-Ab/OVA transplanted into C57BL/6 mice. Data are presented as the mean + SD. *P < 0.05 (two-tailed unpaired Student’s t-test).
Fig. 5.
Fig. 5.
The expression of SULT2B1b suppresses in vivo growth of MC38 cells that produce 25-HC. (A) The expression of Ch25h, Cyp27a1 and Cyp11a1 in tumor cell lines. Reverse transcription-quantitative PCR showing high expression of Ch25h in MC38. Data (n = 5–7) are presented as the mean ± SD after normalization with the Gapdh expression. **P < 0.01 (one-way ANOVA followed by Dunnett’s post hoc test). (B) After transplantation, tumor growth in C57BL/6 mice was compared between MC38-SULT and MC38-control (n = 10). Data are presented as the mean + SD. **P < 0.01 (two-tailed Mann–Whitney test). (C) Production of CS, 25-HC and 25-HCS in MC38-control, MC38-SULT, MC38-ΔCH25 and MC38-ΔCH25-SULT (n = 5 per each) was quantified by mass spectrometry. Data are presented as the mean ± SD. **P < 0.01 (one-way ANOVA followed by Dunnett’s post hoc test). (D) In vitro growth of MC38 was analyzed in the presence of the culture supernatant from wild-type MC38, MC38-SULT or MC38-ΔCH25 (n = 6 per each). Data are presented as the mean ± SD. **P < 0.01 (one-way ANOVA followed by Dunnett’s post hoc test). (E) After transplantation, tumor growth in C57BL/6 mice was compared between MC38-ΔCH25 (n = 8) and MC38-ΔCH25-SULT (n = 9). Data are presented as the mean + SD. **P < 0.01 (two-tailed unpaired Student’s t-test). (F) The expression of genes encoding oxysterol hydroxylases in 17 human cancer types. Data are from the Human Protein Atlas (https://www.proteinatlas.org) and are indicated as medians of the fragments per kilobase per million (FPKM) values.

References

    1. Ribas, A. and Wolchok, J. D. 2018. Cancer immunotherapy using checkpoint blockade. Science 359:1350. - PMC - PubMed
    1. Pitt, J. M., Vétizou, M., Daillèle, R.et al. 2016. Resistance mechanisms to immune-checkpoint blockade in cancer: tumor-intrinsic and -extrinsic factors. Immunity 44:1255. - PubMed
    1. Sharma, P., Hu-Lieskovan, S., Wargo, J. A.et al. 2017. Primary, adaptive, and acquired resistance to cancer immunotherapy. Cell 168:707. - PMC - PubMed
    1. Spranger, S. and Gajewski, T. F. 2018. Impact of oncogenic pathways on evasion of antitumour immune responses. Nat. Rev. Cancer 18:139. - PMC - PubMed
    1. Kearney, C. J., Vervoort, S. J., Hogg, S. J.et al. 2018. Tumor immune evasion arises through loss of TNF sensitivity. Sci. Immunol. 3:eaar3451. - PubMed

Publication types