. 2022 Dec;11(1):593-605.
doi: 10.1080/22221751.2022.2036582.

Metabolomic analysis reveals potential biomarkers and the underlying pathogenesis involved in Mycoplasma pneumoniae pneumonia

Affiliations

Metabolomic analysis reveals potential biomarkers and the underlying pathogenesis involved in Mycoplasma pneumoniae pneumonia

Jieqiong Li et al. Emerg Microbes Infect. 2022 Dec.

Abstract

Although previous studies have reported the use of metabolomics for infectious diseases, little is known about the potential function of plasma metabolites in children infected with Mycoplasma pneumoniae (MP). Here, a combination of liquid chromatography-quadrupole time-of-flight mass spectrometry and random forest-based classification model was used to provide a broader range of applications in MP diagnosis. In the training cohort, plasma from 63 MP pneumonia children (MPPs), 37 healthy controls (HC) and 29 infectious disease controls (IDC) was collected. After multivariate analyses, 357 metabolites were identified to be differentially expressed among MPP, HC and IDC groups, and 3 metabolites (568.5661, 459.3493 and 411.3208) had high diagnostic values. In an independent cohort with 57 blinded subjects, samples were successfully classified into different groups, demonstrating the reliability of these biomarkers for distinguishing MPPs from controls. A metabolomic signature analysis identified major classes of glycerophospholipids, sphingolipids and fatty acyls were increased in MPPs. These markedly altered metabolites are mainly involved in glycerophospholipid and sphingolipid metabolism. As the ubiquitous building blocks of eukaryotic cell membranes, dysregulated lipid metabolism indicates damage of the cellular membrane and the activation of immunity in MPPs. Moreover, lipid metabolites, differentially expressed between severe and mild MPPs, were correlated with the markers of extrapulmonary complications, suggesting that they may be involved in MPP disease severity. These findings may offer new insights into biomarker selection and the pathogenesis of MPP in children.

Keywords: Mycoplasma pneumoniae pneumonia; metabolomics; children; diagnosis; pathogenesis.


Conflict of interest statement

No potential conflict of interest was reported by the author(s).

Figures

Figure 1.
Figure 1.
Study design and patients: (A) samples in a training cohort for metabolomic analysis; (B) verification of biomarkers in an independent testing cohort; (C) data from training and testing cohorts for metabolomics signature analysis.
Figure 2.
Figure 2.
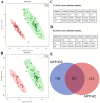
Identification of differentially expressed metabolites in MPPs: (A) PLS-DA score plots for the MPPs and HCs; (B) PLS-DA score plots for the MPPs and IDCs; (C) parameters for assessing the quality of the PLS-DA model for the MPPs and HCs; (D) parameters for assessing the quality of the PLS-DA model for the MPPs and IDCs; (E) differentially expressed metabolites identified in MPP children compared with IDC and HC.
Figure 3.
Figure 3.
Identification and verification of potential biomarker combinations for the classification of MPP Patients: (A) the workflow for biomarker selection; (B) verification of biomarkers in an independent cohort with 57 blinded subjects; (C) AUC values of three biomarkers were calculated for the classification of MPPs and HCs; (D) AUC values of three biomarkers were calculated for the classification of MPPs and IDCs; (E) the confusion matrix and PCA analysis of 411.3208 among different plasma samples from cohort 2; (F) the confusion matrix and PCA analysis of 459.3493 among different plasma samples from cohort 2; (G) the confusion matrix and PCA analysis of 568.5661 among different plasma samples from cohort 2.
Figure 4.
Figure 4.
Analysis of the metabolomic signatures from patients with MPP. (A) The serum metabolic phenotypes of MPP-positive patients substantially differed from controls using PLS-DA. (B) The volcano plot derived from a targeted metabolomic analysis illustrates the top serum metabolites that were increased (shown in red) or decreased (shown in blue) in MPP-positive patients as compared with HCs. (C) The volcano plot derived from a targeted metabolomic analysis highlights the top serum metabolites that were increased (shown in blue) or decreased (shown in red) in MPP-positive patients as compared with IDCs. (D) Venn diagram displays the number of differentially expressed metabolites in MPPs compared to HCs and IDCs (|FC| >1.5, P < 0.05, VIP > 1). (E) Hierarchical clustering analysis revealed a significant impact of MPP on levels of triadylcglycerols, sphingolipids, glycerolipids, glycerophospholipids, fatty acyls, bile acids/alcohols/ derivatives and amino acids/peptides/ analogues. A vectorial version of this figure is provided in Table S3.
Figure 5.
Figure 5.
Pathway analysis of differentially expressed metabolites. (A) Impact factors of pathways calculated using the KEGG Pathway Database. (B) Significant changes were seen in the levels of some intermediates of the glycerophospholipid metabolism pathways in plasma of MPP samples. (C) Significant changes were seen in the levels of some intermediates of the sphingolipid metabolism pathways in plasma of MPP samples.
Figure 6.
Figure 6.
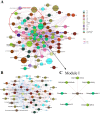
Multiscale embedded correlation network analysis illustrates the differential correlation of metabolites in MPPs relative to controls. (A) Only lipid and amino acids pairs with significant differential correlations (empirical P < 0.05) were included. Negative correlations are shown in purple and positive correlations are shown in pink. For important pathologically related metabolites, two modules of biological interest were circled and expanded for better visual clarity. (B) Glycerophospholipids and glycerolipids pairs with significant differential correlations (empirical P < 0.05) were included. These two classes of lipids created a complex network, which may play an essential role in MP infection. (C) Module I comprises of Cer (d18:0/18:0), as the hub, connected to DG (18:4/24:1/0:0), DG (22:2/22:6/0:0), DG (22:1/22:6/0:0) and DG (18:2n6/0:0/22:5n6).
Figure 7.
Figure 7.
Dysregulated lipid metabolism is associated with disease severity in MPPs. (A) The volcano plot derived from a targeted metabolomic analysis illustrates the top serum metabolites that were increased (shown in red) or decreased (shown in blue) in severe MPP patients as compared with mild MPPs. (B) KEGG pathways that were significantly impacted in severe MPP disease. (C) Correlation analysis of differentially expressed metabolites and clinical indices between severe and mild MPPs. Red and blue represent positive and negative correlations, respectively. * means correlation P-value <0.05. ** means correlation P-value < 0.01.

References

    1. Waites KB, et al. . Mycoplasma pneumoniae from the respiratory tract and beyond. Clin Microbiol Rev. 2017;30(3):747–809. - PMC - PubMed
    1. Jain S, et al. . Community-acquired pneumonia requiring hospitalization among U.S. children. N Engl J Med. 2015;372(9):835–845. - PMC - PubMed
    1. Izumikawa K. Clinical features of severe or fatal Mycoplasma pneumoniae pneumonia. Front Microbiol. 2016;7:800. - PMC - PubMed
    1. Bajantri B, Venkatram S, Diaz-Fuentes G.. Mycoplasma pneumoniae: a potentially severe infection. J Clin Med Res. 2018;10(7):535–544. - PMC - PubMed
    1. Lee KL, et al. . Severe Mycoplasma pneumoniae pneumonia requiring intensive care in children, 2010–2019. J Formos Med Assoc. 2021;120(1 Pt 1):281–291. - PubMed