

Investigating vaccine-induced immunity and its effect in mitigating SARS-CoV-2 epidemics in China
- PMID: 35094714
- PMCID: PMC8801316
- DOI: 10.1186/s12916-022-02243-1
Investigating vaccine-induced immunity and its effect in mitigating SARS-CoV-2 epidemics in China
Abstract
Background: To allow a return to a pre-COVID-19 lifestyle, virtually every country has initiated a vaccination program to mitigate severe disease burden and control transmission. However, it remains to be seen whether herd immunity will be within reach of these programs.
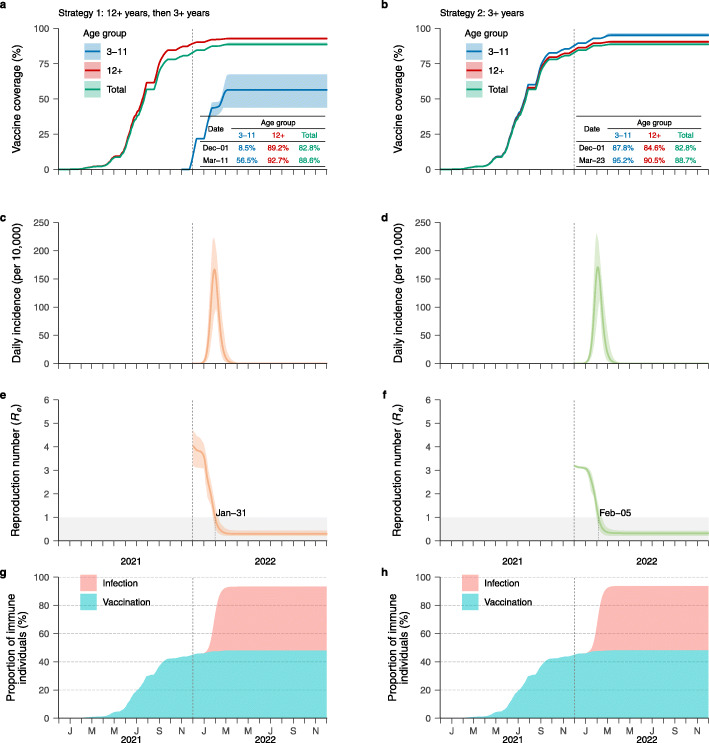
Methods: We developed a compartmental model of SARS-CoV-2 transmission for China, a population with low prior immunity from natural infection. Two vaccination programs were tested and model-based estimates of the immunity level in the population were provided.
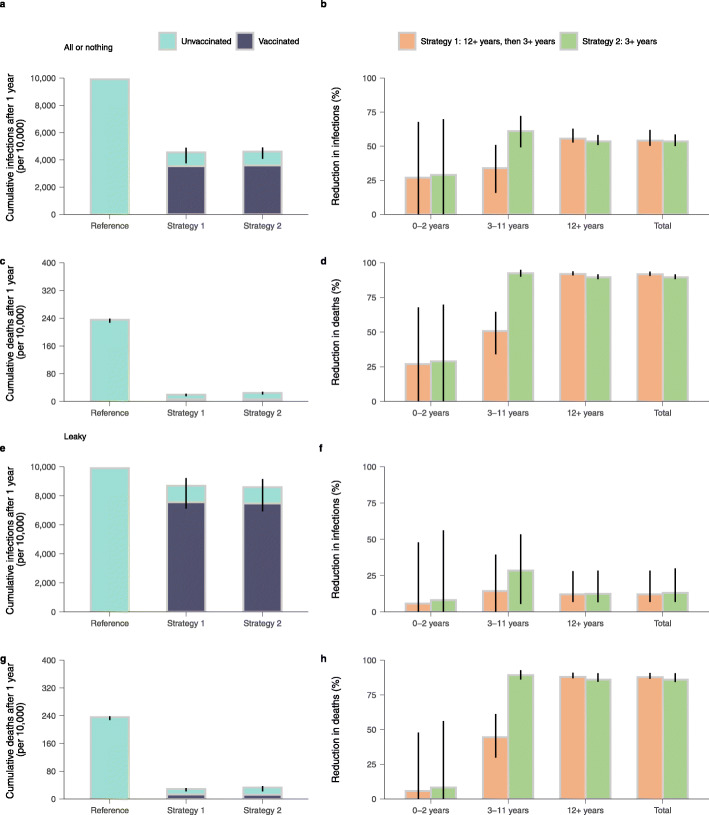
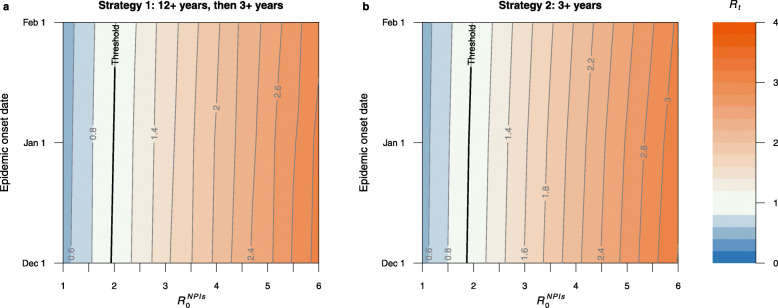
Results: We found that it is unlikely to reach herd immunity for the Delta variant given the relatively low efficacy of the vaccines used in China throughout 2021 and the lack of prior natural immunity. We estimated that, assuming a vaccine efficacy of 90% against the infection, vaccine-induced herd immunity would require a coverage of 93% or higher of the Chinese population. However, even when vaccine-induced herd immunity is not reached, we estimated that vaccination programs can reduce SARS-CoV-2 infections by 50-62% in case of an all-or-nothing vaccine model and an epidemic starts to unfold on December 1, 2021.
Conclusions: Efforts should be taken to increase population's confidence and willingness to be vaccinated and to develop highly efficacious vaccines for a wide age range.
Keywords: COVID-19; Delta variant; Herd immunity; SLIR model; Vaccination program.
© 2022. The Author(s).
Conflict of interest statement
H.Y. has received research funding from Sanofi Pasteur, GlaxoSmithKline, Yichang HEC Changjiang Pharmaceutical Company, and Shanghai Roche Pharmaceutical Company. M.A. has received research funding from Seqirus. None of those research funding is related to COVID-19. All other authors report no competing interests.
Figures


Update of
-
Herd immunity induced by COVID-19 vaccination programs and suppression of epidemics caused by the SARS-CoV-2 Delta variant in China.medRxiv [Preprint]. 2021 Sep 14:2021.07.23.21261013. doi: 10.1101/2021.07.23.21261013. medRxiv. 2021. Update in: BMC Med. 2022 Jan 31;20(1):37. doi: 10.1186/s12916-022-02243-1. PMID: 34341803 Free PMC article. Updated. Preprint.
References
-
- Li Q, Guan X, Wu P, Wang X, Zhou L, Tong Y, Ren R, Leung KSM, Lau EHY, Wong JY, Xing X, Xiang N, Wu Y, Li C, Chen Q, Li D, Liu T, Zhao J, Liu M, Tu W, Chen C, Jin L, Yang R, Wang Q, Zhou S, Wang R, Liu H, Luo Y, Liu Y, Shao G, Li H, Tao Z, Yang Y, Deng Z, Liu B, Ma Z, Zhang Y, Shi G, Lam TTY, Wu JT, Gao GF, Cowling BJ, Yang B, Leung GM, Feng Z. Early transmission dynamics in Wuhan, China, of novel coronavirus-infected pneumonia. N Engl J Med. 2020;382(13):1199–1207. doi: 10.1056/NEJMoa2001316. - DOI - PMC - PubMed
-
- Chinazzi M, Davis JT, Ajelli M, Gioannini C, Litvinova M, Merler S, Pastore y Piontti A, Mu K, Rossi L, Sun K, Viboud C, Xiong X, Yu H, Halloran ME, Longini IM, Jr, Vespignani A. The effect of travel restrictions on the spread of the 2019 novel coronavirus (COVID-19) outbreak. Science. 2020;368(6489):395–400. doi: 10.1126/science.aba9757. - DOI - PMC - PubMed
-
- World Health Organization . WHO coronavirus (COVID-19) dashboard. 2021.
Publication types
MeSH terms
Substances
Supplementary concepts
Grants and funding
LinkOut - more resources
Full Text Sources
Medical
Miscellaneous
