. 2022 Jan 12:14:775479.
doi: 10.3389/fnmol.2021.775479. eCollection 2021.

The Role of Microtubule Associated Serine/Threonine Kinase 3 Variants in Neurodevelopmental Diseases: Genotype-Phenotype Association

Affiliations

The Role of Microtubule Associated Serine/Threonine Kinase 3 Variants in Neurodevelopmental Diseases: Genotype-Phenotype Association

Li Shu et al. Front Mol Neurosci. .

Abstract

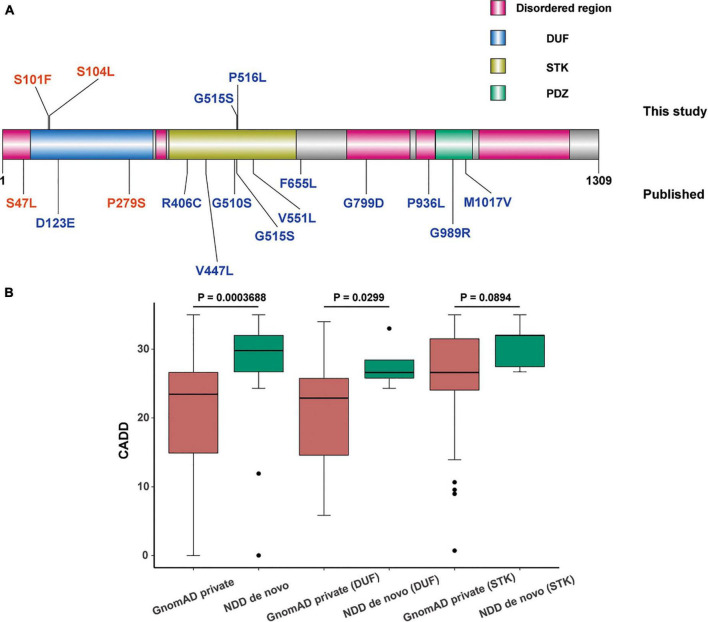
Objective: To prove microtubule associated serine/threonine kinase 3 (MAST3) gene is associated with neurodevelopmental diseases (NDD) and the genotype-phenotype correlation. Methods: Trio exome sequencing (trio ES) was performed on four NDD trios. Bioinformatic analysis was conducted based on large-scale genome sequencing data and human brain transcriptomic data. Further in vivo zebrafish studies were performed. Results: In our study, we identified four de novo MAST3 variants (NM_015016.1: c.302C > T:p.Ser101Phe; c.311C > T:p.Ser104Leu; c.1543G > A:p.Gly515Ser; and c.1547T > C:p.Leu516Pro) in four patients with developmental and epileptic encephalopathy (DEE) separately. Clinical heterogeneities were observed in patients carrying variants in domain of unknown function (DUF) and serine-threonine kinase (STK) domain separately. Using the published large-scale exome sequencing data, higher CADD scores of missense variants in DUF domain were found in NDD cohort compared with gnomAD database. In addition, we obtained an excess of missense variants in DUF domain when compared autistic spectrum disorder (ASD) cohort with gnomAD database, similarly an excess of missense variants in STK domain when compared DEE cohort with gnomAD database. Based on Brainspan datasets, we showed that MAST3 expression was significantly upregulated in ASD and DEE-related brain regions and was functionally linked with DEE genes. In zebrafish model, abnormal morphology of central nervous system was observed in mast3a/b crispants. Conclusion: Our results support the possibility that MAST3 is a novel gene associated with NDD which could expand the genetic spectrum for NDD. The genotype-phenotype correlation may contribute to future genetic counseling.

Keywords: MAST3; domain; epilepsy; genetics; neurodevelopmental.


Conflict of interest statement

JL was employed by the company Cipher Gene LLC. WG and PW were employed by the company Chigene (Beijing) Translational Medical Research Center Co., Ltd. The remaining authors declare that the research was conducted in the absence of any commercial or financial relationships that could be construed as a potential conflict of interest.

Figures

FIGURE 1
FIGURE 1
(A) Sanger sequencing results of c.302C > T in patient 1 trio. (B) Sanger sequencing results of c.311C > T in patient 2 trio. (C) Sanger sequencing results of c.1547T > C in patient 3 trio. (D) Sanger sequencing results of c.1543G > A in patient 4 trio. The arrows pointed to the location of the variants.
FIGURE 2
FIGURE 2
Distribution and comparison of pathogenicity of missense mutations in domain of unknown function (DUF) and serine-threonine kinas (STK) domain of microtubule associated serine/threonine kinase 3 (MAST3). (A) Schematic representation of missense variations in MAST3. Variations above and under the protein domain graph are originated from this study and published research, respectively. The colors in the MAST3 protein represented different protein domains (pink: disordered region, blue: DUF domain, yellow: STK domain, and green: PDZ domain). The different colors of the variants showed different diseases (red, ASD; blue, DD). (B) Box plot of CADD of de novo (neurodevelopmental diseases, NDD)/private (GnomAD) missense mutations in DUF or STK domain. Higher CADD scores of missense variants in total and in DUF region of MAST3 were found in NDD cohort compared with that in gnomAD database (p = 0.0003688, 0.0229, Wilcoxon test). Significance was lost when the same analysis was performed for STK domain variants (p = 0.0894, Wilcoxon test).
FIGURE 3
FIGURE 3
Dynamic expression mode of MAST3 in human development brains. (A,B) Expression of MAST3 during brain development periods in different brain regions. The x-axis is the age of samples in days and y-axis is the log2-transformed RPKM of MAST3. A1C, primary auditory cortex; AMY, amygdaloid complex; CBC, cerebellar cortex; DFC, dorsolateral prefrontal cortex; HIP, hippocampus; IPC, inferior parietal cortex; ITC, inferolateral temporal cortex; M1C, primary motor cortex; MD, mediodorsal nucleus of thalamus; MFC, medial prefrontal cortex; OFC, orbital frontal cortex; S1C, primary somatosensory cortex; STC, superior temporal cortex; STR, striatum; V1C, primary visual cortex; VFC, ventrolateral prefrontal cortex. The dashed line indicates the birthday. (C,D) Expression of MAST3 in the TC region. (E,F) Expression of MAST3 in the DFC region. Univariate regression analysis was applied in prenatal brains (left) and post-natal brains (right), separately. Blue line represents the regression line and the gray region indicates 95% CI. The text shows the R2 and P-value of regression.
FIGURE 4
FIGURE 4
Co-expression analyses of microtubule associated serine/threonine kinase 3 (MAST3) with EE and NDD genes. (A,B) The percentile of average correlation coefficient for all developing cortex expressed genes with NDD (A) or EE (B) genes. The average percentile of MAST3 was marked. (C) Interaction network contains nine highly co-expressed EE/NDD genes (Spearman’s correlation coefficient > 0.7) with MAST3.
FIGURE 5
FIGURE 5
Disruption of zebrafish mast3a and mast3b led to abnormal central nervous system (CNS) morphology. (A) Representative bright-field imaging of larval zebrafish at six dpf (dorsal view). Top, cas9 injected control; bottom, mast3a F0 CRISPR (crispant). (B) Measurements of body length in cas9 injected control (n = 20 fish) vs. mast3a crispant (n = 29 fish). Data were normalized to the average body length of cas9 control group. (C) Normalized CNS area in cas9 injected controls vs. mast3a crispants. Data were corrected by the normalized body length of individual larvae. (D) Representative imaging of HuC: eGFP expressed larval zebrafish shows CNS fluorescence pattern at six dpf (dorsal view). Left, cas9 injected control; right, mast3a crispant. White dash line highlights the CNS subregions, forebrain, midbrain, and hindbrain, for measurement. (E) Normalized CNS subregion area in cas9 injected control vs. mast3a crispant. Data were normalized to the average of each subregion area of cas9 control group, and then corrected by the normalized body length of individual larvae (gray dot, cas9 control; blue dot, mast3a crispant). (F) CRISPR efficacy calculated via TIDE method of individual mast3a crispant used in phenotypic study (n = 38 fish). (G–L) Data from mast3b crispant study (for imaging study, n = 20 fish for cas9 control, and n = 24 fish for mast3b crispant; n = 31 crispant for TIDE efficacy verification). Scale bars as indicated in the figure. Error bars indicate SD. Statistical significance is indicated as **p < 0.01, and ***p < 0.001.

References

    1. Avdesh A., Chen M., Martin-Iverson M. T., Mondal A., Ong D., Rainey-Smith S., et al. (2012). Regular care and maintenance of a zebrafish (Danio rerio) laboratory: an introduction. J. Vis. Exp. 18:e4196. 10.3791/4196 - DOI - PMC - PubMed
    1. Ben-Mahmoud A., Al-Shamsi A. M., Ali B. R., Al-Gazali L. (2020). Evaluating the role of MAST1 as an intellectual disability disease gene: identification of a novel De Novo variant in a patient with developmental disabilities. J. Mol. Neurosci. 70 320–327. 10.1007/s12031-019-01415-8 - DOI - PubMed
    1. Boumil R. M., Letts V. A., Roberts M. C., Lenz C., Mahaffey C. L., Zhang Z. W., et al. (2010). A missense mutation in a highly conserved alternate exon of dynamin-1 causes epilepsy in fitful mice. PLoS Genet. 6:e1001046. 10.1371/journal.pgen.1001046 - DOI - PMC - PubMed
    1. Brant B., Stern T., Shekhidem H. A., Mizrahi L., Rosh I., Stern Y., et al. (2021). IQSEC2 mutation associated with epilepsy, intellectual disability, and autism results in hyperexcitability of patient-derived neurons and deficient synaptic transmission. Mol. Psychiatry 12:43. 10.1038/s41380-021-01281-0 - DOI - PMC - PubMed
    1. Brinkman E. K., Chen T., Amendola M., van Steensel B. (2014). Easy quantitative assessment of genome editing by sequence trace decomposition. Nucleic Acids Res. 42:e168. 10.1093/nar/gku936 - DOI - PMC - PubMed