. 2022 Jan 13:15:803302.
doi: 10.3389/fncel.2021.803302. eCollection 2021.

Neuroprogenitor Cells From Patients With TBCK Encephalopathy Suggest Deregulation of Early Secretory Vesicle Transport

Affiliations

Neuroprogenitor Cells From Patients With TBCK Encephalopathy Suggest Deregulation of Early Secretory Vesicle Transport

Danielle de Paula Moreira et al. Front Cell Neurosci. .

Abstract

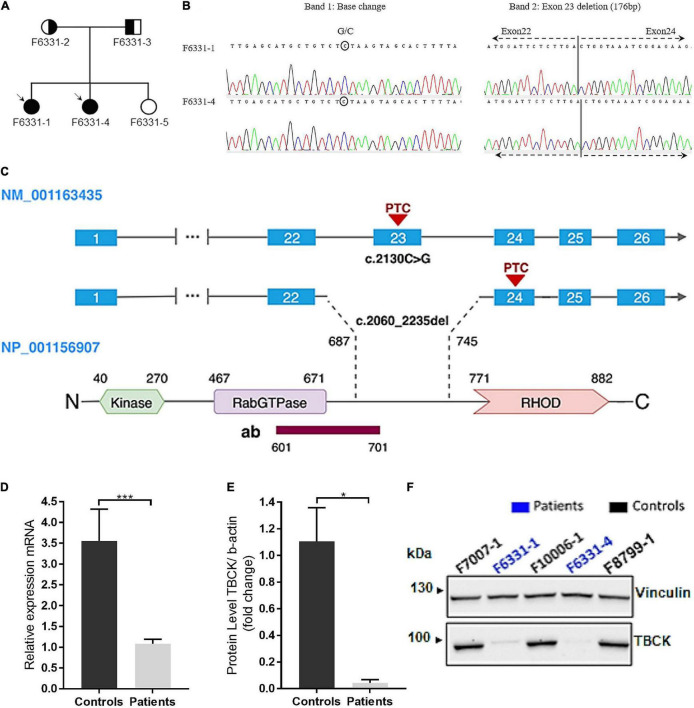
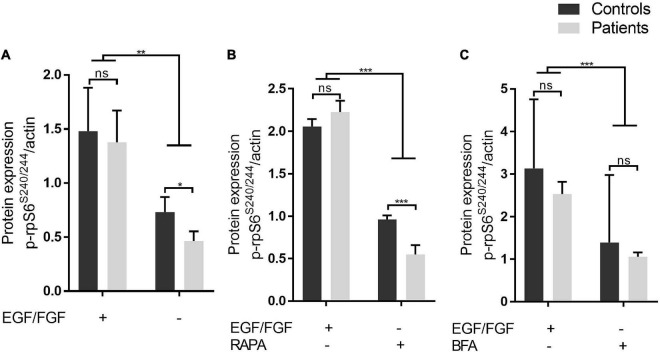
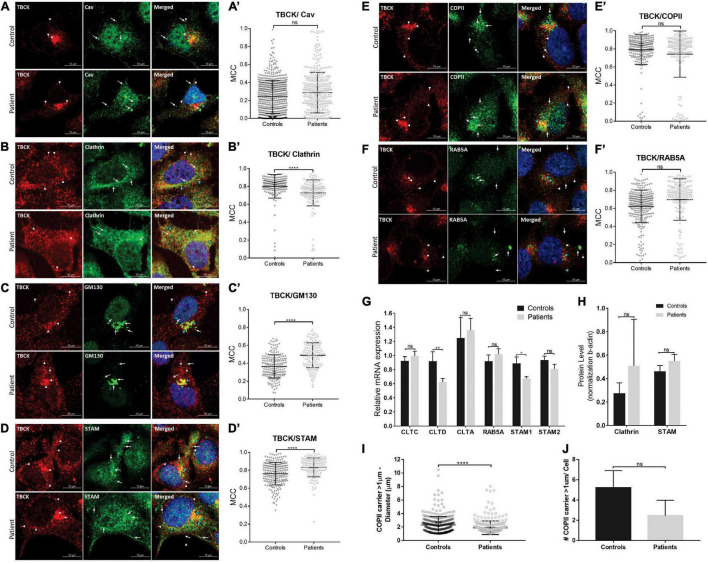
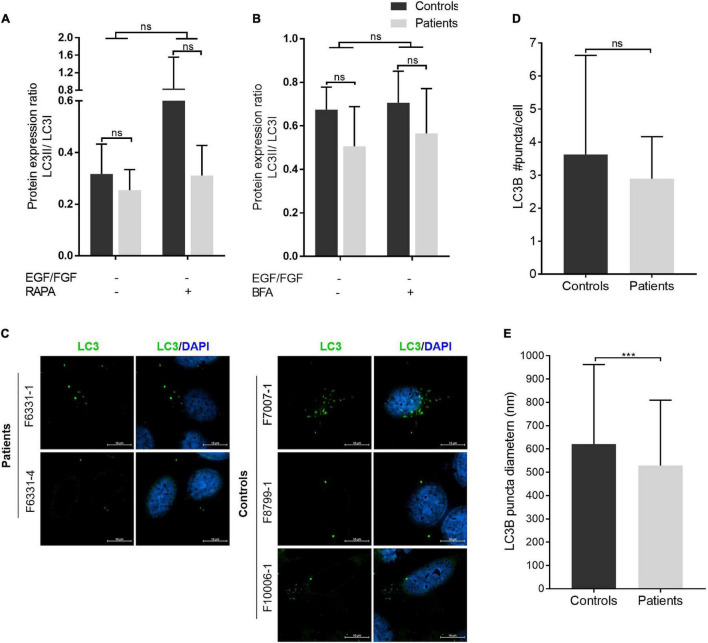
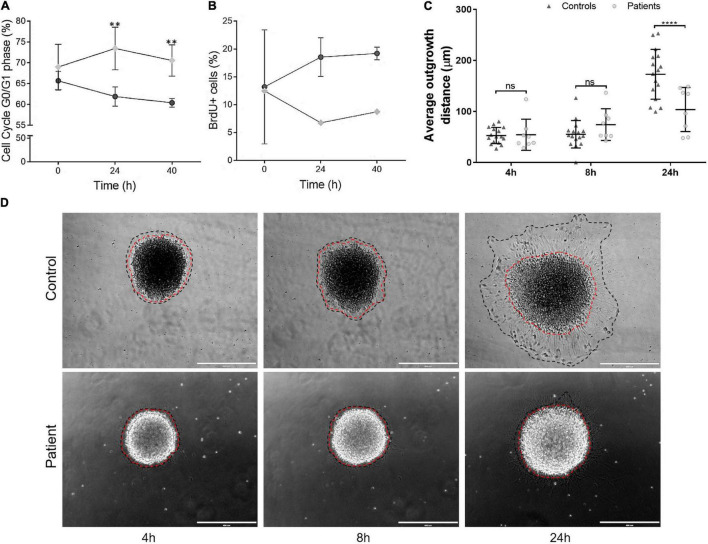
Biallelic pathogenic variants in TBCK cause encephaloneuropathy, infantile hypotonia with psychomotor retardation, and characteristic facies 3 (IHPRF3). The molecular mechanisms underlying its neuronal phenotype are largely unexplored. In this study, we reported two sisters, who harbored biallelic variants in TBCK and met diagnostic criteria for IHPRF3. We provided evidence that TBCK may play an important role in the early secretory pathway in neuroprogenitor cells (iNPC) differentiated from induced pluripotent stem cells (iPSC). Lack of functional TBCK protein in iNPC is associated with impaired endoplasmic reticulum-to-Golgi vesicle transport and autophagosome biogenesis, as well as altered cell cycle progression and severe impairment in the capacity of migration. Alteration in these processes, which are crucial for neurogenesis, neuronal migration, and cytoarchitecture organization, may represent an important causative mechanism of both neurodevelopmental and neurodegenerative phenotypes observed in IHPRF3. Whether reduced mechanistic target of rapamycin (mTOR) signaling is secondary to impaired TBCK function over other secretory transport regulators still needs further investigation.

Keywords: GM130; STAM; autophagy; clathrin; early secretory pathway; iPSC-neurodevelopmental disease modeling; mTOR; vesicle trafficking.


Conflict of interest statement

The authors declare that the research was conducted in the absence of any commercial or financial relationships that could be construed as a potential conflict of interest.

Figures

FIGURE 1
FIGURE 1
IHPRF3 patients harboring biallelic pathogenic variants in TBCK and relative quantification of mRNA and protein expression levels in iNPC. (A) Pedigree of family F6331. Circle—female; square—male; symbol-filled—affected patients; symbol empty—not affected sister; circle half-filled—harbors the heterozygous microdeletion; square half-filled—harbors the heterozygous stopgain variant. (B) Chromatograms of the cDNA sequence show that both alleles are expressed: in the left image, a base change in Band 1 (expected base G changed to a C in reverse strand) represents the stopgain variant; and in the right image, the juxtaposition of exons 22 and 24 (excision of exon 23) in Band 2 representing the allele with the microdeletion. Bands 1 and 2 represent cDNA PCR products for TBCK in agarose gel (Supplementary Figure 2A). (C) Schematic representation of TBCK transcript and protein. The illustration shows the two mutant isoforms identified in the patients and the predicted positions on the protein. The antibody target region is also represented. The pathogenic variants create a putative premature termination codon (PTC) in exons 23 and 24, located within the C-terminal region of the protein, upstream of the RHOD domain. (D) TBCK mRNA expression (data from TBCK-mRNA-3 primer pair) shows reduced transcript levels in patients, compared with controls. Each biological sample had three technical replicates, and each individual was considered a biological replicate. (E,F) Western blot (WB) shows low levels of TBCK protein in iNPC of patients, compared with iNPC of controls, which are compatible with an autosomal recessive inheritance condition. *p-value < 0.05, ***p-value < 0.001, and n.s.—not significant. Data on graphs are shown as mean ± SD of technical replicates and biological samples. Patients: F6331-1 and F6331-4 (N = 2); controls: F7007-1, F8799-1, and F10006-1 (N = 4).
FIGURE 2
FIGURE 2
Under stress-inducing conditions, patient-derived iNPC exhibits reduced RPS6 phosphorylation. (A–C) Protein level of phospho-RPS6 (residues S240-244) from iNPC cultivated under normal growth conditions and three stress-inducing conditions. iNPC without epidermal growth factor (EGF) and FGF-2 for 24 h only (A), without EGF/FGF-2 and concomitant treatment with rapamycin (100 nM) for 24 h (B), or without EGF/FGF-2 and subsequent treatment with brefeldin A (BFA, 4 μM) for 3 h (C). *p-value < 0.05. WB experiments were replicated twice. Data are shown as mean ± SD of technical replicates and biological samples. Patients: F6331-1 and F6331-4 (N = 2); controls: F7007-1, F8799-1, and F10006-1 (N = 3). **p-value < 0.01, ***p-value < 0.001, ns - not significant.
FIGURE 3
FIGURE 3
Patient-derived iNPC show altered colocalization levels with endocytic and early secretory pathway markers. (A–F) Representative images of confocal microscopy of iNPC coimmunostained for endogenous TBCK and specific vesicle transport machinery components: (A) Caveolin (Cav), (B) Clathrin, (C) GM130/GOLGA2, (D) STAM, (E) COPII, and (F) RAB5A. For more detailed images, see Supplementary Figure 5. White arrowheads indicate TBCK dots; white arrows indicate the vesicle transport regulators indicated on each image; blue arrows indicate the colocalized dots. (A′–F′) Graphs of Manders coefficient colocalization (MCC) of TBCK with each target protein. Measurements were performed using ImageJ/Fiji-Coloc2 plugin. Error bars indicate SD (each dot represents the MCC in each cell; data represent the analysis of n > 150 cells/individual). (G) Relative mRNA expression of vesicle transport regulators in iNPC grown as neurospheres show reduced clathrin heavy chain CLTD and STAM1 transcript levels in neurospheres of patients, compared with neurospheres of controls. (H) Clathrin and STAM immunoblot densitometries reveal a tendency to increase protein levels in neurospheres of patients, compared with neurospheres of controls. (I,J) Analysis of large COPII carrier (>1 μm) average diameter (I) and number per cell (J). ****p-value < 0.0001. Unpaired t-test, two-tailed. Data are shown as mean ± SD of biological replicates. 4′,6-diamidino-2-phenylindole (DAPI) (blue) marks cell nuclei. Scale bar = 10 μM. Patients: F6331-1 and F6331-4 (N = 2); controls: F7007-1, F8799-1, and F10006-1 (N = 3). *p-value < 0.05, **p-value < 0.01, ns - not significant.
FIGURE 4
FIGURE 4
Autophagosome biogenesis analysis: LC3B puncta diameter is reduced in patient-derived iNPC. (A,B) Graphs show the densitometries of immunoblots shown in Supplementary Figure 4. Patients are represented in gray ray bars and controls in black bars. Graphs show the LC3A-B II/I ratio from iNPC cultivated under normal growth conditions and under stress-inducing conditions: absence of EGF and fibroblast growth factor-2 (FGF-2) for 24 h and (A) concomitant treatment with rapamycin (100 nM) for 24 h, and (B) subsequent treatment with BFA (4 μM) for 3 h. β-actin was used as a loading control. Graphs are represented in arbitrary units. (C–E) Immunostaining analysis of endogenous LC3B by confocal microscopy. Representative images are presented in panel (C); average LC3B puncta diameter (nm) in panel (D); and an average number of LC3B puncta per cell in panel (E). ***p-value < 0.001; n.s.—not significant. Data are shown as mean values ± SD of biological replicates. Patients: F6331-1 and F6331-4 (N = 2); controls: F7007-1, F8799-1, and F10006-1 (N = 3).
FIGURE 5
FIGURE 5
iNPC expressing TBCK-mutated protein show altered cell cycle progression, cell proliferation, and cell migration. (A) G0/G1-phase analyses at three time points, showing an increased percentage of cells of patients arrested at G0/G1 cell cycle stage. Cell cycle experiments were replicated twice. (B) BrdU-positive cells showed that iNPC of patients had lower incorporation of BrdU. Data are shown as percentages. BrdU incorporation experiment was performed once for each sample. Patient: F6331-1; controls: F7007-1, F8799-1, and F10006-1. (C,D) iNPC migration from neurospheres, measured as the distance of the longest outer diameter of the cells that migrated from the neurosphere, normalized to the inner neurosphere edge. (D) Representative images of migration assay. Red dashed line—inner diameter; black dashed line—outer diameter. Scale bar = 400 μm. Patients: F6331-1 and F6331-4 (N = 2); controls: F7007-1, F8799-1, and F10006-1 (N = 3); Neurosphere technical replicates = 4. Data are shown as mean values ± SD of patients and control biological replicates. **p-value < 0.01, ****p-value < 0.0001, ns - not significant.

References

    1. American Psychiatric Association (2013). Diagnostic and Statistical Manual of Mental Disorders, 5th Edn. Arlington, VA: American Psychiatric Association.
    1. Aprile D., Fruscione F., Baldassari S., Fadda M., Ferrante D., Falace A. (2019). TBC1D24 regulates axonal outgrowth and membrane trafficking at the growth cone in rodent and human neurons. Cell Death Differ. 26 2464–2478. 10.1038/s41418-019-0313-x - DOI - PMC - PubMed
    1. Beck-Wödl S., Harzer K., Sturm M., Buchert R., Rieß O., Mennel H. D., et al. (2018). Homozygous TBC1 domain-containing kinase (TBCK) mutation causes a novel lysosomal storage disease - a new type of neuronal ceroid lipofuscinosis (CLN15)? Acta Neuropathol. Commun. 6:145. 10.1186/s40478-018-0646-6 - DOI - PMC - PubMed
    1. Bhoj E. J., Li D., Harr M., Edvardson S., Elpeleg O., Chisholm E. (2016). Mutations in TBCK, encoding TBC1-domain-containing kinase, lead to a recognizable syndrome of intellectual disability and hypotonia. Am. J. Hum. Genet. 98 782–788. 10.1016/j.ajhg.2016.03.016 - DOI - PMC - PubMed
    1. Borrell V., Calegari F. (2014). Mechanisms of brain evolution: regulation of neural progenitor cell diversity and cell cycle length. Neurosci. Res. 86 14–24. 10.1016/j.neures.2014.04.004 - DOI - PubMed