

Simulated Annealing-Based Image Reconstruction for Patients With COVID-19 as a Model for Ultralow-Dose Computed Tomography
- PMID: 35095544
- PMCID: PMC8795832
- DOI: 10.3389/fphys.2021.737233
Simulated Annealing-Based Image Reconstruction for Patients With COVID-19 as a Model for Ultralow-Dose Computed Tomography
Abstract
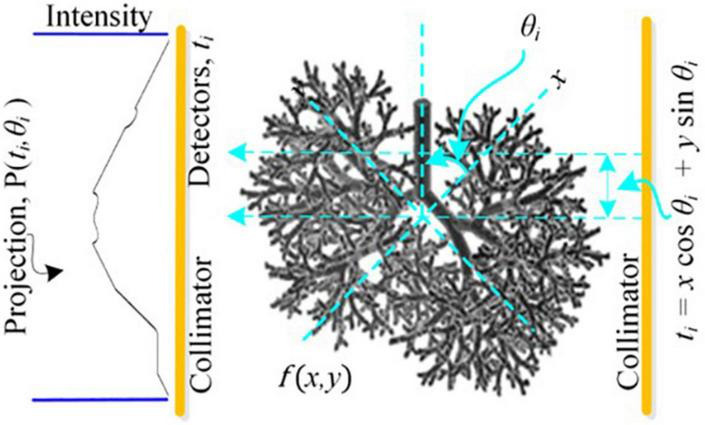
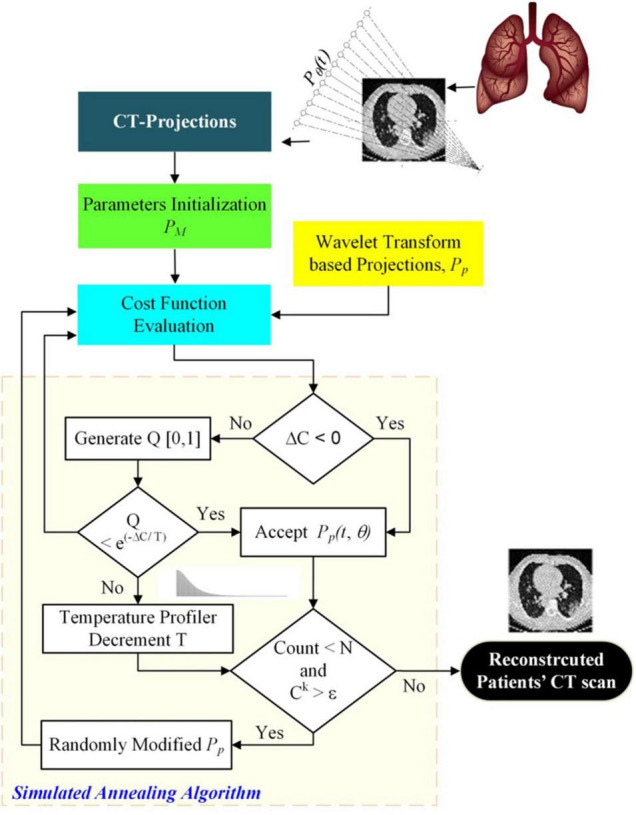
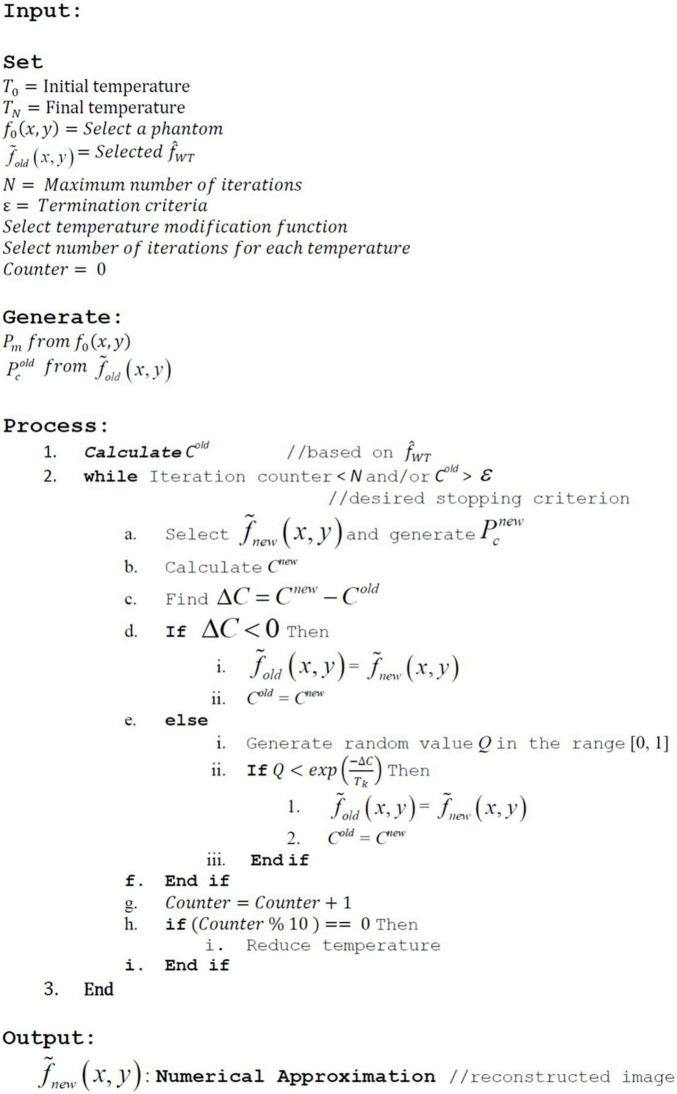
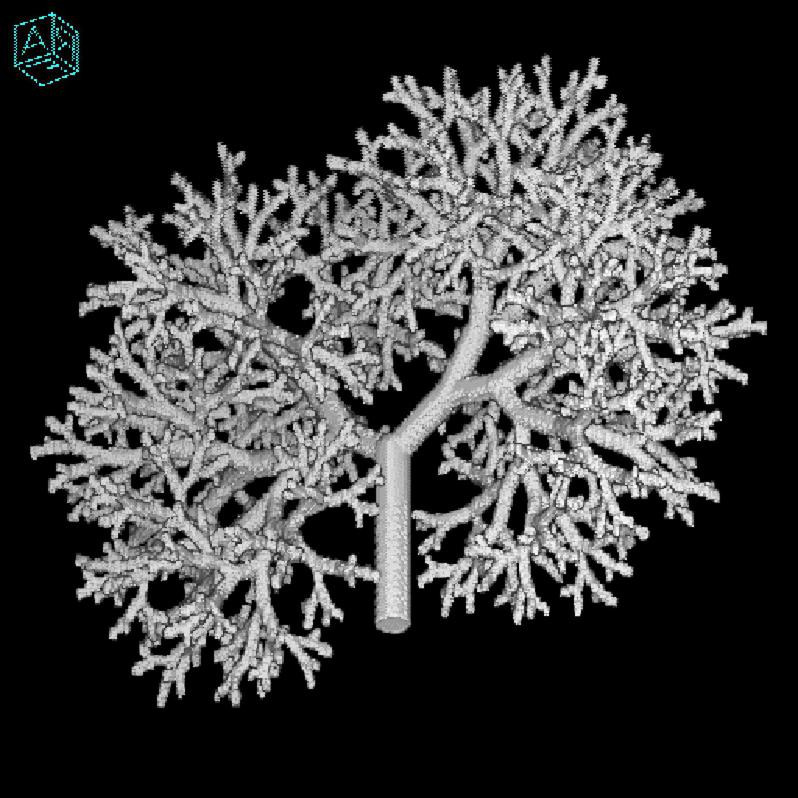
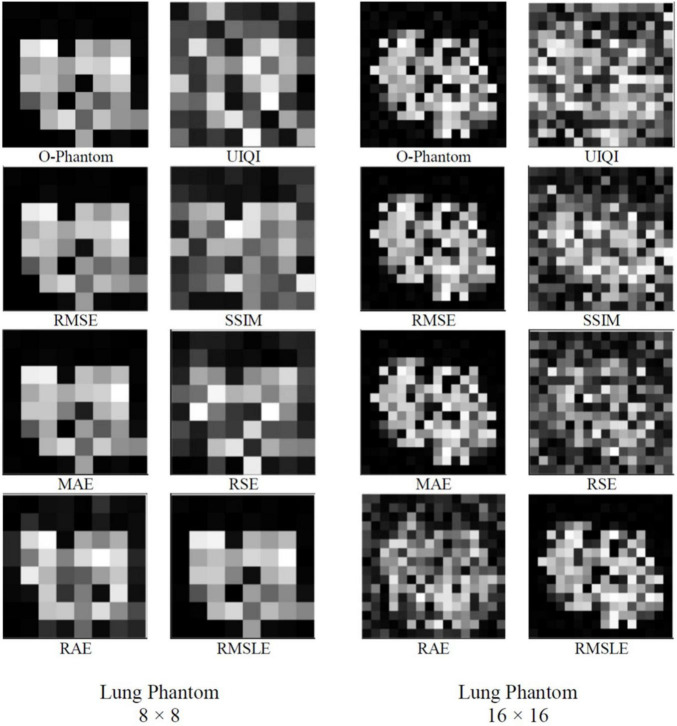
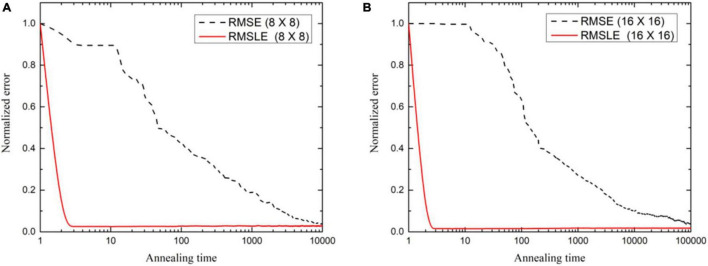
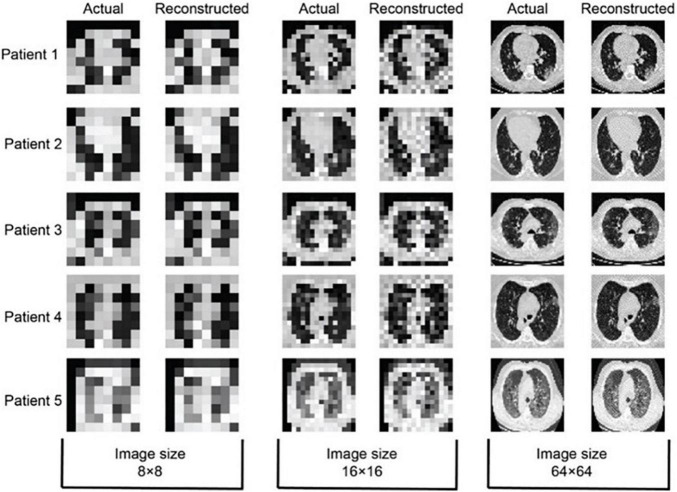
The proposed algorithm of inverse problem of computed tomography (CT), using limited views, is based on stochastic techniques, namely simulated annealing (SA). The selection of an optimal cost function for SA-based image reconstruction is of prime importance. It can reduce annealing time, and also X-ray dose rate accompanying better image quality. In this paper, effectiveness of various cost functions, namely universal image quality index (UIQI), root-mean-squared error (RMSE), structural similarity index measure (SSIM), mean absolute error (MAE), relative squared error (RSE), relative absolute error (RAE), and root-mean-squared logarithmic error (RMSLE), has been critically analyzed and evaluated for ultralow-dose X-ray CT of patients with COVID-19. For sensitivity analysis of this ill-posed problem, the stochastically estimated images of lung phantom have been reconstructed. The cost function analysis in terms of computational and spatial complexity has been performed using image quality measures, namely peak signal-to-noise ratio (PSNR), Euclidean error (EuE), and weighted peak signal-to-noise ratio (WPSNR). It has been generalized for cost functions that RMSLE exhibits WPSNR of 64.33 ± 3.98 dB and 63.41 ± 2.88 dB for 8 × 8 and 16 × 16 lung phantoms, respectively, and it has been applied for actual CT-based image reconstruction of patients with COVID-19. We successfully reconstructed chest CT images of patients with COVID-19 using RMSLE with eighteen projections, a 10-fold reduction in radiation dose exposure. This approach will be suitable for accurate diagnosis of patients with COVID-19 having less immunity and sensitive to radiation dose.
Keywords: COVID-19 patients; Radon transform; cost functions; inverse problem; simulated annealing; ultralow dose CT.
Copyright © 2022 Qureshi, Rehman, Mir, Rafique and Muhammad.
Conflict of interest statement
The authors declare that the research was conducted in the absence of any commercial or financial relationships that could be construed as a potential conflict of interest.
Figures
Similar articles
-
On the Simulation of Ultra-Sparse-View and Ultra-Low-Dose Computed Tomography with Maximum a Posteriori Reconstruction Using a Progressive Flow-Based Deep Generative Model.Tomography. 2022 Aug 24;8(5):2129-2152. doi: 10.3390/tomography8050179. Tomography. 2022. PMID: 36136875 Free PMC article.
-
Low-dose CT reconstruction method based on prior information of normal-dose image.J Xray Sci Technol. 2020;28(6):1091-1111. doi: 10.3233/XST-200716. J Xray Sci Technol. 2020. PMID: 33044223
-
A novel weighted total difference based image reconstruction algorithm for few-view computed tomography.PLoS One. 2014 Oct 2;9(10):e109345. doi: 10.1371/journal.pone.0109345. eCollection 2014. PLoS One. 2014. PMID: 25275385 Free PMC article.
-
Projection-domain scatter correction for cone beam computed tomography using a residual convolutional neural network.Med Phys. 2019 Jul;46(7):3142-3155. doi: 10.1002/mp.13583. Epub 2019 Jun 5. Med Phys. 2019. PMID: 31077390 Free PMC article.
-
CT artifact correction for sparse and truncated projection data using generative adversarial networks.Med Phys. 2021 Feb;48(2):615-626. doi: 10.1002/mp.14504. Epub 2020 Dec 30. Med Phys. 2021. PMID: 32996149 Review.
Cited by
-
Semi-supervised contour-driven broad learning system for autonomous segmentation of concealed prohibited baggage items.Vis Comput Ind Biomed Art. 2024 Dec 24;7(1):30. doi: 10.1186/s42492-024-00182-7. Vis Comput Ind Biomed Art. 2024. PMID: 39715960 Free PMC article.
References
-
- Agostini A., Floridi C., Borgheresi A., Badaloni M., Pirani P. E., Terilli F., et al. (2020). Proposal of a low-dose, long-pitch, dual-source chest CT protocol on third-generation dual-source CT using a tin filter for spectral shaping at 100 kVp for coronavirus disease 2019 (COVID-19) patients: a feasibility study. Radiol. Med. 125 365–373. 10.1007/s11547-020-01179-x - DOI - PMC - PubMed
-
- Arnold B. F., Stahlecker P. (2002). Linear regression analysis using the relative squared error. Linear Algebra Appl. 354 3–20.
LinkOut - more resources
Full Text Sources
Miscellaneous