. 2022 Jan 14:12:797025.
doi: 10.3389/fendo.2021.797025. eCollection 2021.

PFKP Activation Ameliorates Foot Process Fusion in Podocytes in Diabetic Kidney Disease

Affiliations

PFKP Activation Ameliorates Foot Process Fusion in Podocytes in Diabetic Kidney Disease

Zongwei Zhang et al. Front Endocrinol (Lausanne). .

Abstract

Background: Glycolysis dysfunction is an important pathogenesis of podocyte injury in diabetic kidney disease (DKD). Foot process fusion of podocytes and increased albuminuria are markers of early DKD. Moreover, cytoskeletal remodeling has been found to be involved in the foot process fusion of podocytes. However, the connections between cytoskeletal remodeling and alterations of glycolysis in podocytes in DKD have not been clarified.

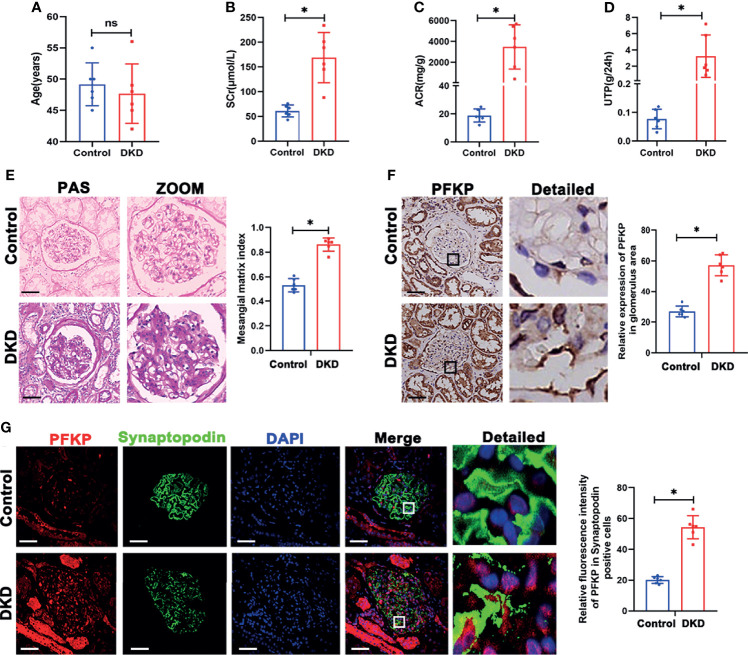
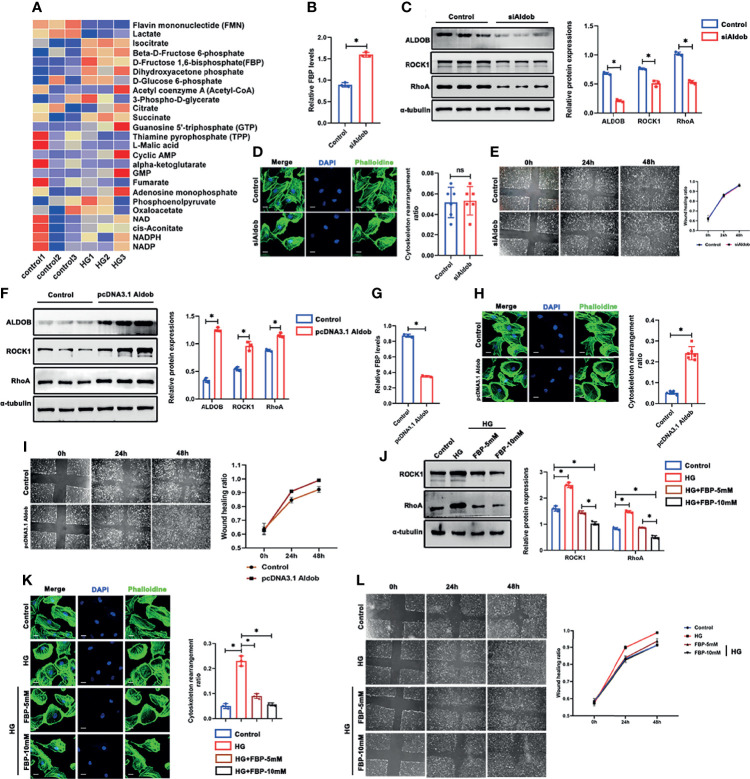
Methods: mRNA sequencing of glomeruli obtained from db/db and db/m mice with albuminuria was performed to analyze the expression profiling of genes in glucose metabolism. Expressions of phosphofructokinase platelet type (PFKP) in the glomeruli of DKD patients were detected. Clotrimazole (CTZ) was used to explore the renal effects of PFKP inhibition in diabetic mice. Using Pfkp siRNA or recombinant plasmid to manipulate PFKP expression, the effects of PFKP on high glucose (HG) induced podocyte damage were assessed in vitro. The levels of fructose-1,6-bisphosphate (FBP) were measured. Targeted metabolomics was performed to observe the alterations of the metabolites in glucose metabolism after HG stimulation. Furthermore, aldolase type b (Aldob) siRNA or recombinant plasmid were applied to evaluate the influence of FBP level alteration on podocytes. FBP was directly added to podocyte culture media. Db/db mice were treated with FBP to investigate its effects on their kidney.

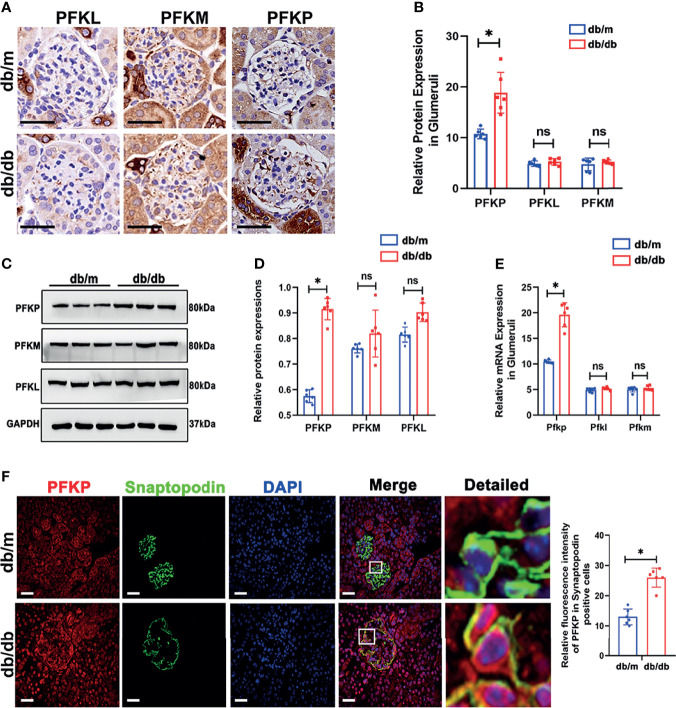
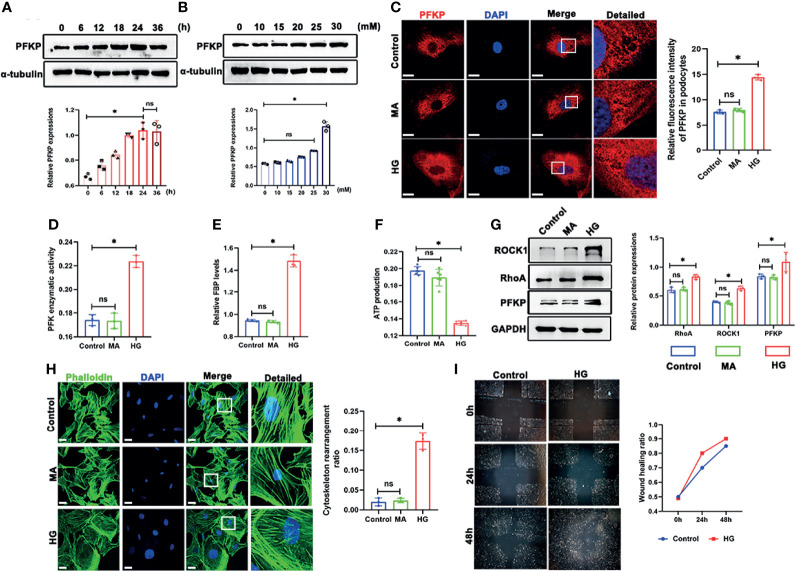
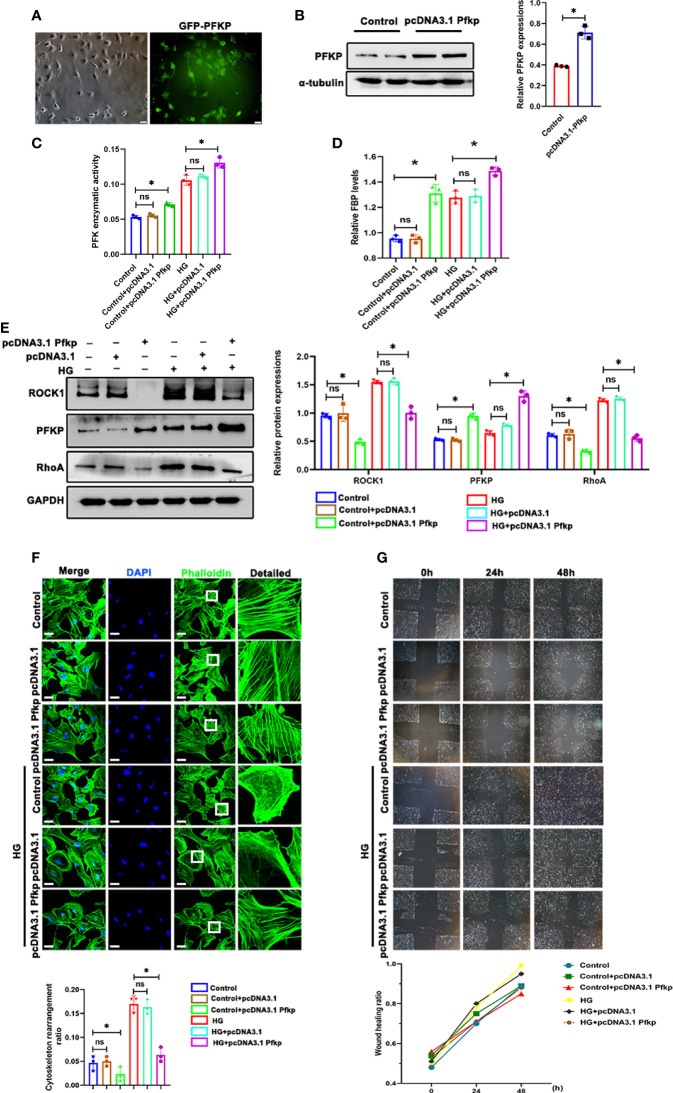
Results: mRNA sequencing showed that glycolysis enzyme genes were altered, characterized by upregulation of upstream genes (Hk1, and Pfkp) and down-regulation of downstream genes of glycolysis (Pkm, and Ldha). Moreover, the expression of PFKP was increased in glomeruli of DKD patients. The CTZ group presented more severe renal damage. In vitro, the Pfkp siRNA group and ALDOB overexpression group showed much more induced cytoskeletal remodeling in podocytes, while overexpression of PFKP and suppression of ALDOB in vitro rescued podocytes from cytoskeletal remodeling through regulation of FBP levels and inhibition of the RhoA/ROCK1 pathway. Furthermore, targeted metabolomics showed FBP level was significantly increased in HG group compared with the control group. Exogenous FBP addition reduced podocyte cytoskeletal remodeling and renal damage of db/db mice.

Conclusions: These findings provide evidence that PFKP may be a potential target for podocyte injury in DN and provide a rationale for applying podocyte glycolysis enhancing agents in patients with DKD.

Keywords: FBP; PFKP; cytoskeletal remodeling; diabetic kidney diseases; glycolysis; podocyte injury.


Conflict of interest statement

The authors declare that the research was conducted in the absence of any commercial or financial relationships that could be construed as a potential conflict of interest.

Figures

Figure 1
Figure 1
Renal phenotype alteration of db/db mice and profiling of genes involved in glucose catabolism in glomeruli from db/db and db/m mice by mRNA sequencing. (A) Representative microscopy images and quantification of PAS staining of kidney sections from db/m and db/db mice at 16 and 24 weeks of age (original magnification ×400). (B) Representative findings of the ultrastructure of capillary loops collected from db/m and db/db mice at different timepoints, as examined by transmission electron microscopy (original magnification×8,000, ×12,000). (C) Blood sugar of db/m and db/db mice. (D) Body weight of db/m and db/db mice. (E) Quantitative analysis of ACR (albumin-to-creatinine ratio) in db/m and db/db mice. (F) Survival curve of db/m and db/db mice over time. (G) Gene expression profiles were compared between glomeruli of db/m and db/db mice, and heat maps were generated based on significantly differential expression of genes related to glucose metabolism. (H) Schematic flow illustrating the representative genes in the glycolysis cascade. Red text represents upregulated genes, and blue text represents downregulated genes in the glomeruli of db/db mice in comparison to db/m mice. Akr1b1, aldo-keto reductase family 1, member B1 (aldose reductase); Hk, hexokinase; G6pc, glucose-6-phosphatase, catalytic subunit; Sord, sorbitol dehydrogenase; Pfk, phosphofructokinase; Fbp2, fructose-1,6-diphosphatase 2; Gapdh, glyceraldehyde 3-phosphate dehydrogenase; Tpi1, triosephosphate isomerase 1; Pgk, phosphoglycerate kinase; Pgm1, phosphoglucomutase-1; Eno1, enolase 1; Pkm, pyruvate kinase isoenzyme; Pdh, pyruvate dehydrogenase; Ldh, lactate dehydrogenase; Hagh, hydroxyacyl glutathione hydrolase; Glo1, glyoxalase 1. (I) Relative mRNA expression of Hk1, Pfkp, Pkm and Ldha in the glomeruli of db/m and db/db mice determined by real-time PCR. (J) Representative immunohistochemistry staining of glomerular HK1, PFKP, PKM2, and LDHA in db/m and db/db mice. For all figures, n=6 independent experiments/group. In all statistical plots, *P < 0.05. Scale bars: 20 µm, HK1, hexokinase 1; PFKP, phosphofructokinase 1 platelet type; PKM2, pyruvate kinase isoenzyme 2; LDHA, lactate dehydrogenase A.
Figure 2
Figure 2
PFK expressions in db/m and db/db mice. (A, B) Representative immunohistochemistry staining of glomerular PFKP, PFKM and PFKL in db/m and db/db mice. (C, D) Western blotting analysis of the expression of PFKP, PFKM and PFKL in glomeruli of db/m and db/db mice. GAPDH was used as the loading control. (E) Relative mRNA expression of Pfkp, Pfkm and Pfkl in glomeruli of db/m and db/db mice determined by real-time PCR. (F) Representative immunofluorescent staining of PFKP in podocyte of glomeruli from db/m and db/db mice. Synaptopodin was used as podocyte markers. For all figures, n=6 independent experiments/group. In all statistical plots, *P < 0.05, ns, No significance. Scale bars: 20 µm, PFKP, phosphofructokinase 1 platelet type; PFKM, phosphofructokinase 1 muscle type; PFKL, phosphofructokinase 1 liver type.
Figure 3
Figure 3
PFKP expression in podocytes from patients with biopsy proved DKD. (A) Age of subjects in each group. (B) SCr values of subjects in each group. (C) ACR values of subjects in each group. (D) UTP values of subjects in each group. (E) Representative microscopy images and quantification of PAS staining of kidney sections in each group (original magnification ×200). (F) Representative immunohistochemistry staining of glomerular PFKP in each group. (Original magnification ×200). (G) Representative immunofluorescence staining of PFKP in podocytes in each group. Synaptopodin was used as podocyte markers. For all figures, n=6 independent experiments/group. In all statistical plots, *P < 0.05, ns, No significance. Scale bars: 20 µm, DKD, diabetic kidney disease; PFKP, Phosphofructokinase 1 platelet type; SCr, Serum creatinine; UTP, Total proteinuria; ACR, urine albumin/creatinine ratio.
Figure 4
Figure 4
Suppression of PFKP overactivation aggravated renal damage in db/db mice. (A) Schematic diagram of Clotrimazole administration in advanced db/db mice. (B) Representative microscopy images and quantification of PAS staining of kidney sections in each group (original magnification ×400). (C) Quantitative of ACR (albumin-to-creatinine ratio) in each group. (D) Representative transmission electron microscopy images of the ultrastructure of capillary loops in each group (original magnification×8,000, ×12,000). (E) Survival curve of db/m and db/db mice treated with CTZ over time. (F) Representative immunofluorescence staining of podocytes PFKP in each group. Synaptopodin was used as the podocyte marker. (G) Representative immunohistochemistry staining of glomerular PFKP in each group. (H) Western blotting analysis of PFKP expression in glomeruli of each group. GAPDH was set as loading control. For all figures, n=6 independent experiments/group. *P < 0.05. Scale bars: 20 µm, CTZ, Clotrimazole; PFKP, Phosphofructokinase 1 platelet type.
Figure 5
Figure 5
High glucose promoted PFKP expression and cytoskeletal remodeling in podocytes in vitro. (A) Representative western blots of PFKP expression in 30 mM HG-treated podocytes at various times points and quantification of these results, with α-tubulin as the loading control. (B) Representative western blots of PFKP expression in cultured podocytes stimulated with different concentrations of glucose for 24 h and quantification of these results, with α-tubulin set as the loading control. (C) Representative immunofluorescence staining of podocytes PFKP in each group. (D) PFK enzymatic activity in each group. (E) FBP level in each group. (F) ATP production in each group. (G) Western blotting analyses of the expression of ROCK1, PFKP and RhoA in podocytes in each group. GAPDH was set as the loading control. (H) Cytoskeletal structures of podocytes labeled with phalloidin. (I) Motility of podocytes quantified by a wound-healing assay using an inverted microscope. For all figures, n=3 independent experiments/group. *P < 0.05, ns, No significance. Scale bars: 10 µm. HG, high glucose; MA, mannitol; ROCK1, Rho-associated, coiled-coil containing protein kinase 1; PFKP, phosphofructokinase 1 platelet type; RhoA, RhoA-GTPase.
Figure 6
Figure 6
Deletion of PFKP aggravated HG-induced cytoskeletal remodeling in podocytes in vitro. (A) Western blots of PFKP expression after transfection with various siPfkps, with GAPDH set as the loading control. (B) PFK enzymatic activity and FBP level in each group. (C) Cytoskeletal structures of podocytes labeled with phalloidin and the cytoskeletal rearrangement ratio in each group (original magnification ×600). (D) Western blotting analyses of the expression of ROCK1, PFKP, and RhoA in podocytes of each group. GAPDH was set as the loading control. (E) Motility of podocytes measured by a wound-healing assay using an inverted microscope. For all figures, n=3 independent experiments/group. *P < 0.05, ns, No significance. Scale bars: 10 µm. HG, high glucose; ROCK1, Rho-associated, coiled-coil containing protein kinase 1; PFKP, phosphofructokinase 1 platelet type; RhoA, RhoA-GTPase.
Figure 7
Figure 7
Overexpression of PFKP ameliorated HG-induced cytoskeletal remodeling in podocytes in vitro. (A) After recombinant plasmid (pcDNA3.1-Pfkp) transfection into podocytes, the expression of EGFP was observed by fluorescence microscopy. (B) Western blots of PFKP expression after transfection with pcDNA3.1-Pfkp, with GAPDH set as the loading control. (C) PFK enzymatic activity in each group. (D) FBP level in each group. (E) Western blotting analyses of the expression of ROCK1, PFKP, and RhoA in podocytes in each group. GAPDH was set as the loading control. (F) Cytoskeletal structures of podocytes labeled with phalloidin. (G) Motility of podocytes measured by a wound-healing assay using an inverted microscope. For all figures, n=3 independent experiments/group. *P < 0.05, ns, No significance. Scale bars: 10 µm. HG, high glucose; ROCK1, Rho-associated, coiled-coil containing protein kinase 1; PFKP, phosphofructokinase 1 platelet type; RhoA, RhoA-GTPase.
Figure 8
Figure 8
FBP ameliorated HG-induced cytoskeletal remodeling in podocytes in vitro. (A) Targeted metabolomics was performed between control and HG group of cultured podocytes, and heat maps were generated based on levels of the metabolites related to glucose metabolism. (B) Western blots of ALDOB, ROCK1, PFKP, and RhoA after transfected with siAldob, GAPDH was set as the loading control. (C) FBP level in control and siAldob group. (D) Cytoskeletal structure of podocytes labeled with phalloidin in control and siAldob group. (E) Motility ability of podocytes were measured by wound-healing assay using an inverted microscope in control and siAldob group. (F) Western blotting analyses the expression of ALDOB, ROCK1, PFKP, and RhoA in podocytes after transfected with pcDNA3.1-Aldob. GAPDH was set as loading control. (G) FBP level in control and pcDNA3.1-Aldob group. (H) Cytoskeleton structure of podocytes labeled with phalloidin in control and pcDNA3.1-Aldob group. (I) Motility ability of podocytes were measured by wound-healing assay using an inverted microscope in control and pcDNA3.1-Aldob group. (J) Western blotting analyses the expression of ALDOB, ROCK1, PFKP, and RhoA in podocytes after FBP treatment. GAPDH was set as loading control. (K) Cytoskeleton structure of podocytes labeled with phalloidin in each group. (L) Motility ability of podocytes were measured by wound-healing assay using an inverted microscope in each group. For all figures, n=3 independent experiments/group. *P < 0.05, ns, No significance. Scale bars: 10 µm. HG, high glucose; FBP, fructose-1,6-bisphosphate; ROCK1, Rho-associated, coiled-coil containing protein kinase 1; PFKP, Phosphofructokinase 1 platelet type; RhoA, RhoA-GTPase.
Figure 9
Figure 9
FBP protected db/db mice from foot process fusion in podocytes. (A) Schematic diagram of FBP administration in advanced db/db mice. (B) Representative microscopy images and quantification of PAS staining of kidney sections from individual group (original magnification ×400). (C) Representative transmission electron microscopy images of the ultrastructure of capillary loops in each group (original magnification×8,000, ×12,000). (D) Quantitative of ACR (albumin-to-creatinine ratio) in each group. (E) Body weight of mice in each group. (F) Blood sugar of mice in each group. (G) Survival curve of db/m and db/db mice treated with FBP over time. For all figures, n=6 independent experiments/group. *P < 0.05, ns, No significance. Scale bars: 20 µm, FBP, fructose-1,6-bisphosphate; 500, 500mg/kg/d; 1000, 1000mg/kg/d.

Similar articles

Cited by

References

    1. Zhang L, Long J, Jiang W. Trends in Chronic Kidney Disease in China. N Engl J Med (2016) 375(9):905–6. doi: 10.1056/NEJMc1602469 - DOI - PubMed
    1. Duan J, Wang C, Liu D. Prevalence and Risk Factors of Chronic Kidney Disease and Diabetic Kidney Disease in Chinese Rural Residents: A Cross⁃Sectional Survey. Sci Rep (2019) 9(1):10408. doi: 10.1038/s41598-019-46857-7 - DOI - PMC - PubMed
    1. Samsu N. Diabetic Nephropathy: Challenges in Pathogenesis, Diagnosis, and Treatment. Biomed Res Int (2021) 2021:1497449. doi: 10.1155/2021/1497449 - DOI - PMC - PubMed
    1. Lee SY, Choi ME. Urinary Biomarkers for Early Diabetic Nephropathy: Beyond Albuminuria. Pediatr Nephrol (2015) 30(7):1063–75. doi: 10.1007/s00467-014-2888-2 - DOI - PMC - PubMed
    1. Garg P. A Review of Podocyte Biology. Am J Nephrol (2018) 47 Suppl 1:3–13. doi: 10.1159/000481633 - DOI - PubMed

Publication types

MeSH terms