. 2022 Jan 14:12:729990.
doi: 10.3389/fimmu.2021.729990. eCollection 2021.

Communication Pattern Changes Along With Declined IGF1 of Immune Cells in COVID-19 Patients During Disease Progression

Affiliations

Communication Pattern Changes Along With Declined IGF1 of Immune Cells in COVID-19 Patients During Disease Progression

Min Zhao et al. Front Immunol. .

Abstract

The emergence of severe acute respiratory syndrome coronavirus 2 (SARS-CoV-2), which causes the coronavirus disease 2019 (COVID-19) pandemic, represents a global crisis. Most patients developed mild/moderate symptoms, and the status of immune system varied in acute and regulatory stages. The crosstalk between immune cells and the dynamic changes of immune cell contact is rarely described. Here, we analyzed the features of immune response of paired peripheral blood mononuclear cell (PBMC) samples from the same patients during acute and regulatory stages. Consistent with previous reports, both myeloid and T cells turned less inflammatory and less activated at recovery phase. Additionally, the communication patterns of myeloid-T cell and T-B cell are obviously changed. The crosstalk analysis reveals that typical inflammatory cytokines and several chemokines are tightly correlated with the recovery of COVID-19. Intriguingly, the signal transduction of metabolic factor insulin-like growth factor 1 (IGF1) is altered at recovery phase. Furthermore, we confirmed that the serum levels of IGF1 and several inflammatory cytokines are apparently dampened after the negative conversion of SARS-CoV-2 RNA. Thus, these results reveal several potential detection and therapeutic targets that might be used for COVID-19 recovery.

Keywords: COVID-19; IGF1; communication pattern; immune cells; single-cell sequencing.


Conflict of interest statement

The authors declare that the research was conducted in the absence of any commercial or financial relationships that could be construed as a potential conflict of interest.

Figures
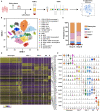
Figure 1
Figure 1
Study design and immune profile of COVID-19 patients. (A) Schematic depicting the overall design of the study. Three moderate COVID-19 patients (C1, C2, and C3) were recruited, and peripheral blood was collected twice during hospital admission. The first peripheral blood samples collected immediately after admission indicated as the early phase sample. After the nucleic acid detection of SARS-CoV-2 converted negative, the second sample (late phase) was collected. Peripheral blood mononuclear cells (PBMCs) were isolated and prepared into nanoliter-scale Gel Bead-In-Emulsions (GEMs) with 10× genomics Chromium Single Cell 3′ Reagent Kits. After reverse transcription, cDNA amplification, and library construction, gene expression libraries were sequenced and analyzed. (B) tSNE representation of immune cell clusters identified in sc-RNA seq data. Data of all six samples (two samples each patient) were pooled and analyzed. (C) Frequency distributions of five cell types of the three patients in in both stages A and B. Monocytes, CD4+T cells, CD8+T cells, NK cell, and B cells were represented as orange, medium lavender magenta, misty rose, blue, and brick red, respectively. (D) Heatmap of gene expression in five major immune cell subsets. Representative genes with high expression were listed beside. The relative expression level was defined from 10 to −10 and colored from yellow to purple. The higher the gene was expressed, the yellower the color was represented. (E) Expressions of representative genes in each subset were exhibited as violin plot.
Figure 2
Figure 2
Dynamic features of monocytes in COVID-19 patients. (A) Feature plots of characteristic genes were represented via tSNE. The relative gene expression is shown from blue to red. (B) Frequency distribution of six myeloid cell clusters, i.e., Cluster 1 (CD14+CD16 monocytes 1), Cluster 2 (CD14+CD16 monocytes 2), Cluster 11 (CD14+CD16- monocytes 3), Cluster 13 (CD14dimCD16+ monocytes), Cluster 14 (CD14+CD16dim monocytes 4), and Cluster 15 (cDCs), in each stage. (C) Scatter plot of genes expression in Cluster 1 (CD14+CD16 monocytes 1) and Cluster 2 (CD14+CD16 monocytes 2). Differentially expressed genes in Cluster 1 are highlighted as red dots. (D). GO analysis with genes highly expressed in Cluster 1 comparing with Cluster 2. (E) Volcano plots of Cluster 14 (CD14+CD16dim monocytes) versus Cluster 13 (CD14dimCD16+ monocytes). (F) GO analysis with genes highly expressed in Cluster 14 comparing with Cluster 13. (G) Volcano plots of Cluster 11 (CD14+CD16 monocytes 3) versus Cluster 2 (CD14+CD16 monocytes 2). (H) GO analysis with genes highly expressed in Cluster 11 comparing with Cluster 2. Differential expressed genes were defined with threshold of fold change ≥2 and p-value <0.05 and represented as red or blue.
Figure 3
Figure 3
Characterization of CD4+T cells in different stages in COVID-19 patients. (A) Feature plots of characteristic genes of CD4+T cells were represented via tSNE. (B) Genotypes of three CD4+T cell subsets, namely, Cluster 3 (memory CD4+T cells 1), Cluster 5 (memory CD4+T cells 2), Cluster 6 (XIST+CD4+T cells). (C) Frequency distribution of the three CD4+T cell clusters in each stage. (D) Volcano plots of Cluster 3 (memory CD4+T cells 1) versus Cluster 5 (memory CD4+T cells 2), Cluster 3 (memory CD4+T cells 1) versus Cluster 6 (XIST+CD4+T cells), and Cluster 5 (memory CD4+T cells 2) versus Cluster 6 (XIST+CD4+T cells). Differentially expressed genes were defined with threshold of fold change ≥2 and p-value <0.05 and represented as red or blue. (E) GO analysis with genes highly expressed in Cluster 3 comparing with Cluster 6. (F) Signature genes generated from differential gene expression analysis. Size and color of dots are related with counts of gene expression. Bigger and bluer dots represent higher gene expression. (G) Gene sets enrichment analysis (GSEA) between Cluster 3 (memory CD4+T cells 1) and Cluster 5 (memory CD4+T cells 2). Cluster 5 had genes enriched in “intestinal immune for IgA production,” “cytokine–cytokine receptor interaction,” and “chemokine signaling pathway.” Significant enrichment was defined by |NES| > 1, NOM p-val < 0.05, FDR q < 0.25.
Figure 4
Figure 4
Cell–cell contact communications among immune cells. (A) Outgoing and incoming communication patterns of cell–cell contact signaling pathways in stage A. Outgoing and incoming communication patterns of cell–cell contact signaling pathways clustered into five patterns as indicated in the heatmap. In outgoing communication patterns, Clusters 1–17 are indicated as different colors and classified into five patterns (patterns 1–5) except Clusters 6, 7, and 15, according to the outgoing signals they shared. Pattern 1 includes Cluster 1, Cluster 2 (CD14+CD16 monocytes), Cluster 11 (CD14+CD16 monocytes), Cluster 13 (CD14dimCD16+ monocytes), and Cluster 17 (plasma cells). Pattern 2 includes Cluster 3 (CD4+Tm) and Cluster 5 (CD4+Tm). Pattern 3 includes Cluster 9 (NK), Cluster 10 (NK), and Cluster 16 (cycling CD8+T). Pattern 4 includes Cluster 8 (memory B) and Cluster 14 (CD14+CD16dim monocytes). Pattern 5 includes Cluster 4 (CD8+Teff) and Cluster 12 (CD8+Teff). In incoming communication patterns, Clusters 1–17 were classified into five patterns (patterns 1–5) except for Clusters 6, 7, 13, and 17. Pattern 1 includes Clusters 1, Cluster 2 (CD14+CD16 monocytes), and Cluster 11 (CD14+CD16 monocytes). Pattern 2 includes Cluster 4 (CD8+Teff), Cluster 9 (NK), and Cluster 10 (NK). Pattern 3 includes Cluster 3 (CD4+Tm), Cluster 5 (CD4+Tm), and Cluster 15 (cDCs). Pattern 4 includes Cluster 8 (memory B) and Cluster 14 (CD14+CD16dim monocytes). Pattern 5 includes Cluster 12 (CD8+Teff) and Cluster 16 (cycling CD8+T). Signals included in these patterns are indicated in gray boxes. (B) Outgoing and incoming communication patterns of cell–cell contact signaling pathways in stage B. Outgoing and incoming communication patterns of cell–cell contact signaling pathways clustered into five patterns as indicated in the heatmap. (C) Hierarchical network of activated signals in stages A, B. (D) Hierarchical network of inhibitory signals in stages A, B. Signals sent by specific cluster are drawn with the same color indicated in (A). Source and target of signaling pathways are connected by lines. Thickness of lines indicate the degree of the signal. Sender, receiver, mediator, and influencer of specific signals are indicated in individual heatmap. (E) Signals detected uniquely in stage B. Thickness of lines indicate the degree of the signal. Sender, receiver, mediator, and influencer of specific signals are indicated in individual heatmap.
Figure 5
Figure 5
Secreted signaling communications among immune cells. (A) Outgoing and incoming communication patterns of secreted signaling pathways in stage A. In outgoing communication patterns, Clusters 1–17 are indicated as different colors and classified into five patterns (patterns 1–5), according to the outgoing signals they shared. Pattern 1 includes Clusters 1 and 2 (CD14+CD16- monocytes). Pattern 2 includes Cluster 3 (CD4+Tm), Cluster 5 (CD4+Tm), Cluster 6 (XIST+CD4+T), and Cluster 8 (memory B). Pattern 3 includes Cluster 4 (CD8+Teff), Cluster 7 (SYNE1+CD8+T), Cluster 9 (NK), Cluster 10 (NK), Cluster 12 (CD8+Teff), Cluster 16 (cycling CD8+T), and Cluster 17 (plasma cells). Pattern 4 includes Cluster 11 (CD14+CD16- monocytes), Cluster 14 (CD14+CD16dim monocytes), and Cluster 15 (cDCs). Pattern 5 includes Cluster 13 (CD14dimCD16+ monocytes). In incoming communication patterns, Clusters 1–17 were classified into five patterns (patterns 1–5) except for Cluster 12. Pattern 1 includes Clusters 1 and 2 (CD14+CD16- monocytes). Pattern 2 includes Cluster 3 (CD4+Tm), Cluster 5 (CD4+Tm), Cluster 6 (XIST+CD4+T), Cluster 8 (memory B), and Cluster 17 (plasma cells). Pattern 3 includes Cluster 4 (CD8+Teff), Cluster 7 (SYNE1+CD8+T), Cluster 9 (NK), Cluster 10 (NK), and Cluster 16 (cycling CD8+T). Pattern 4 includes Cluster 13 (CD14dimCD16+ monocytes), Cluster 14 (CD14+CD16dim monocytes), and Cluster 15 (cDCs). Pattern 5 includes Cluster 11 (CD14+CD16- monocytes). Signals included in these patterns are indicated in gray boxes. (B) Outgoing and incoming communication patterns of secreted signaling pathways in stage B. Outgoing and incoming communication patterns also clustered to five patterns, respectively. (C) Communication network of secreting signals in stage A and stage B. Signals sent by specific cluster are drawn with the same color indicated in panel (A) Target of signaling pathways are pointed by line arrows. Thickness of lines indicate the degree of the signal. Sender, receiver, mediator, and influencer of specific signals are indicated in individual heatmap. (D) Levels of 48 angiogenic proteins/cytokines/chemokines in stages A and B are generalized and presented in the heatmap. Serum samples from four moderate patients are used and analyzed as shown. The normalized expression is scaled from −3 to 3. (E) Specific inflammatory factors (IL1β, IL8, RANTES, MCP-2, and IGF1) were significantly decreased in stage B (n = 6 in IGF1, IL8, RANTES; n = 4 in MCP2, IL1β, IP-10). Paired t-test was performed, and significances were inferred as p < 0.05 (*).

References

    1. WHO . Available at: https://covid19.who.int/.
    1. Guan WJ, Ni ZY, Hu Y, Liang WH, Ou CQ, He JX, et al. . Clinical Characteristics of Coronavirus Disease 2019 in China. N Engl J Med (2020) 382:1708–20. doi: 10.1056/NEJMoa2002032 - DOI - PMC - PubMed
    1. Huang C, Wang Y, Li X, Ren L, Zhao J, Hu Y, et al. . Clinical Features of Patients Infected With 2019 Novel Coronavirus in Wuhan, China. Lancet (2020) 395:497–506. doi: 10.1016/S0140-6736(20)30183-5 - DOI - PMC - PubMed
    1. C.C.f.D.C. Epidemiology Working Group for Ncip Epidemic Response, and Prevention . The Epidemiological Characteristics of an Outbreak of 2019 Novel Coronavirus Diseases (COVID-19) in China. Zhonghua Liu Xing Bing Xue Za Zhi (2020) 41:145–51. doi: 10.3760/cma.j.issn.0254-6450.2020.02.003 - DOI - PubMed
    1. Totura AL, Baric RS. SARS Coronavirus Pathogenesis: Host Innate Immune Responses and Viral Antagonism of Interferon. Curr Opin Virol (2012) 2:264–75. doi: 10.1016/j.coviro.2012.04.004 - DOI - PMC - PubMed

Publication types