. 2022 Jan 14:12:799896.
doi: 10.3389/fimmu.2021.799896. eCollection 2021.

Mitochondrial Dysfunction Associates With Acute T Lymphocytopenia and Impaired Functionality in COVID-19 Patients

Affiliations

Mitochondrial Dysfunction Associates With Acute T Lymphocytopenia and Impaired Functionality in COVID-19 Patients

Yufei Mo et al. Front Immunol. .

Abstract

Severe acute respiratory syndrome coronavirus 2 (SARS-CoV-2) infection results in rapid T lymphocytopenia and functional impairment of T cells. The underlying mechanism, however, remains incompletely understood. In this study, we focused on characterizing the phenotype and kinetics of T-cell subsets with mitochondrial dysfunction (MD) by multicolor flow cytometry and investigating the association between MD and T-cell functionality. While 73.9% of study subjects displayed clinical lymphocytopenia upon hospital admission, a significant reduction of CD4 or CD8 T-cell frequency was found in all asymptomatic, symptomatic, and convalescent cases. CD4 and CD8 T cells with increased MD were found in both asymptomatic and symptomatic patients within the first week of symptom onset. Lower proportion of memory CD8 T cell with MD was found in severe patients than in mild ones at the stage of disease progression. Critically, the frequency of T cells with MD in symptomatic patients was preferentially associated with CD4 T-cell loss and CD8 T-cell hyperactivation, respectively. Patients bearing effector memory CD4 and CD8 T cells with the phenotype of high MD exhibited poorer T-cell responses upon either phorbol 12-myristate-13-acetate (PMA)/ionomycin or SARS-CoV-2 peptide stimulation than those with low MD. Our findings demonstrated an MD-associated mechanism underlying SARS-CoV-2-induced T lymphocytopenia and functional impairment during the acute phase of infection.

Keywords: COVID-19; SARS-CoV-2; T-cell functionality; memory T cell; mitochondrial dysfunction (MD).


Conflict of interest statement

The authors declare that the research was conducted in the absence of any commercial or financial relationships that could be construed as a potential conflict of interest.

Figures

Figure 1
Figure 1
T-cell subsets in asymptomatic and symptomatic donors are characterized by increased production of dysfunctional mitochondria during SARS-CoV-2 acute infection. Fresh peripheral blood mononuclear cells (PBMCs) of 88 SARS-CoV-2 acute patients (APs), 17 convalescent patients (CPs), and 31 healthy donors (HDs) were collected and profiled using flow cytometry in at least three independent experiments. (A) Representative plots showed the gating strategy on different T-cell subsets and cells with mitochondrial dysfunction (MD+) based on fluorescence minus one (FMO) control in FACS analysis. (B) The frequency of total T cells, CD4 T cells, and CD8 T cells and (C) the percentage of MD+ cells in total T cells, CD4 T cells, and CD8 T cells were compared among different groups based on disease severity compared to HDs and CPs. For symptomatic patients, (D) the frequency of total T cells, CD4 T cells, and CD8 T cells and (E) the percentage of MD+ cells in total T cells, CD4 T cells, and CD8 T cells along disease development were compared between mild and severe APs. HDs (in gray) served as negative control. Data represent mean ± SEM. Statistics were calculated based on one-way ANOVA test. *p < 0.05, **p < 0.01, ***p < 0.001. (F) The correlation between cell frequency and the percentage of MD+ cells in T-cell subsets from mild or severe APs during all time periods was calculated by Pearson’s correlation coefficient analysis. The correlation between cell frequency and the percentage of MD+ cells in T-cell subsets from mild or severe APs during the period of 6–10 days (G) or 11–15 days (H) post symptom onset (p.s.o.) was also calculated by Pearson correlation coefficient analysis.
Figure 2
Figure 2
Higher percentage of MD+ cells is found in memory CD8 T cell from mild patients than severe patients at 11-15 days p.s.o. during SARS-CoV-2 infection. Eighty-eight SARS-CoV-2 acute patients (APs) were collected for data analysis on T-cell subsets among cells with mitochondrial dysfunction (MD+) using flow cytometry in at least three independent experiments. (A) Representative plots showed the gating strategy on Naive T (CD45RA+CCR7+), central memory T (TCM, CD45RA-CCR7+), effector memory T (TEM, CD45RA-CCR7-), and effector memory T-cell re-expressing CD45RA (TEMRA, CD45RA+CCR7-) from MD+ CD4 or CD8 T cells. (B) The average proportions of different T-cell subsets in MD+ CD4 T-cell and CD8 T-cell subsets were calculated and displayed (number represents mean) in pie charts. Seventy-three SARS-CoV-2 APs [47 mild (M) and 26 severe (S) ones; only one mild AP on Day 16 post symptoms onset (p.s.o.) was excluded for statistical analysis] were collected for data analysis on MD+ cells in various T-cell subsets using flow cytometry in at least three independent experiments. (C) Representative plots showed the gating strategy on MD+ cells from Naive T, TCM, TEM, and TEMRA subsets from CD4 or CD8 T cells. (D) The percentages of MD+ cells in Naive T, TCM, TEM, and TEMRA subsets from CD4 T cells and CD8 T cells along disease development were compared between mild and severe APs. Data represent mean ± SEM. Statistics were calculated based on unpaired Student’s t-test. *p < 0.05.
Figure 3
Figure 3
High mitochondrial reactive oxygen species (ROS) level and intracellular calcium level are found in memory CD4 or CD8 T cells at 11-15 days p.s.o. during SARS-CoV-2 infection. Seventeen SARS-CoV-2 acute patients [APs; 8 mild (M) and 9 severe (S) ones on Day 11–15 post symptom onset (p.s.o.)] and 18 healthy donors (HDs) were collected for FACS analysis in at least three independent experiments. (A) Representative plots showed the gating strategy on MitoSOX+ cells and Fluo-4FF+ cells among memory CD4 or CD8 T cells. The percentages of MitoSOX+ cells (B) and Fluo-4FF+ cells (C) in CD4 TCM, CD4 TEM, CD8 TCM, and CD8 TEM cells from mild and severe APs on Day 11–15 p.s.o. were displayed in bar charts. HDs served as control. Data represent mean ± SEM. Statistics were calculated based on one-way ANOVA test. *p < 0.05, **p < 0.01, ***p < 0.001.
Figure 4
Figure 4
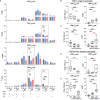
Memory CD4 or CD8 T cells with increased level of T-cell hyperactivation exhibit higher MD+ proportion at 11-15 days p.s.o. during SARS-CoV-2 infection. In order to understand the relationship between cells with mitochondrial dysfunction (MD+) and T-cell activation in COVID-19 patients, 17 SARS-CoV-2 acute patients [APs; 8 mild (M) and 9 severe (S) ones on Day 11–15 p.s.o.] and 18 healthy donors (HDs) were collected for FACS analysis in at least three independent experiments. (A) Representative plots showed the gating strategy on HLA-DR+CD38+ and PD-1+ cells among central memory (CM) or effector memory (EM) subsets in CD4 or CD8 T cells. (B) The percentages of HLA-DR+CD38+ and PD-1+ cells in CD4 TCM, CD4 TEM, CD8 TCM, and CD8 TEM cells from mild and severe APs on Day 11–15 p.s.o. were displayed in bar charts. HDs served as control. (C) To investigate the relationship between MD+ proportion and T-cell activation, the percentages of HLA-DR+CD38+ cells and MD+ proportion in CD4 TCM, CD4 TEM, CD8 TCM, and CD8 TEM cells were compared between patients with a high percentage of HLA-DR+CD38+ cells (higher than median) and those with a low percentage of HLA-DR+CD38+ cells (not higher than median). (D) Similarly, the percentages of PD-1+ cells and MD+ proportion in CD4 TCM, CD4 TEM, CD8 TCM, and CD8 TEM cells were compared between patients with high percentage of PD-1+ cells (higher than median) and those with low percentage of PD-1+ cells (not higher than median). HDs served as control. Data represent mean ± SEM. Statistics were calculated based on one-way ANOVA test. *p < 0.05, **p < 0.01, ***p < 0.001. NS, not significantly different.
Figure 5
Figure 5
Patients with impaired functionality in effector memory T cells have high MD+ proportion. In order to understand the relationship between cells with mitochondrial dysfunction (MD+) and phorbol 12-myristate-13-acetate (PMA)-stimulated T-cell responses in COVID-19 patients at the later stage of infection, 13 SARS-CoV-2 acute patients [APs; 8 mild (M) and 5 severe (S) on Day 11–15 post symptom onset (p.s.o.)] and 18 healthy donors (HDs) were collected for polyfunctional analysis in at least three independent experiments. Fresh peripheral blood mononuclear cells (PBMCs) from these 13 recruited APs were treated with PMA/ionomycin in the presence of brefeldin A (BFA) for 6 h. PBMCs from 18 HDs served as control. Cells were then harvested for FACS analysis on intracellular expression of TNFα, IFNγ, and IL-2. BFA-treated only cells served as negative control. (A) The percentages of TNFα+/-IFNγ+/-IL2+/- cells in CD4 TCM, CD4 TEM, CD8 TCM, and CD8 TEM cells were displayed in bar charts. The groups of TNFα+/-IFNγ+/-IL2+/- cells [labeled with (B–E) in cycle] with significant changes in APs were selected for further comparison as shown in the corresponding figures (B–E). The percentage of certain cytokine expression groups and profile of MD+ proportion in CD4 TEM, CD8 TCM, and CD8 TEM cells were compared between patients with highly cytokine-expressed cells (higher than median) and those with impaired cytokine-expressed cells (not higher than median). Data represent mean ± SEM. Statistics were calculated based on one-way ANOVA test. *p < 0.05, **p < 0.01, ***p < 0.001.
Figure 6
Figure 6
Patients with poor SARS-CoV-2-specific responses in effector memory CD4 T cells show significantly higher MD+ proportion. In order to understand the relationship between cells with mitochondrial dysfunction (MD+) and SARS-CoV-2-specific T-cell responses in COVID-19 patients, 25 SARS-CoV-2 acute patients [APs; 18 mild (M) and 7 severe (S) ones during time periods of 6–10 and 11–15 days post symptoms onset (p.s.o.)] were collected for antigen-specific response assessment in at least three independent experiments. Fresh peripheral blood mononuclear cells (PBMCs) were treated with 1 µg/ml spike peptide pool or 5 µg/ml purified nucleocapsid protein (NP) peptide pool in the presence of 0.5 µg/ml anti-CD28 and anti-CD49d antibodies overnight. Brefeldin A (BFA) was added 6 h before cells were harvested for FACS analysis on intracellular IFNγ level. (A) Representative plots displayed gating strategy on IFNγ+ cells among central memory (CM) or effector memory (EM) subsets in CD4 or CD8 T cells in response to spike or NP. (B) For these 25 patients, the percentages of IFNγ+ cells in CD4 TCM, CD4 TEM, CD8 TCM, or CD8 TEM cells in response to spike (in purple) or NP (in orange) were displayed in stacked bar chart. Each column represents one individual. Data represent the exact value. (C) The percentages of IFNγ+ cells and MD+ cells in CD4 TCM, CD4 TEM, CD8 TCM, or CD8 TEM cells from these 25 patients during the time period of 6–15 days p.s.o. were also compared between poor responders (-) and good responders (+) specific to spike or NP peptide pool. Data represent mean ± SEM. Statistics were calculated based on unpaired Student’s t-test. *p < 0.05, **p < 0.01, ***p < 0.001. NS, not significantly different.

References

    1. Zhu N, Zhang D, Wang W, Li X, Yang B, Song J, et al. . A Novel Coronavirus From Patients With Pneumonia in China, 2019. N Engl J Med (2020) 382(8):727–33. doi: 10.1056/NEJMoa2001017 - DOI - PMC - PubMed
    1. WHO Coronavirus (COVID-19) Dashboard: World Health Organization (2021). Available at: https://covid19.who.int/ (Accessed updated June 15).
    1. Chan JF, Yuan S, Kok KH, To KK, Chu H, Yang J, et al. . A Familial Cluster of Pneumonia Associated With the 2019 Novel Coronavirus Indicating Person-to-Person Transmission: A Study of a Family Cluster. Lancet (Lond Engl) (2020) 395(10223):514–23. doi: 10.1016/s0140-6736(20)30154-9 - DOI - PMC - PubMed
    1. Rothe C, Schunk M, Sothmann P, Bretzel G, Froeschl G, Wallrauch C, et al. . Transmission of 2019-Ncov Infection From an Asymptomatic Contact in Germany. N Engl J Med (2020) 382(10):970–1. doi: 10.1056/NEJMc2001468 - DOI - PMC - PubMed
    1. Guan WJ, Ni ZY, Hu Y, Liang WH, Ou CQ, He JX, et al. . Clinical Characteristics of Coronavirus Disease 2019 in China. N Engl J Med (2020) 382(18):1708–20. doi: 10.1056/NEJMoa2002032 - DOI - PMC - PubMed

Publication types

MeSH terms