

N6-Methyladenosine-Related LncRNAs Are Potential Remodeling Indicators in the Tumor Microenvironment and Prognostic Markers in Osteosarcoma
- PMID: 35095893
- PMCID: PMC8790065
- DOI: 10.3389/fimmu.2021.806189
N6-Methyladenosine-Related LncRNAs Are Potential Remodeling Indicators in the Tumor Microenvironment and Prognostic Markers in Osteosarcoma
Abstract
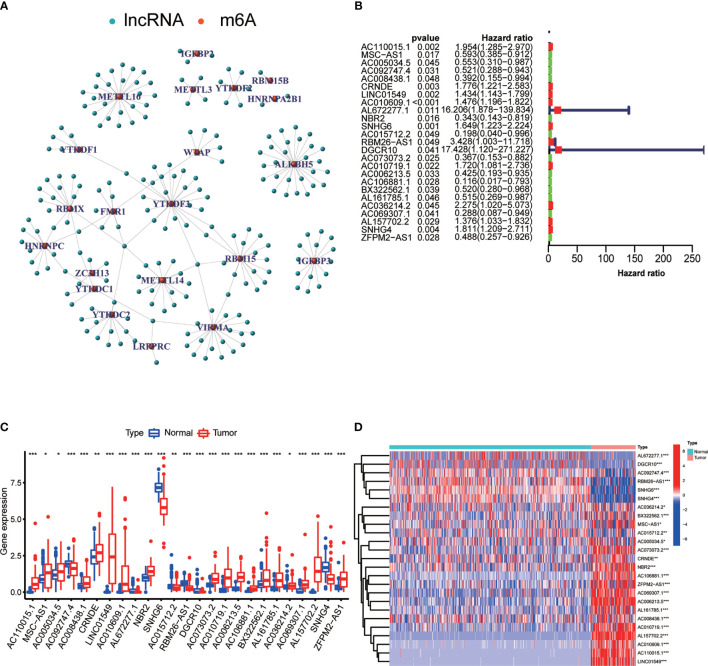
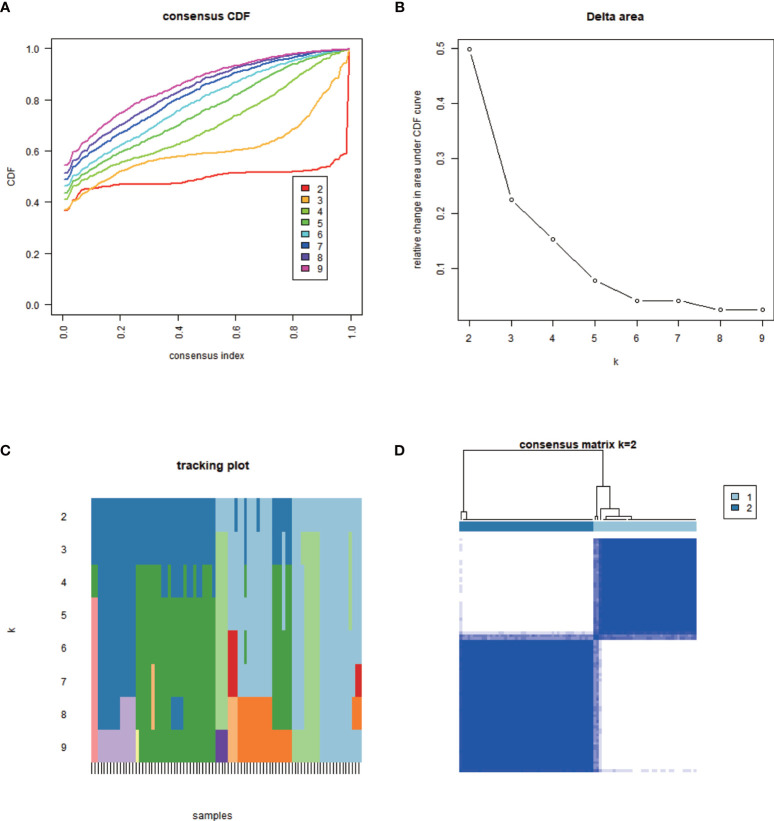
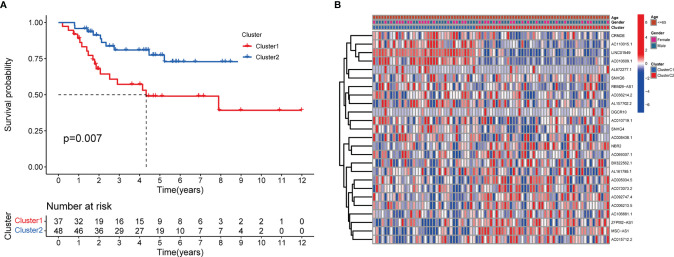
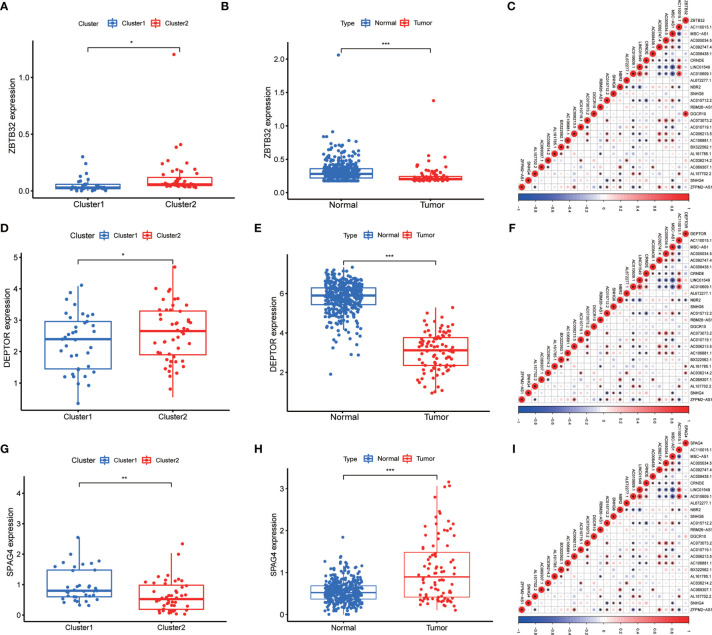
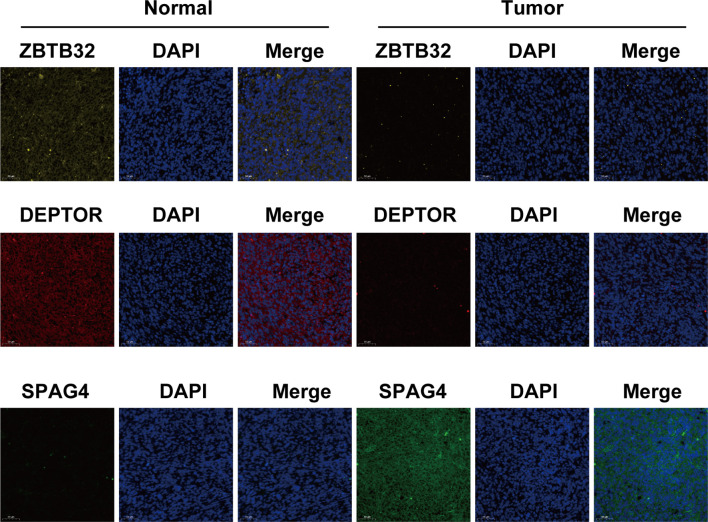
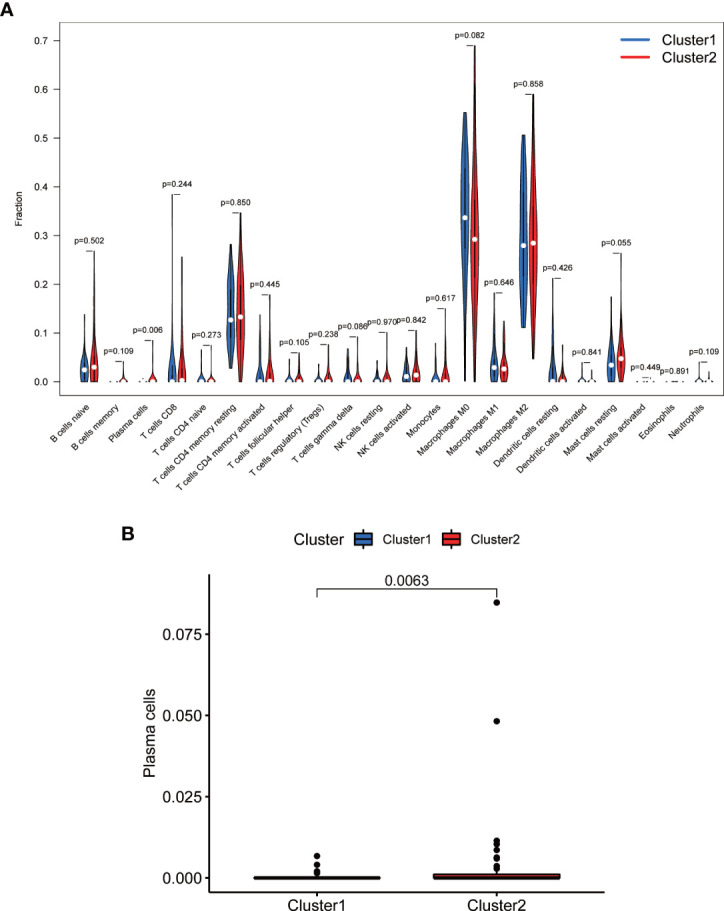
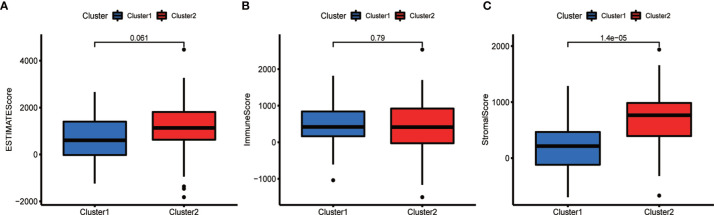
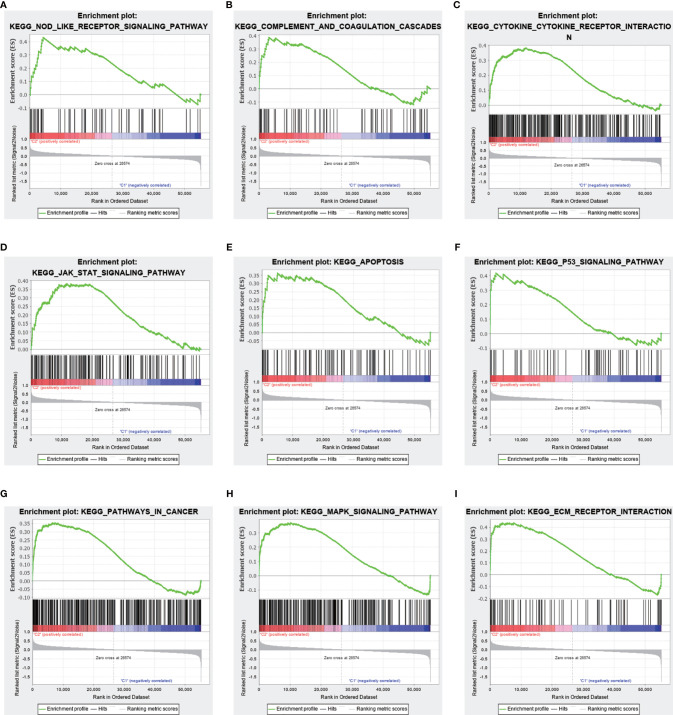
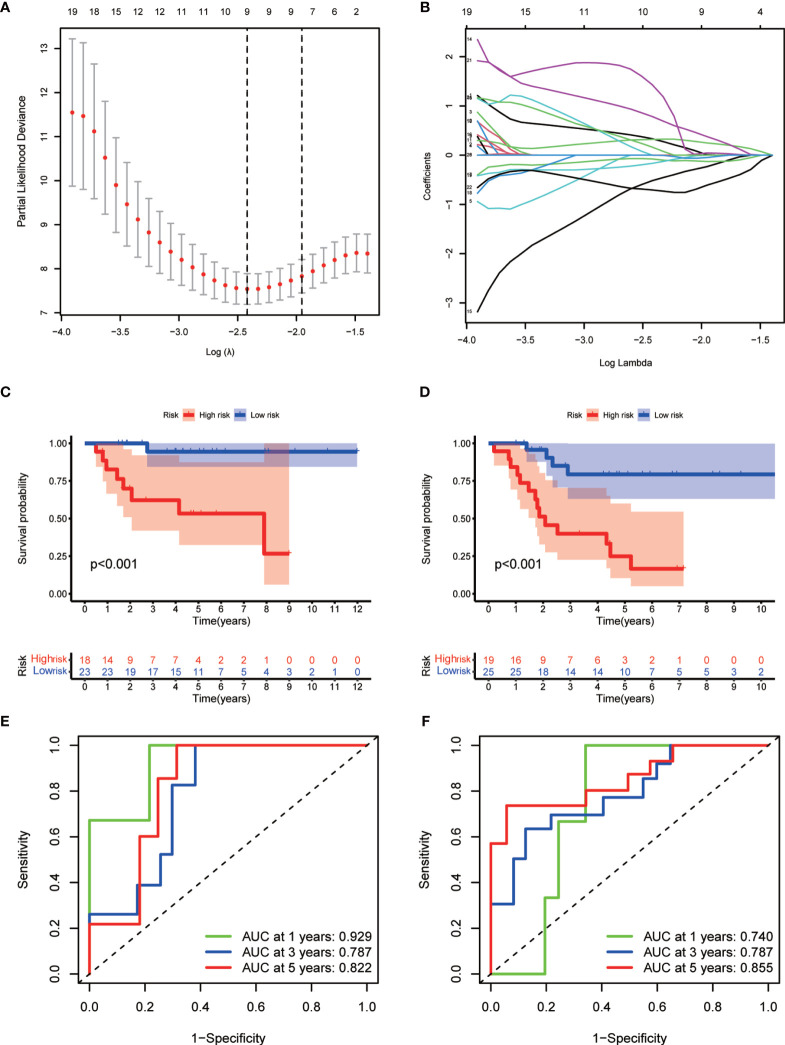
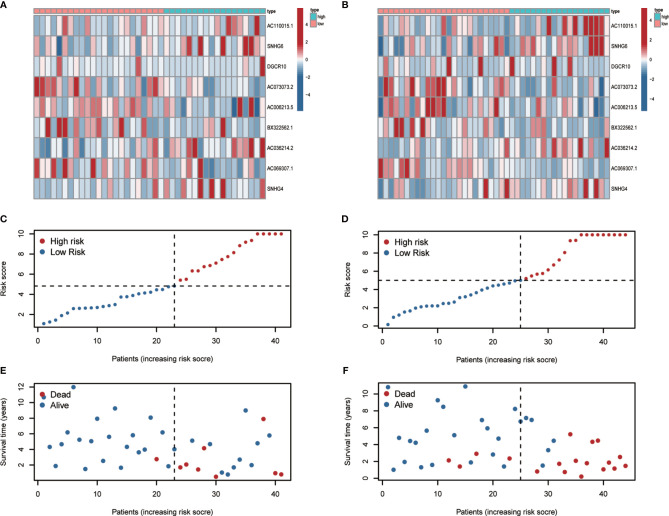
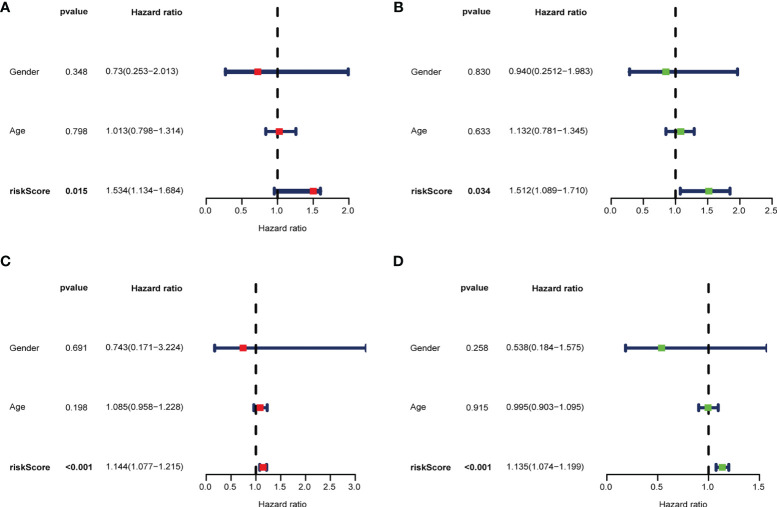
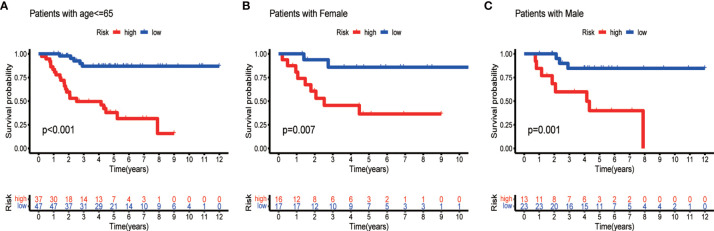
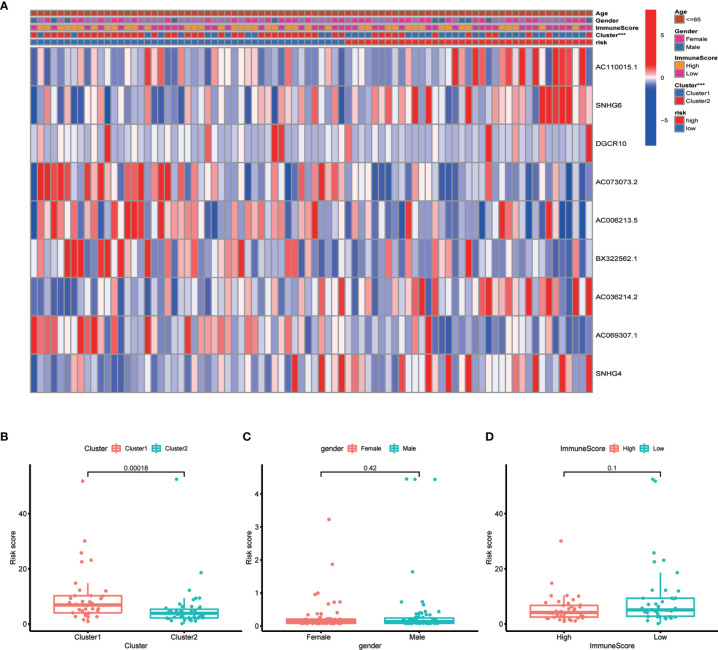
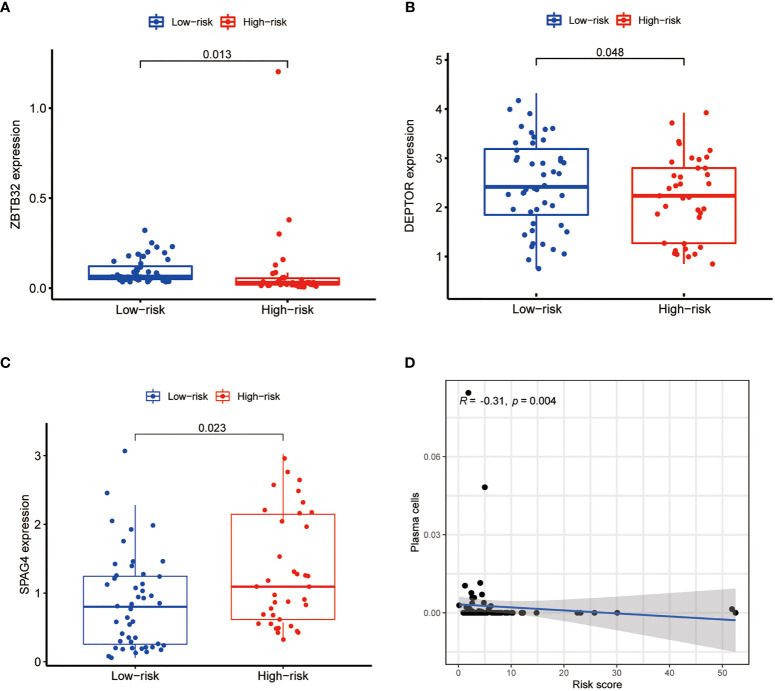
N6-Adenosine methylation, yielding N6-methyladenosine (m6A), is a reversible epigenetic modification found in messenger RNAs and long non-coding RNAs (lncRNAs), which affects the fate of modified RNA molecules and is essential for the development and differentiation of immune cells in the tumor microenvironment (TME). Osteosarcoma (OS) is the most common primary bone tumor in children and adolescents, and is characterized by high mortality. Currently, the possible role of m6A modifications in the prognosis of OS is unclear. In the present study, we investigated the correlation between m6A-related lncRNA expression and the clinical outcomes of OS patients via a comprehensive analysis. Clinical and workflow-type data were obtained from the Genotype-Tissue Expression Program and The Cancer Genome Atlas. We examined the relationship between m6A modifications and lncRNA expression, conducted Kyoto Encyclopedia of Genes analysis and also gene set enrichment analysis (GSEA), implemented survival analysis to investigate the association of clinical survival data with the expression of m6A-related lncRNAs, and utilized Lasso regression to model the prognosis of OS. Furthermore, we performed immune correlation analysis and TME differential analysis to investigate the infiltration levels of immune cells and their relationship with clinical prognosis. LncRNA expression and m6A levels were closely associated in co-expression analysis. The expression of m6A-related lncRNAs was quite low in tumor tissues; this appeared to be a predicting factor of OS in a prognostic model, independent of other clinical features. The NOD-like receptor signaling pathway was the most significantly enriched pathway in GSEA. In tumor tissues, SPAG4 was overexpressed while ZBTB32 and DEPTOR were downregulated. Tissues in cluster 2 were highly infiltrated by plasma cells. Cluster 2 presented higher ESTIMATE scores and stromal scores, showing a lower tumor cell purity in the TME. In conclusion, m6A-related lncRNA expression is strongly associated with the occurrence and development of OS, and can be used to as a prognostic factor of OS. Moreover, m6A-related lncRNAs and infiltrating immune cells in the TME could serve as new therapeutic targets and prognostic biomarkers for OS.
Keywords: N6-methyladenosine (m6A); epigenetic; long non-coding RNAs (lncRNAs); osteosarcoma; plasma cell; tumor microenvironment.
Copyright © 2022 Wu, Zhang, Chen, Li, Wu, Wang and Deng.
Conflict of interest statement
The authors declare that the research was conducted in the absence of any commercial or financial relationships that could be construed as a potential conflict of interest.
Figures
Similar articles
-
Comprehensive analysis of N6-methyladenosine -related long non-coding RNAs and immune cell infiltration in hepatocellular carcinoma.Bioengineered. 2021 Dec;12(1):1708-1724. doi: 10.1080/21655979.2021.1923381. Bioengineered. 2021. PMID: 33955330 Free PMC article.
-
N6-methyladenosine Modification-Related Long Non-Coding RNAs are Potential Biomarkers for Predicting the Prognosis of Patients With Osteosarcoma.Technol Cancer Res Treat. 2022 Jan-Dec;21:15330338221085354. doi: 10.1177/15330338221085354. Technol Cancer Res Treat. 2022. PMID: 35422168 Free PMC article.
-
Construction of an N6-methyladenosine lncRNA- and immune cell infiltration-related prognostic model in colorectal cancer.Protoplasma. 2022 Jul;259(4):1029-1045. doi: 10.1007/s00709-021-01718-x. Epub 2021 Nov 3. Protoplasma. 2022. PMID: 34734333
-
Research progress on N6-methyladenosine RNA modification in osteosarcoma: functions, mechanisms, and potential clinical applications.Med Oncol. 2025 Jan 24;42(3):55. doi: 10.1007/s12032-024-02597-x. Med Oncol. 2025. PMID: 39853585 Review.
-
N6-methyladenosine (m6A) modification in osteosarcoma: expression, function and interaction with noncoding RNAs - an updated review.Epigenetics. 2023 Dec;18(1):2260213. doi: 10.1080/15592294.2023.2260213. Epub 2023 Sep 28. Epigenetics. 2023. PMID: 37766615 Free PMC article. Review.
Cited by
-
T cell receptor signaling pathway subgroups and construction of a novel prognostic model in osteosarcoma.Heliyon. 2024 Dec 12;11(1):e41191. doi: 10.1016/j.heliyon.2024.e41191. eCollection 2025 Jan 15. Heliyon. 2024. PMID: 39811323 Free PMC article.
-
Novel insights into the multifaceted roles of m6A-modified LncRNAs in cancers: biological functions and therapeutic applications.Biomark Res. 2023 Apr 17;11(1):42. doi: 10.1186/s40364-023-00484-7. Biomark Res. 2023. PMID: 37069649 Free PMC article. Review.
-
CEMIP Promotes Osteosarcoma Progression and Metastasis Through Activating Notch Signaling Pathway.Front Oncol. 2022 Jul 26;12:919108. doi: 10.3389/fonc.2022.919108. eCollection 2022. Front Oncol. 2022. PMID: 35957875 Free PMC article.
-
Integrated analysis of single-cell and bulk transcriptomics reveals cellular subtypes and molecular features associated with osteosarcoma prognosis.BMC Cancer. 2025 Feb 17;25(1):280. doi: 10.1186/s12885-025-13714-y. BMC Cancer. 2025. PMID: 39962461 Free PMC article.
-
Exploring gene biomarkers and targeted drugs for ferroptosis and cuproptosis in osteosarcoma: A bioinformatic approach.Environ Toxicol. 2025 Jun;40(6):891-901. doi: 10.1002/tox.24250. Epub 2024 Mar 28. Environ Toxicol. 2025. PMID: 38546286 Free PMC article.
References
Publication types
MeSH terms
Substances
LinkOut - more resources
Full Text Sources