

Gallic Acid Alleviates Gut Dysfunction and Boosts Immune and Antioxidant Activities in Puppies Under Environmental Stress Based on Microbiome-Metabolomics Analysis
- PMID: 35095912
- PMCID: PMC8795593
- DOI: 10.3389/fimmu.2021.813890
Gallic Acid Alleviates Gut Dysfunction and Boosts Immune and Antioxidant Activities in Puppies Under Environmental Stress Based on Microbiome-Metabolomics Analysis
Abstract
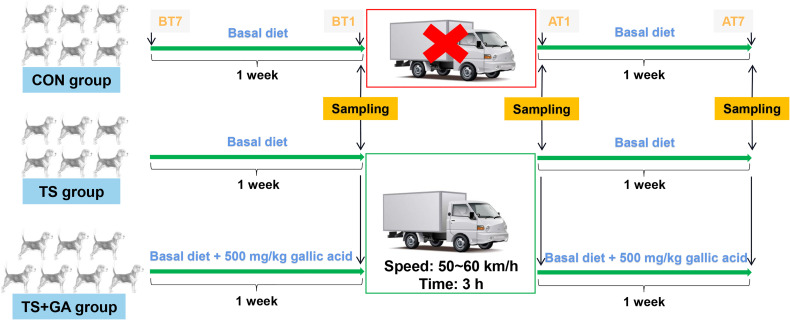
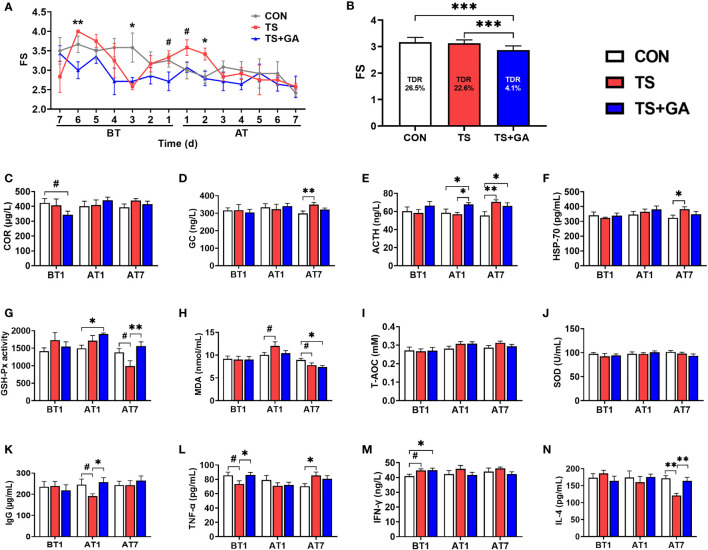
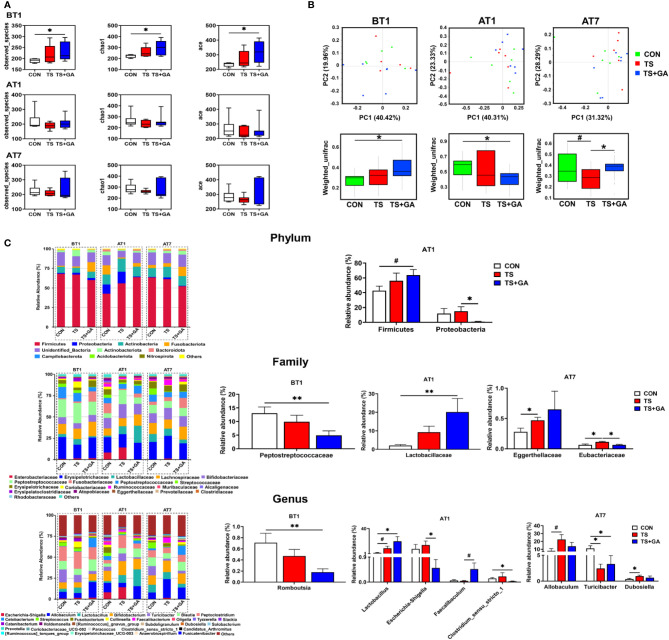
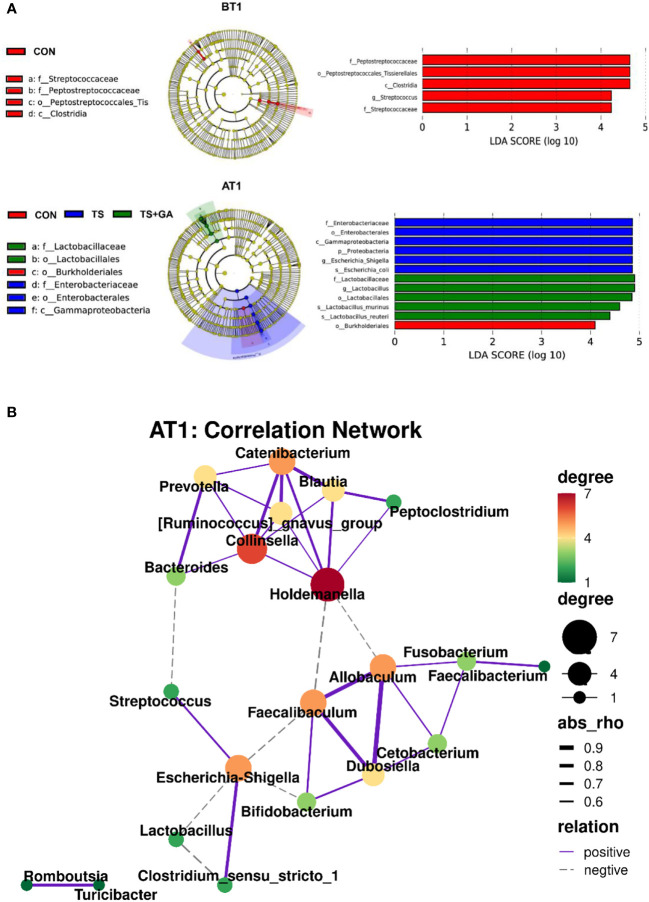
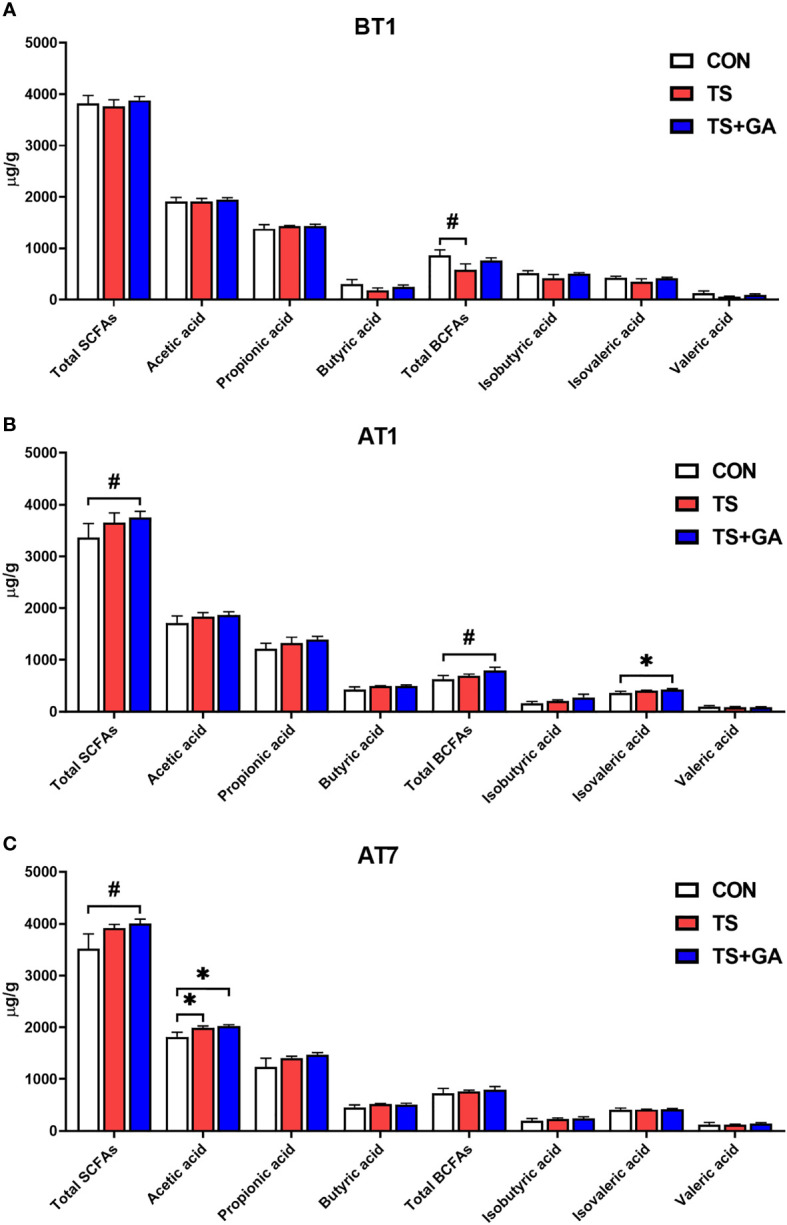
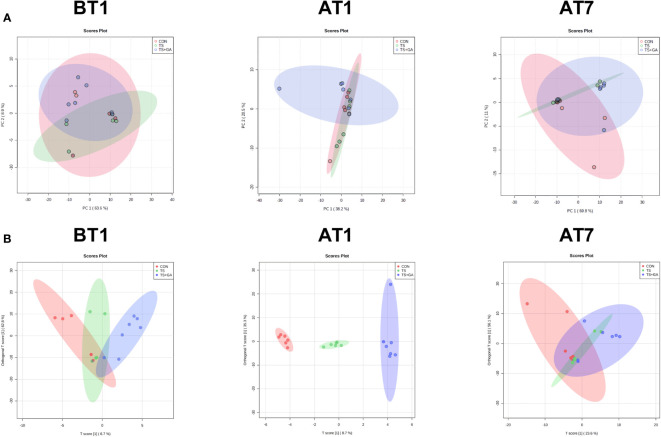
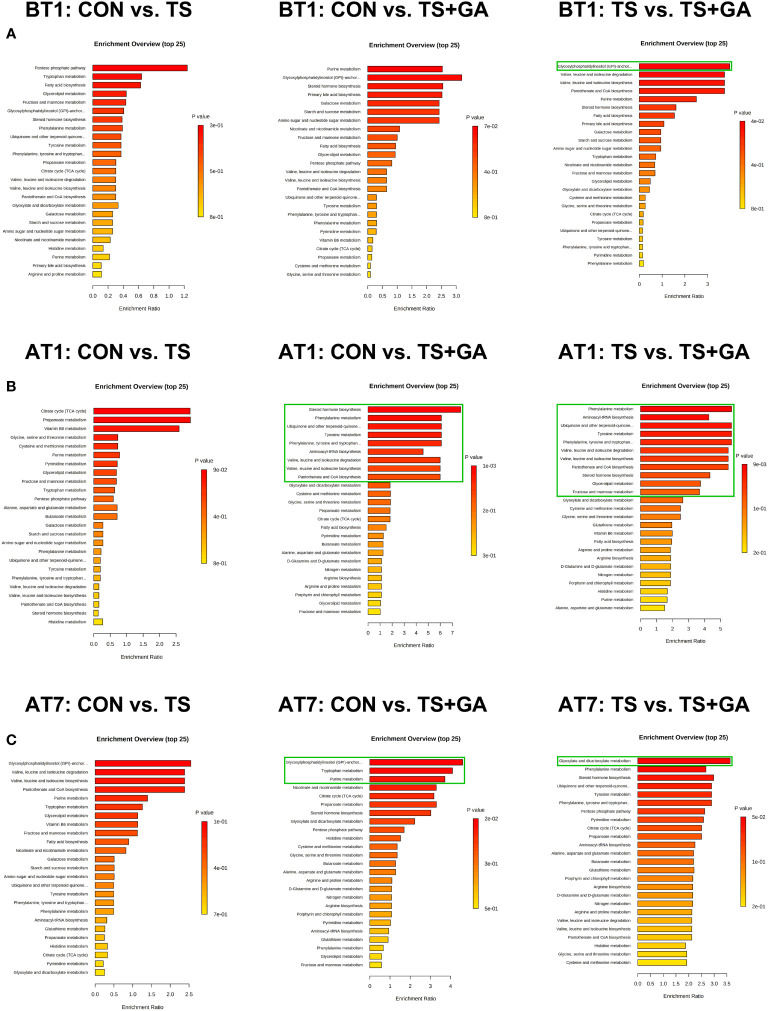
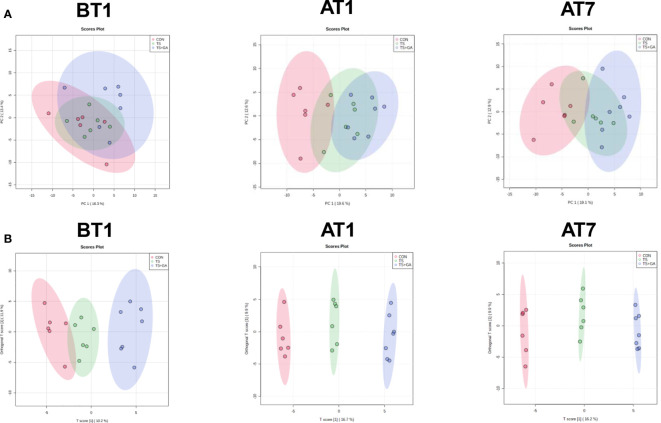
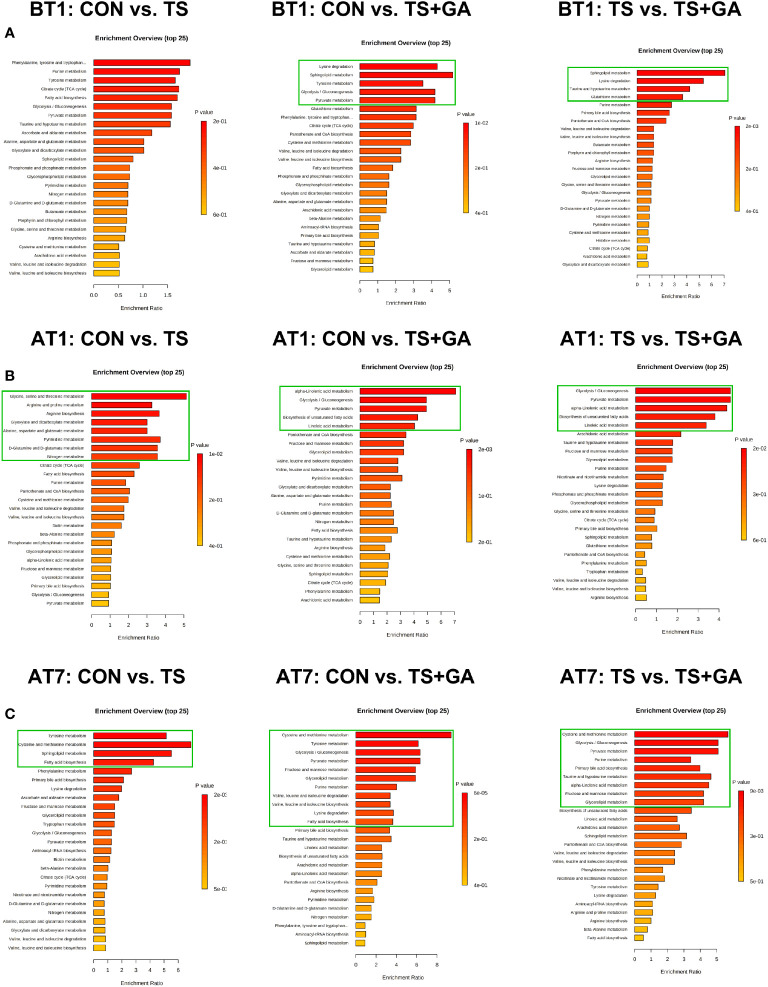
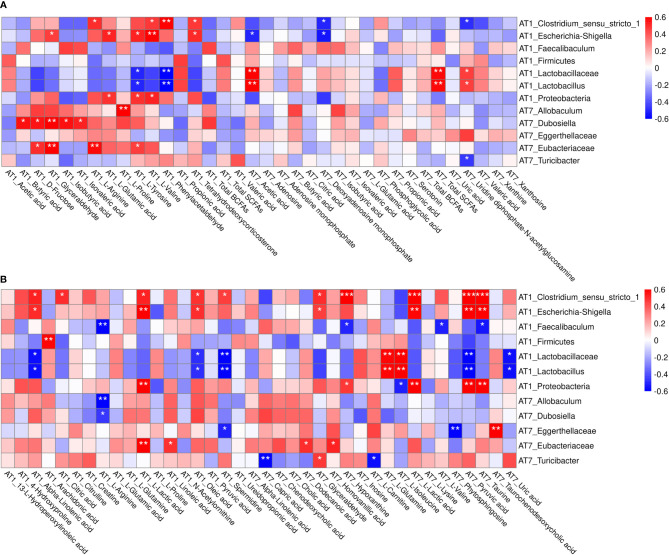
Early-life exposure to environmental stress disrupts the gut barrier and leads to inflammatory responses and changes in gut microbiota composition. Gallic acid (GA), a natural plant polyphenol, has received significant interest for its antioxidant, anti-inflammatory, and antimicrobial properties that support the maintenance of intestinal health. To assess whether dietary supplementation of GA alleviates environmental stress, a total of 19 puppies were randomly allocated to the following three dietary treatments for 2 weeks: 1) basal diet (control (CON)); 2) basal diet + transportation (TS); and 3) basal diet with the addition of 500 mg/kg of GA + transportation (TS+GA). After a 1-week supplementation period, puppies in the TS and TS+GA groups were transported from a stressful environment to another livable location, and puppies in the CON group were then left in the stressful environment. Results indicated that GA markedly reduced the diarrhea rate in puppies throughout the trial period and caused a moderate decline of serum cortisol and HSP-70 levels after transportation. Also, GA alleviated the oxidative stress and inflammatory response caused by multiple environmental stressors. Meanwhile, puppies fed GA had a higher abundance of fecal Firmicutes and Lactobacillus and lower Proteobacteria, Escherichia-Shigella, and Clostridium_sensu_stricto_1 after transportation. As a result, the TS+GA group had the highest total short-chain fatty acids and acetic acid. Also, the fecal and serum metabolomics analyses revealed that GA markedly reversed the abnormalities of amino acid metabolism, lipid metabolism, carbohydrate metabolism, and nucleotide metabolism caused by stresses. Finally, Spearman's correlation analysis was carried out to explore the comprehensive microbiota and metabolite relationships. Overall, dietary supplementation of GA alleviates oxidative stress and inflammatory response in stressed puppies by causing beneficial shifts on gut microbiota and metabolites that may support gut and host health.
Keywords: antioxidant; environmental stress; gallic acid; inflammatory response; metabolomics; microbiome; puppy.
Copyright © 2022 Yang, Deng, Jian, Zhang, Wen, Xin, Zhang, Tong, Ye, Liao, Xiao, He, Zhang, Deng, Zhang and Deng.
Conflict of interest statement
AT is employed by Guangzhou Qingke Biotechnology Co., Ltd. The remaining authors declare that the research was conducted in the absence of any commercial or financial relationships that could be construed as a potential conflict of interest.
Figures
Similar articles
-
A holistic view of gallic acid-induced attenuation in colitis based on microbiome-metabolomics analysis.Food Funct. 2019 Jul 17;10(7):4046-4061. doi: 10.1039/c9fo00213h. Food Funct. 2019. PMID: 31225554
-
Ganoderic acid A from Ganoderma lucidum ameliorates lipid metabolism and alters gut microbiota composition in hyperlipidemic mice fed a high-fat diet.Food Funct. 2020 Aug 1;11(8):6818-6833. doi: 10.1039/d0fo00436g. Epub 2020 Jul 20. Food Funct. 2020. PMID: 32686808
-
Microbiome-metabolomic analysis of the impact of Zizyphus jujuba cv. Muzao polysaccharides consumption on colorectal cancer mice fecal microbiota and metabolites.Int J Biol Macromol. 2019 Jun 15;131:1067-1076. doi: 10.1016/j.ijbiomac.2019.03.175. Epub 2019 Mar 26. Int J Biol Macromol. 2019. PMID: 30926487
-
Factors Affecting Gut Microbiota of Puppies from Birth to Weaning.Animals (Basel). 2023 Feb 6;13(4):578. doi: 10.3390/ani13040578. Animals (Basel). 2023. PMID: 36830365 Free PMC article. Review.
-
Structural diversity, functional aspects and future therapeutic applications of human gut microbiome.Arch Microbiol. 2021 Nov;203(9):5281-5308. doi: 10.1007/s00203-021-02516-y. Epub 2021 Aug 17. Arch Microbiol. 2021. PMID: 34405262 Free PMC article. Review.
Cited by
-
Enhancing Rumen Fermentation and Bacteria Community in Sika Deer (Cervus nippon) through Varying Levels of Dragon Fruit Peel Polyphenolic Extract: An In Vitro Study.Animals (Basel). 2024 Apr 9;14(8):1139. doi: 10.3390/ani14081139. Animals (Basel). 2024. PMID: 38672287 Free PMC article.
-
Brevibacillus laterosporus BL1, a promising probiotic, prevents obesity and modulates gut microbiota in mice fed a high-fat diet.Front Nutr. 2022 Nov 24;9:1050025. doi: 10.3389/fnut.2022.1050025. eCollection 2022. Front Nutr. 2022. PMID: 36505236 Free PMC article.
-
Vitamins, Minerals and Phytonutrients as Modulators of Canine Immune Function: A Literature Review.Vet Sci. 2024 Dec 16;11(12):655. doi: 10.3390/vetsci11120655. Vet Sci. 2024. PMID: 39728995 Free PMC article. Review.
-
Maternal or post-weaning dietary fructo-oligosaccharide supplementation reduces stillbirth rate of sows and diarrhea of weaned piglets.Anim Nutr. 2024 Apr 8;17:155-164. doi: 10.1016/j.aninu.2024.04.002. eCollection 2024 Jun. Anim Nutr. 2024. PMID: 38774024 Free PMC article.
-
Protective effect of chicken yolk antibody Y against Campylobacter jejuni induced diarrhea in cats.Front Microbiol. 2024 Apr 9;15:1378029. doi: 10.3389/fmicb.2024.1378029. eCollection 2024. Front Microbiol. 2024. PMID: 38655089 Free PMC article.
References
Publication types
MeSH terms
Substances
LinkOut - more resources
Full Text Sources
Medical
Research Materials