. 2022 Jan 12:9:808095.
doi: 10.3389/fcell.2021.808095. eCollection 2021.

UCP1 Knockin Induces Lipid Dynamics and Transcriptional Programs in the Skeletal Muscles of Pigs

Affiliations

UCP1 Knockin Induces Lipid Dynamics and Transcriptional Programs in the Skeletal Muscles of Pigs

Ziye Xu et al. Front Cell Dev Biol. .

Abstract

Uncoupling protein 1 (UCP1), the hallmark protein responsible for nonshivering thermogenesis in adipose tissue (especially brown adipose tissue) has regained researchers' attention in the context of metabolic disorders following the realization that UCP1 can be activated in adult humans and reconstituted in pigs. Both skeletal muscle and adipose tissue are highly dynamic tissues that interact at the metabolic and hormonal level in response to internal and external stress, and they coordinate in maintaining whole-body metabolic homeostasis. Here, we utilized lipidomics and transcriptomics to identify the altered lipid profiles and regulatory pathways in skeletal muscles from adipocyte-specific UCP1 knock-in (KI) pigs. UCP1 KI changed the contents of glycerophospholipids and acyl carnitines of skeletal muscles. Several metabolic regulatory pathways were more enriched in the UCP1 KI skeletal muscle. Comparison of the transcriptomes of adipose and skeletal muscle suggested that nervous system or chemokine signaling might account for the crosstalk between these two tissues in UCP1 KI pigs. Comparison of the lipid biomarkers from UCP1 KI pigs and other mammals suggested associations between UCP1 KI-induced metabolic alternations and metabolic and muscle dysfunction. Our study reveals the lipid dynamics and transcriptional programs in the skeletal muscle of UCP1 KI pigs and suggests that a network regulates metabolic homeostasis between skeletal muscle and adipose tissue.

Keywords: UCP1-KI; adipose tissue; crosstalk; lipidomics; obesity; pig; skeletal muscle; transcriptome.


Conflict of interest statement

The authors declare that the research was conducted in the absence of any commercial or financial relationships that could be construed as a potential conflict of interest.

Figures

FIGURE 1
FIGURE 1
Changes in the overall lipid composition and distribution in skeletal muscle induced by adipocyte-specific expression of UCP1. Lipidomics analysis of skeletal muscle from UCP1 KI pigs. Lipids were extracted and analyzed as described in the Materials and Methods. (A) Distribution of lipid classes that were considered for subsequent analysis in all of the samples detected by LC-MS/MS. (B) Heatmap of the significantly altered lipids (p-value <0.05 and VIP >1) in skeletal muscle from controls and UCP1 KI pigs (n = 3). (C) Log2 fold changes in lipid species in the KI- versus WT- group, and the corresponding significance values are displayed as −log10 (p-value). Each dot represents a lipid species, and the dot size indicates significance. Only lipids with p < 0.05 are displayed (n = 3). (D) The lipid ion intensity of lipid groups, including glycerolipids, GLs, fatty acyls, sphingolipids, prenol lipids and saccharolipids. (E) The lipid ion intensity of significantly changed lipid classes, including SQDG, PG, LPG, LPC, CL and AcCa. Data are presented as the means ± SEM (n = 3). *p < 0.05, ***p < 0.001.
FIGURE 2
FIGURE 2
Adipocyte-specific UCP1 KI changed the composition of fatty acyl chains associated with GLs in skeletal muscle. (A–C) The total lipid ion intensity of individual fatty acyl chains associated with GLs sorted by degree of intensity. Data are presented as means ± SEM (n = 3). *p < 0.05, ***p < 0.001. (D) The total percentages of SFA chains, MUFA chains and PUFA chains associated with GLs. SAF, saturated fatty acyls; MUFA, monounsaturated fatty acyls; PUFA, polyunsaturated fatty acyls containing two or three to six double bonds. (E,F) The GL pattern in cold-treated cases versus that in controls. Each dot or triangle represents a distinct GL, organized along the x-axis based on the total acyl chain carbon number (E) or double bond content (F). The size of each dot or triangle is proportional to the significance values, which are displayed as −log10 (p-value). The different colors of each dot or triangle represent each lipid classes, including CL, LPC, LPE, LPG, LPI, LPS, PC, PE, PG, PI, and PS.
FIGURE 3
FIGURE 3
UCP1 KI changed the composition of fatty acyl chains associated with AcCas in skeletal muscle. (A) The top 10 AcCas according to the P-value, detected in skeletal muscle from UCP1 KI pigs and controls (n = 3). (B–D) The total lipidIon intensity of individual Fatty acyl chains associated with AcCas sorted by degree of intensity. (E) The total lipid ion intensity of SFA, MUFA and PUFA associated with AcCas. Data are presented as means ± SEM (n = 3). *p < 0.05, ***p < 0.001. (F,G) The AcCas pattern in cold-treated cases versus that in controls. Each dot or triangle represents a distinct AcCas, organized along the x axis based on total acyl chain carbon number (F) or double bond content (G). The size of each dot or triangle is proportional to the significance values, which are displayed as −log10 (p-value).
FIGURE 4
FIGURE 4
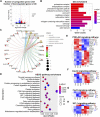
Alterations in skeletal muscle transcriptional profile by UCP1 KI. (A) Log2-fold changes in exons of RNA-seq gene bodies in skeletal muscle from UCP1 KI pigs versus controls and the corresponding significance values displayed as Log10 (p-value). The transverse and vertical dotted lines indicate the cutoff value for differential expression (p < 0.05 & Abs (Log2-fold changes) > 0.5). In total, 631 and 640 genes were identified that had induced (red) or repressed (blue) expression levels by cold exposure. (B) GO enrichment analysis and enriched terms were visualized by A bar plot. The bar color indicates significance, and the corresponding significance values are displayed as log10 (p-value). The bar length indicates significantly changed gene counts involved in certain categories. (C) The Cnetplot depicts the linkages of the five most enriched GO terms (proteasome complex, endopeptidase complex, proteasome regulatory particle, proteasome accessory complex and axon part) and genes involved in these terms as a network. The yellow dots indicate enriched GO terms and the size of each dot indicates gene counts involved in certain GO terms. These smaller dots indicate genes involved in these terms. The color of each smaller dot indicates log2(fold change) values genes in skeletal muscle from UCP1 KI pigs versus controls. (D) Functional enrichment analyses using KEGG pathways. The triangle size indicates gene counts. The dot color indicates significance and corresponding significance values displayed as log10 (p-value). (E–H) Heatmap of TPM expression values of metabolic pathways (including PI3K-Akt signaling pathway (E), insulin signaling pathway (F), FoxO signaling pathway (G) and HIF-1 signaling pathway (H))-regulated genes from the RNA-seq dataset. Only genes with p < 0.05 are displayed.
FIGURE 5
FIGURE 5
Comparison of significantly altered genes between adipose tissue and skeletal muscle from UCP1 KI pigs. (A) Venn diagram of the DEGs in adipose tissue and skeletal muscle between UCP1 KI pigs and WT pigs. (B) GO enrichment analysis of common DEGs was performed, and enriched terms were visualized by a bar plot. The bar color indicates significance and corresponding significance values displayed as log10 (p-value). The bar length indicates significantly changed gene counts involved in certain categories. (C,D) The Cnetplot depicts the linkages of the five most enriched GO terms and the genes involved in these terms as a network. The yellow dots indicate enriched GO terms and the size of each dot indicates gene counts involved in certain GO terms. These smaller dots indicate genes involved in these terms. The color of each smaller dot indicates log2(fold change) values genes in adipose (C) and skeletal muscle (D), from UCP1 KI pigs versus controls. (E) Venn diagram of upregulated and downregulated DEGs in adipose and skeletal muscle between UCP1 KI pigs and WT pigs. (F,G) Functional enrichment analyses using KEGG pathways of shared consistent DEGs and inconsistent DEGs.
FIGURE 6
FIGURE 6
Comparison of lipid biomarkers from UCP1 KI pigs and other mammals. (A) Venn diagram of significantly altered lipids in iWAT, backfat and skeletal muscle between UCP1 KI pigs and WT pigs. (B) Heatmap of Log2(fold change) values of common significantly altered lipids of iWAT, backfat and skeletal muscle from UCP1 KI pigs. Red indicates high (2) Log2(fold change) values and blue indicates low (−2) Log2(foldchange) value. (C) The colors of the circles indicate trends of skeletal muscle and plasma lipid features from several published sources (insulin resistance in human muscle (Tonks et al., 2016), low calorie diet in human muscle (Nylén et al., 2019), obesity in human muscle (Tonks et al., 2016), insulin resistance in human plasma(Tonks et al., 2016), obesity in human plasma (Tonks et al., 2016), polymyositis and dermatomyositis (PM/DM) in human serum (Raouf et al., 2018), dysferlin deficiency in mice muscle (Haynes et al., 2019), and PGC1α KI in mice muscle (Senoo et al., 2015) and of iWAT, backfat and skeletal muscle from UCP1 KI pigs. Red indicates lipid features that showed increased trends in tissues from UCP1 KI pigs, and green indicates those with decreased trends. Black dots denote lipid features that were undetected in the lipidomics results of tissues from UCP1 KI pigs. (D) Heatmap of Log2(foldchange) values of lipids between human skeletal muscle and iWAT, backfat and skeletal muscle from UCP1 KI pigs. Red indicates high (0.3) Log2(fold change) value and blue indicates low (−0.3) Log2(fold change) values.

References

    1. Aburasayn H., Al Batran R., Ussher J. R. (2016). Targeting Ceramide Metabolism in Obesity. Am. J. Physiol. Endocrinol. Metab. 311, E423–E435. 10.1152/ajpendo.00133.2016 - DOI - PubMed
    1. Aguer C., McCoin C. S., Knotts T. A., Thrush A. B., Ono‐Moore K., McPherson R., et al. (2015). Acylcarnitines: Potential Implications for Skeletal Muscle Insulin Resistance. FASEB J. 29, 336–345. 10.1096/fj.14-255901 - DOI - PMC - PubMed
    1. Alberti K. G. M. M., Zimmet P. Z. (1998). Definition, Diagnosis and Classification of Diabetes Mellitus and its Complications. Part 1: Diagnosis and Classification of Diabetes Mellitus. Provisional Report of a WHO Consultation. Diabet. Med. 15, 539–553. 10.1002/(sici)1096-9136(199807)15:7<539:aid-dia668>3.0.co;2-s - DOI - PubMed
    1. Argilés J. M., López-Soriano J., Almendro V., Busquets S., López-Soriano F. J. (2005). Cross-Talk Between Skeletal Muscle and Adipose Tissue: A Link with Obesity. Med. Res. Rev. 25, 49–65. 10.1002/med.20010 - DOI - PubMed
    1. Bal N. C., Maurya S. K., Singh S., Wehrens X. H., Periasamy M. (2016). Increased Reliance on Muscle-Based Thermogenesis upon Acute Minimization of Brown Adipose Tissue Function. J. Biol. Chem. 291, 17247–17257. 10.1074/jbc.M116.728188 - DOI - PMC - PubMed