. 2021 Jul:9:675638.
doi: 10.3389/fevo.2021.675638. Epub 2021 Jul 23.

Paracrine Behaviors Arbitrate Parasite-Like Interactions Between Tumor Subclones

Affiliations

Paracrine Behaviors Arbitrate Parasite-Like Interactions Between Tumor Subclones

Robert J Noble et al. Front Ecol Evol. 2021 Jul.

Abstract

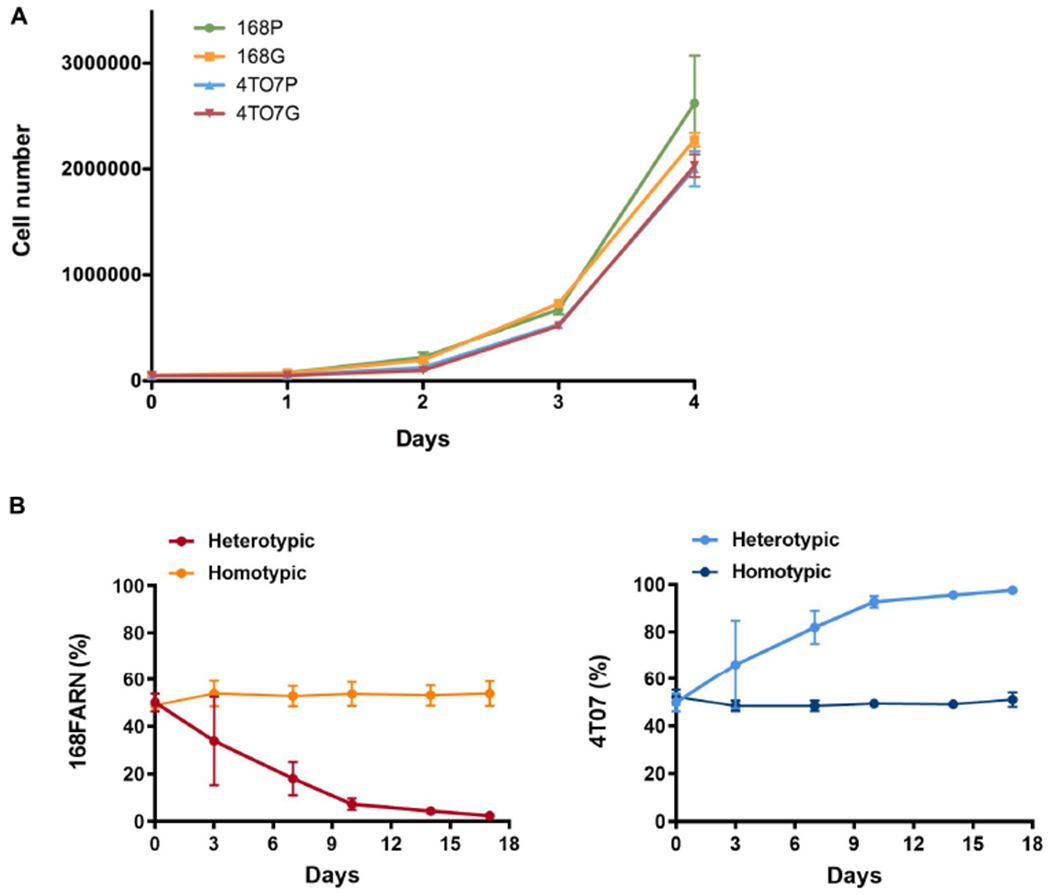
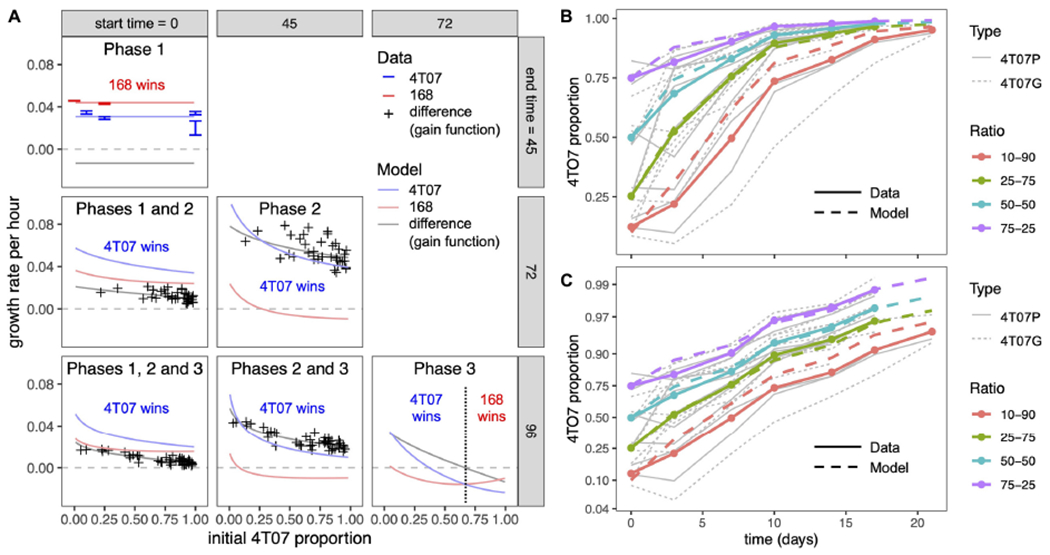
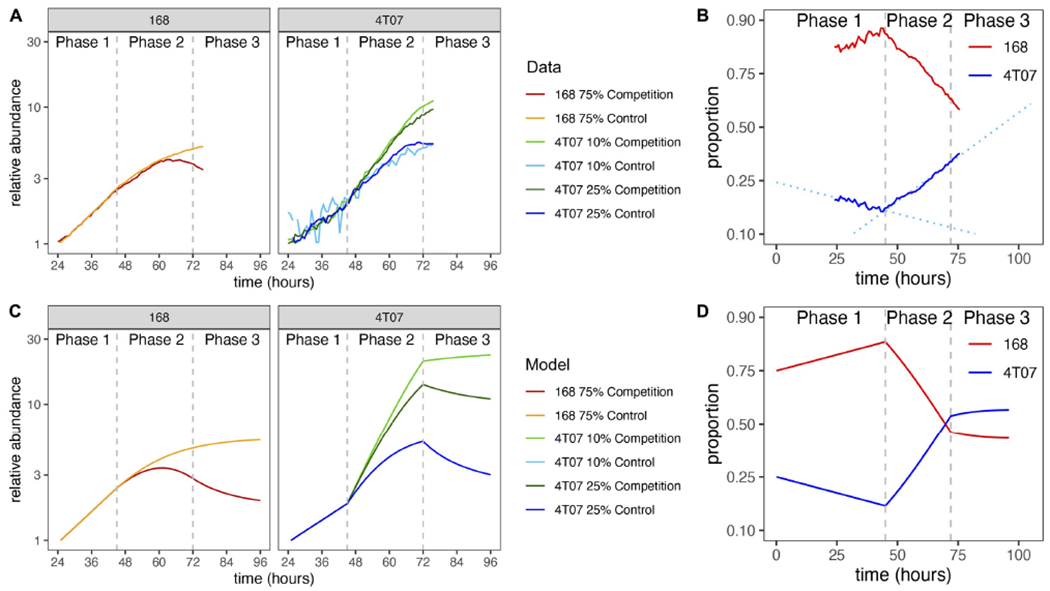
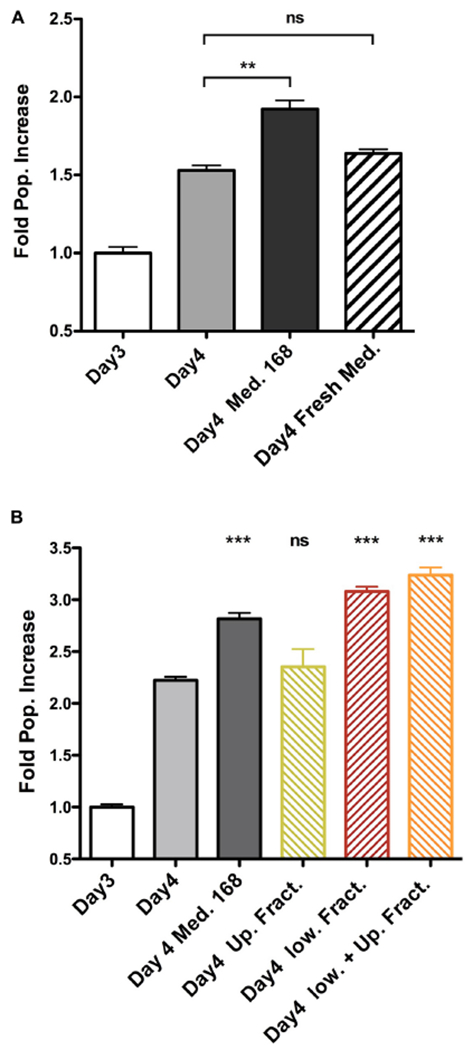
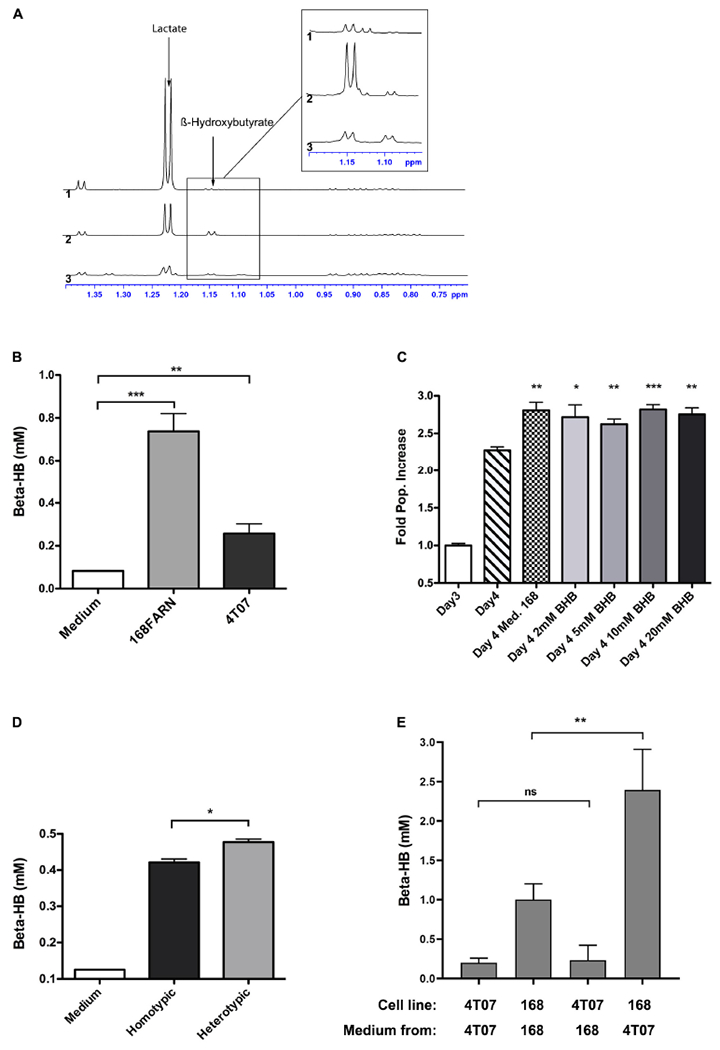
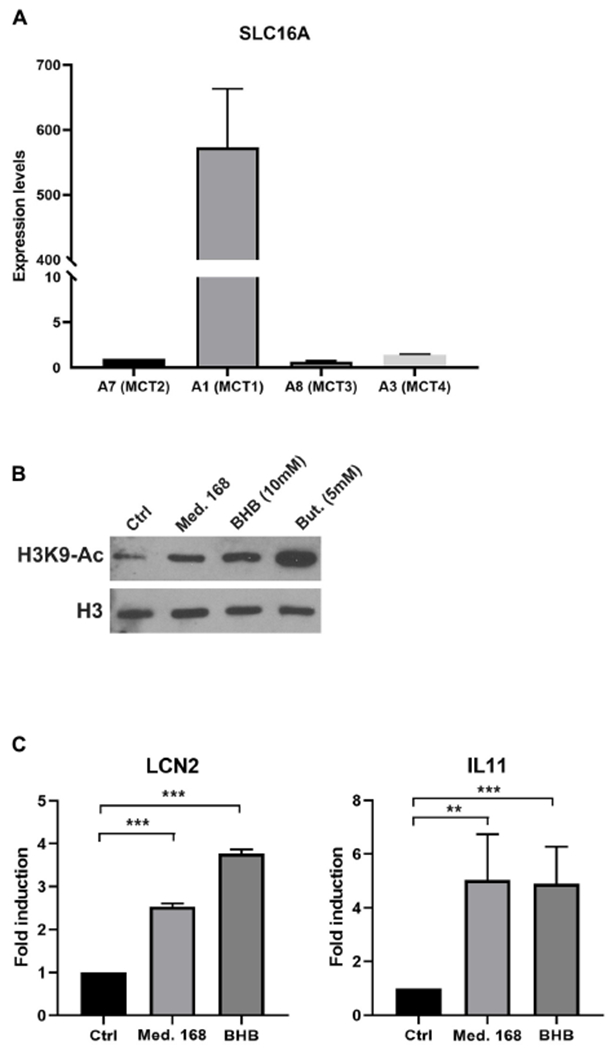
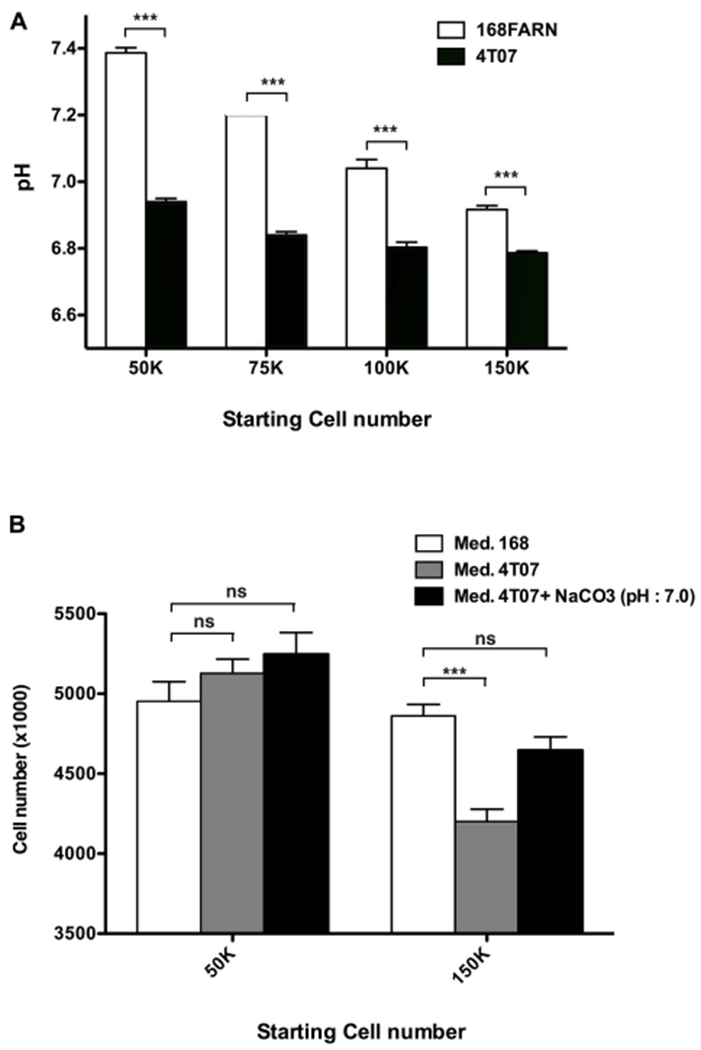
Explaining the emergence and maintenance of intratumor heterogeneity is an important question in cancer biology. Tumor cells can generate considerable subclonal diversity, which influences tumor growth rate, treatment resistance, and metastasis, yet we know remarkably little about how cells from different subclones interact. Here, we confronted two murine mammary cancer cell lines to determine both the nature and mechanisms of subclonal cellular interactions in vitro. Surprisingly, we found that, compared to monoculture, growth of the "winner" was enhanced by the presence of the "loser" cell line, whereas growth of the latter was reduced. Mathematical modeling and laboratory assays indicated that these interactions are mediated by the production of paracrine metabolites resulting in the winner subclone effectively "farming" the loser. Our findings add a new level of complexity to the mechanisms underlying subclonal growth dynamics.

Keywords: Lotka–Volterra model; beta-hydroxybutirate; cancer evolution; evolutionary game theory; intratumor clonal heterogeneity; lactate; paracrine signaling; parasitism.


Conflict of interest statement

Conflict of Interest: The authors declare that the research was conducted in the absence of any commercial or financial relationships that could be construed as a potential conflict of interest.

Figures

FIGURE 1 |
FIGURE 1 |
Mutual impacts on subclonal growth. (A) 168FARN and 4T07 parental cells were transduced either with an empty retroviral vector (168P and 4T07P) or with labeled with a GFP-encoding retrovirus (168G and 4T07G). Cells were seeded in triplicate in six-well plates at a density of 50,000 cells/well and cultured for the indicated times before harvesting and counting. (B) 105 Cells were seeded at a 1:1 ratio in homotypic (parental and GFP expressing derivative of the same cell line) or heterotypic (different cell lines, one expressing GFP) co-cultures and harvested and replated at the initial densities (105 cells/plate) at indicated times. The ratios of GFP-labeled to unlabeled cells were estimated by flow cytometry. The results represent data from three independent experiments and are shown as mean ± SEM.
FIGURE 2 |
FIGURE 2 |
Mean net growth rate differences according to mathematical model and experimental data. (A) Inferred mean net growth rates and mean net growth rate differences (gain functions) over different time periods, corresponding to different phases within competition assays. Columns correspond to different start times and rows to different end times of the phase(s) under consideration. For example, the center panel labeled “Phase 2” corresponds to the period between 45 and 72 h. The initial 4T07 proportion (horizontal axis) is measured at the start of the respective period and the growth rate (vertical axis) is averaged over the period. Phase 1 data are from time-lapse microscopy. Other data points in the first column are from serial competition assays, such that each point corresponds to the slope of a thin gray line in panel (B). Data points in the middle column are obtained from the competition assay data by adjusting for exponential growth during phase 1 (see section “Materials and Methods”). Curves are the results of our mathematical model (see section “Materials and Methods”) with parameter values inferred from data (Table 1). (B) 4T07 frequency dynamics across serial competition assays. Thick solid lines are averaged data (means of replicates with similar initial 4T07 proportions) and thick dashed lines are results of our mathematical model with parameter values inferred from data. Thin gray lines are data for individual experiments. A total of 105 cells were seeded in co-cultures and harvested and replated as indicated. 4T07 parental cells were transduced either with an empty retroviral vector (4T07P) or labeled with a GFP-encoding retrovirus (4T07G). The ratios of GFP to unlabeled cells were estimated by flow cytometry. (C) Logit-transformed 4T07 frequency dynamics. This panel shows the same data as panel (B) but with a logit-transformed vertical axis so that the slope of each curve is equal to the mean net growth rate difference (the gain function, as described in section “Materials and Methods” and Supplementary Figure 7).
FIGURE 3 |
FIGURE 3 |
Normalized growth curves of homotypic and heterotypic mixes of subclones. (A) The GFP fluorescence of the labeled subclone was measured by time-lapse microscopy. Cultures were seeded with 105 cells per well. Log-transformed data were normalized by fitting regression lines and dividing by the inferred value at 24 h. Vertical dashed lines mark the start of phase 2 (45 h) and phase 3 (72 h). (B) Frequency dynamics. Curves obtained by combining the results of two competition experiments: one with labeled 4T07 and the other with labeled 168. The initial 4T07 proportion was 25% in both cases. The vertical axis is logit-transformed so that the slope of each curve is equal to the difference in net growth rates at the corresponding time (see section “Materials and Methods”). Dotted regression lines are shown to draw attention to the change of slope. (C) Normalized growth curves according to mathematical model with parameter values inferred from data. The model is described in section “Materials and Methods” and parameter values are given in Table 1. (D) Frequency dynamics according to mathematical model with parameter values inferred from data.
FIGURE 4 |
FIGURE 4 |
Soluble factor secreted by 168FARN cells accelerates proliferation of the 4T07 cells. (A) 4T07 cells were grown for 3 days at which point their medium was either left unchanged, or replaced by either 168FARN-conditioned medium or fresh medium, as indicated. Cells were collected 24 h later and counted. Cell numbers at day 3 were arbitrarily set at 1 in order to include the data from three independent experiments. (B) The experiment was performed as in panel (A). but the medium conditioned by 168FARN cells was fractionated by membrane ultrafiltration with a 3 KDa molecular cutoff. After complementing the low and the high MW fractions, respectively, with 10% serum and DMEM, the media were used to grow the 4T07 cells, as in panel (A). The two fractions were also combined as a control. ns, not significant; **p < 0.01, ***p < 0.001, all compared to Day 4 point.
FIGURE 5 |
FIGURE 5 |
Identification of soluble metabolites altering the heterotypic growth dynamics. (A) Superimposition of the high-field region of representative 1D proton NMR spectra recorded at 700 MHz, 293 K and pH 7 on samples of culture media collected after growing 40T7 cells (1) or 168FARN cells (2) for 3 days or of fresh cell culture medium (3). The arrows indicate the characteristic resonance of lactate and β-hydroxybutyrate. The insert displays a zoom in this spectral region, revealing the H-alpha resonance of the β-hydroxybutyrate. For all spectra, peak intensities have been normalized on the intensity of the DSS resonance added as internal reference. (B) Concentration of β-hydroxybutyrate from fresh medium and from conditioned medium from 168FARN or 4T07 was quantified. (C) Commercially available β-hydroxybutyrate at indicated concentrations was added to 4T07 cell culture at day 3 an the growth allowed to proceed for an additional 24 h. All points are compared to Day 4 point. (D) 168FARN alone (homotypic) or in 1:1 co-culture with 4T01 cells were grown for 4 days and extracellular β-hydroxybutyrate was measured enzymatically as in Figure 4B. (E) 168FARN and 4T07 cells were cultured individually for 3 days. The medium was then replaced by the homotypic or heterotypic conditioned one, as indicated, and the culture allowed to continue for an additional 24 h. The β-hydroxybutyrate concentration was quantified at day 4. ns, not significant; *p < 0.05, **p < 0.01, ***p < 0.001.
FIGURE 6 |
FIGURE 6 |
Extracellular β-hydroxybutyrate leads to increased H3K9 histone acetylation and altered gene expression in 4T07 cells. (A) Expression levels of the slc16A family transporter genes in 4T07 were analyzed by RT-QPCR. Expression of HPRT served as normalization of the data. (B) H3K9 histone acetylation was analyzed by immunoblotting of extracts of 4T07 cells grown for 24 h in control, 168-conditioned medium or medium complemented with β-hydroxybutyrate or with butyrate, as indicated. Total histone 3 (H3) abundance served as normalization control. (C) 4T07 cells cultured for 3 days were incubated for 8 h with 4T07- (Ctrl) or 168-conditioned medium or purified β-hydroxybutyrate (10 mM) added to fresh medium. Total RNAs were purified and subjected to RT-QPCR with specific primers for LCN2 and IL-11. **p < 0.01, ***p < 0.001.
FIGURE 7 |
FIGURE 7 |
Impact of extracellular pH on the loser clone growth. (A) 168FARN and 4T07 cells were seeded at the indicated initial densities in six-well plates and cultured for 3 days. Culture media were removed, immediately covered with a layer of mineral oil to prevent oxidation and the pH was measured. (B) 105 168FARN cells were grown for 3 days. Medium was then replaced by conditioned media from cultures grown at low or high density, as indicated. Where indicated, 5 mM NaCO3 was used to buffer the 4T07 conditioned medium to pH 7. Twenty-four hours later cells were harvested and counted. Data are from three independent experiments conducted in triplicates. ns, not significant; ***p < 0.001.

References

    1. Amirouchene-Angelozzi N, Swanton C, and Bardelli A (2017). Tumor evolution as a therapeutic target. Cancer Discov. 7, 805–817. doi: 10.1158/2159-8290.cd-17-0343 - DOI - PubMed
    1. Archetti M, Ferraro DA, and Christofori G (2015). Heterogeneity for IGF-II production maintained by public goods dynamics in neuroendocrine pancreatic cancer. Proc. Natl. Acad. Sci. USA 112, 1833–1838. doi: 10.1073/pnas.1414653112 - DOI - PMC - PubMed
    1. Aslakson CJ, Rak JW, Miller BE, and Miller FR (1991). Differential influence of organ site on three subpopulations of a single mouse mammary tumor at two distinct steps in metastasis. Internal. J. Cancer 47, 466–472. doi: 10.1002/ijc.2910470327 - DOI - PubMed
    1. Axelrod R, Axelrod DE, and Pienta KJ (2006). Evolution of cooperation among tumor cells. Proc. Natl. Acad. Sci. USA 103, 13474–13479. doi: 10.1073/pnas.0606053103 - DOI - PMC - PubMed
    1. Beckman RA, Kareva I, and Adler FR (2020). How Should Cancer Models Be Constructed? Cancer Control 27, 1–12. - PMC - PubMed

LinkOut - more resources