

Deep Learning in Prostate Cancer Diagnosis Using Multiparametric Magnetic Resonance Imaging With Whole-Mount Histopathology Referenced Delineations
- PMID: 35096899
- PMCID: PMC8793798
- DOI: 10.3389/fmed.2021.810995
Deep Learning in Prostate Cancer Diagnosis Using Multiparametric Magnetic Resonance Imaging With Whole-Mount Histopathology Referenced Delineations
Abstract
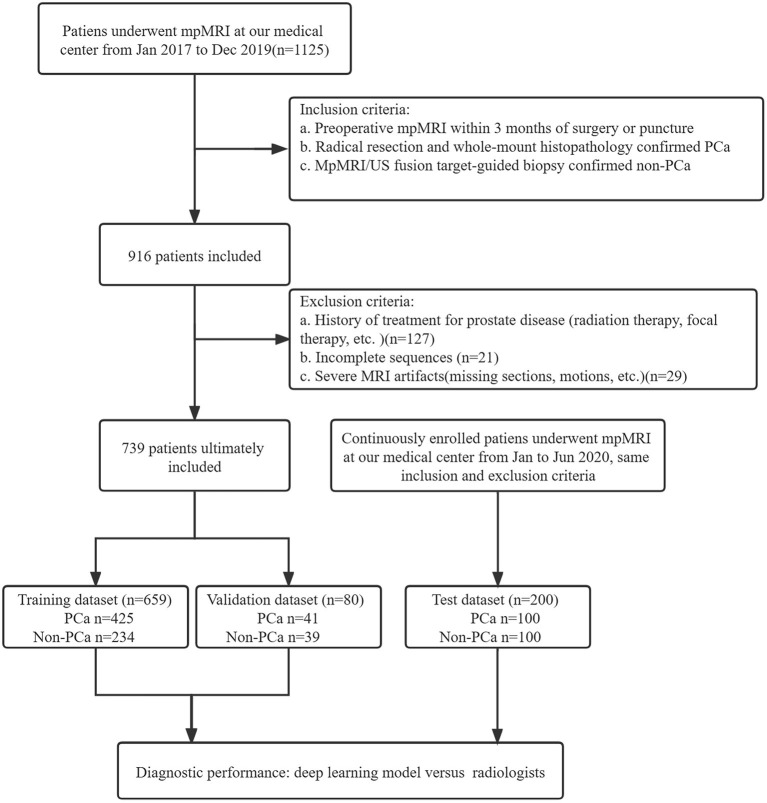
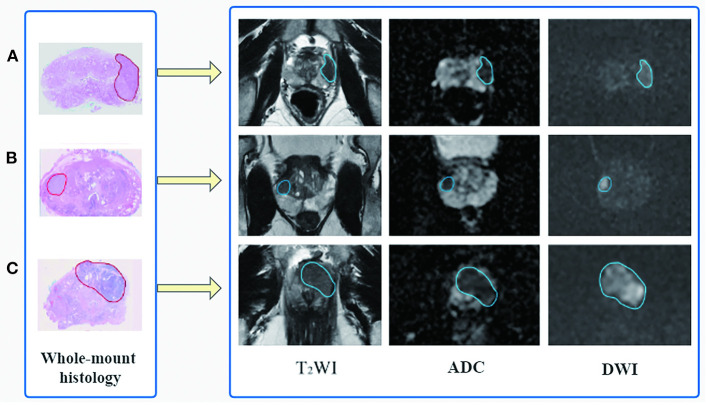
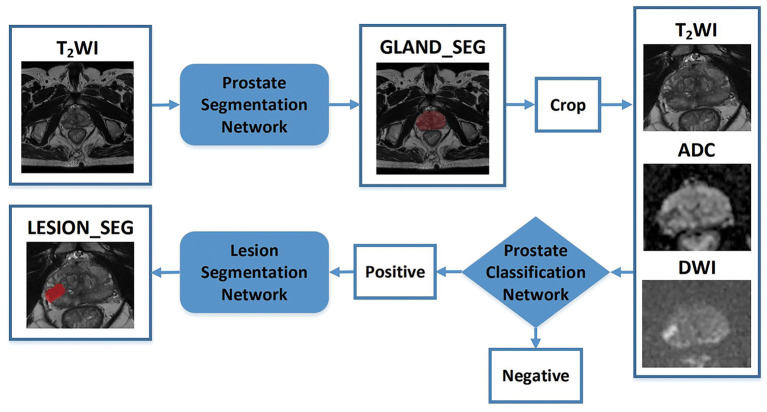
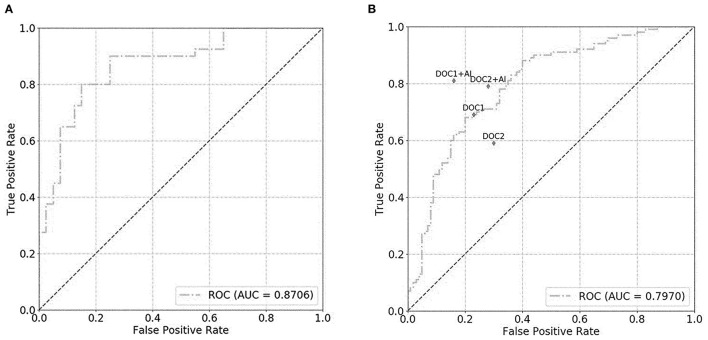
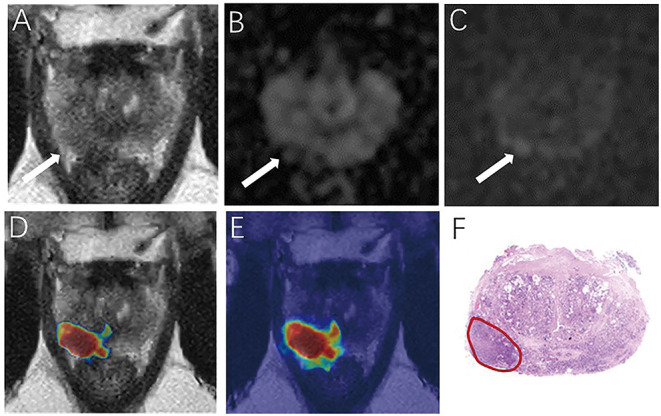
Background: Multiparametric magnetic resonance imaging (mpMRI) plays an important role in the diagnosis of prostate cancer (PCa) in the current clinical setting. However, the performance of mpMRI usually varies based on the experience of the radiologists at different levels; thus, the demand for MRI interpretation warrants further analysis. In this study, we developed a deep learning (DL) model to improve PCa diagnostic ability using mpMRI and whole-mount histopathology data. Methods: A total of 739 patients, including 466 with PCa and 273 without PCa, were enrolled from January 2017 to December 2019. The mpMRI (T2 weighted imaging, diffusion weighted imaging, and apparent diffusion coefficient sequences) data were randomly divided into training (n = 659) and validation datasets (n = 80). According to the whole-mount histopathology, a DL model, including independent segmentation and classification networks, was developed to extract the gland and PCa area for PCa diagnosis. The area under the curve (AUC) were used to evaluate the performance of the prostate classification networks. The proposed DL model was subsequently used in clinical practice (independent test dataset; n = 200), and the PCa detective/diagnostic performance between the DL model and different level radiologists was evaluated based on the sensitivity, specificity, precision, and accuracy. Results: The AUC of the prostate classification network was 0.871 in the validation dataset, and it reached 0.797 using the DL model in the test dataset. Furthermore, the sensitivity, specificity, precision, and accuracy of the DL model for diagnosing PCa in the test dataset were 0.710, 0.690, 0.696, and 0.700, respectively. For the junior radiologist without and with DL model assistance, these values were 0.590, 0.700, 0.663, and 0.645 versus 0.790, 0.720, 0.738, and 0.755, respectively. For the senior radiologist, the values were 0.690, 0.770, 0.750, and 0.730 vs. 0.810, 0.840, 0.835, and 0.825, respectively. The diagnosis made with DL model assistance for radiologists were significantly higher than those without assistance (P < 0.05). Conclusion: The diagnostic performance of DL model is higher than that of junior radiologists and can improve PCa diagnostic accuracy in both junior and senior radiologists.
Keywords: deep learning; detection; magnetic resonance imaging; prostate cancer; segmentation.
Copyright © 2022 Li, Han, Gao, Zhang, Yang, Liao, Guo and Zhang.
Conflict of interest statement
HY and SL were employed by company Shanghai United Imaging Intelligence Co. The remaining authors declare that the research was conducted in the absence of any commercial or financial relationships that could be construed as a potential conflict of interest.
Figures
References
-
- Suarez-Ibarrola R, Hein S, Reis G, Gratzke C, Miernik A. Current and future applications of machine and deep learning in urology: a review of the literature on urolithiasis, renal cell carcinoma, and bladder and prostate cancer. World J Urol. (2020) 38:2329–47. 10.1007/s00345-019-03000-5 - DOI - PubMed
-
- Syer T, Mehta P, Antonelli M, Mallett S, Atkinson D, Ourselin S, et al. . Artificial intelligence compared to radiologists for the initial diagnosis of prostate cancer on magnetic resonance imaging: a systematic review and recommendations for future studies. Cancers (Basel). (2021) 13:3318. 10.3390/cancers13133318 - DOI - PMC - PubMed
LinkOut - more resources
Full Text Sources