

Latent, sex-specific metabolic health effects in CD-1 mouse offspring exposed to PFOA or HFPO-DA (GenX) during gestation
- PMID: 35097227
- PMCID: PMC8794304
- DOI: 10.1016/j.emcon.2021.10.004
Latent, sex-specific metabolic health effects in CD-1 mouse offspring exposed to PFOA or HFPO-DA (GenX) during gestation
Abstract
Background: Perfluorooctanoic acid (PFOA) is an environmental contaminant associated with adverse metabolic outcomes in developmentally exposed human populations and mouse models. Hexafluoropropylene oxide-dimer acid (HFPO-DA, commonly called GenX) has replaced PFOA in many industrial applications in the U.S. and Europe and has been measured in global water systems from <1 to 9350 ng/L HFPO-DA. Health effects data for GenX are lacking.
Objective: Determine the effects of gestational exposure to GenX on offspring weight gain trajectory, adult metabolic health, liver pathology and key adipose gene pathways in male and female CD-1 mice.
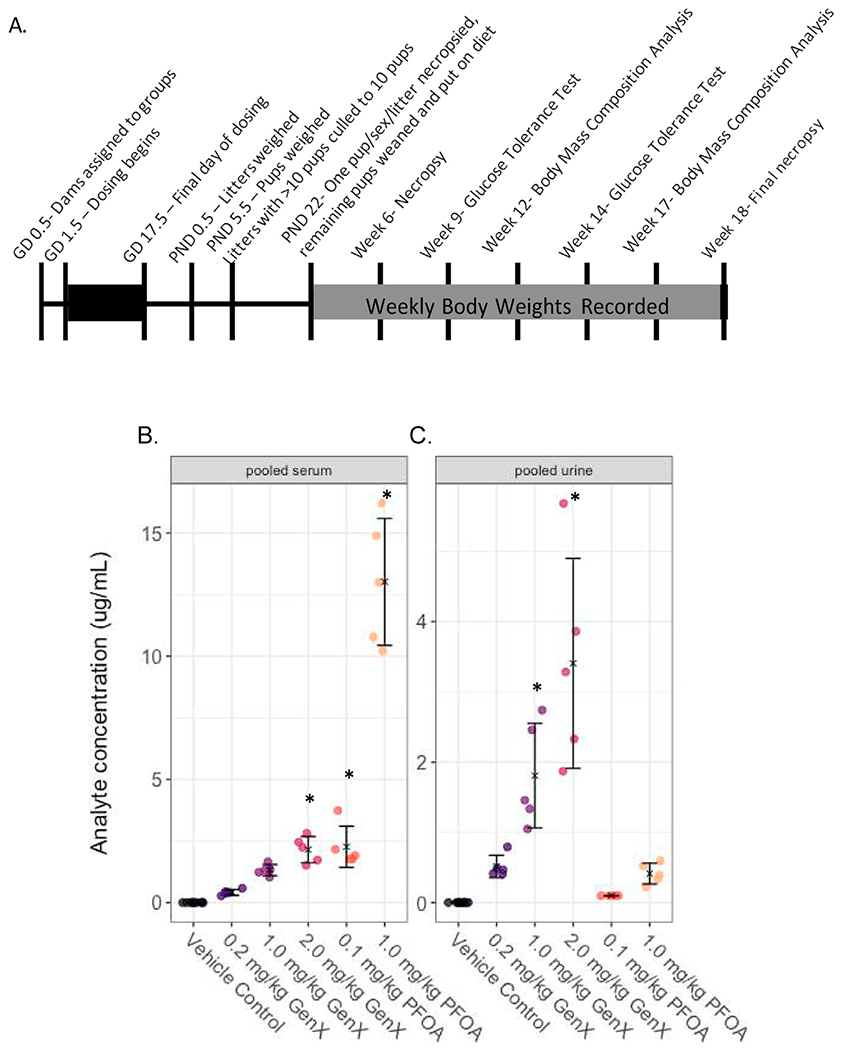
Methods: Daily oral doses of GenX (0.2, 1.0, 2.0 mg/kg), PFOA (0.1, 1.0 mg/kg), or vehicle control were administered to pregnant mice (gestation days 1.5-17.5). Offspring were fed a high- or low-fat diet (HFD or LFD) at weaning until necropsy at 6 or 18 weeks, and metabolic endpoints were measured over time. PFOA and GenX serum and urine concentrations, weight gain, serum lipid parameters, body mass composition, glucose tolerance, white adipose tissue gene expression, and liver histopathology were evaluated.
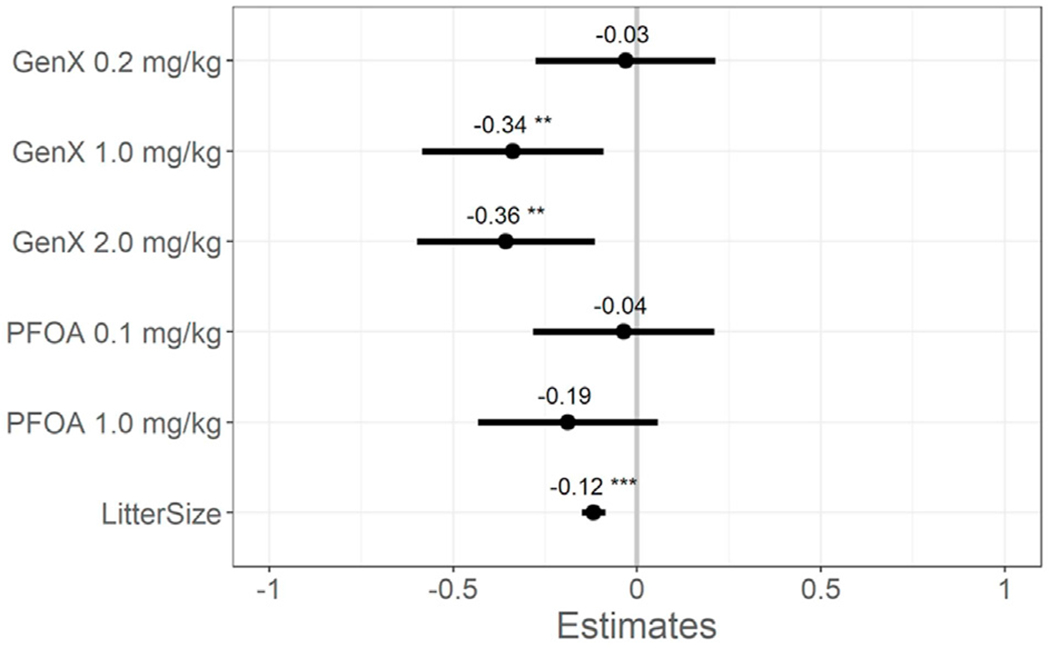
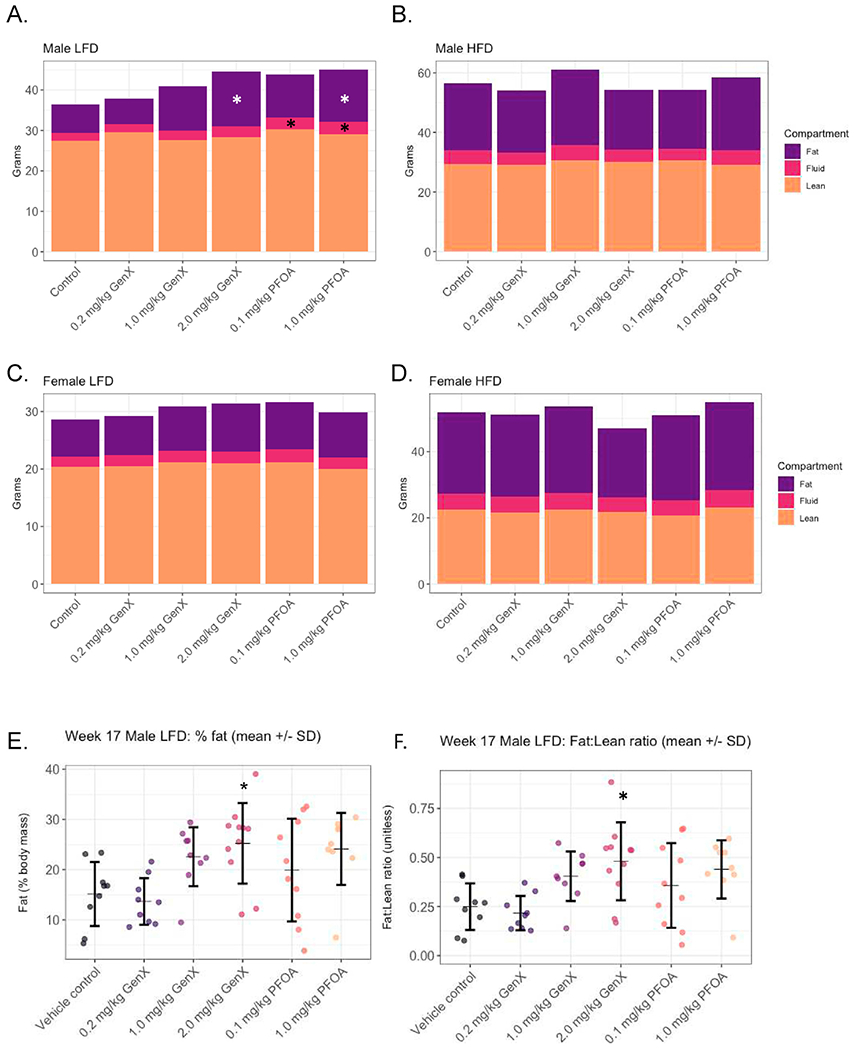
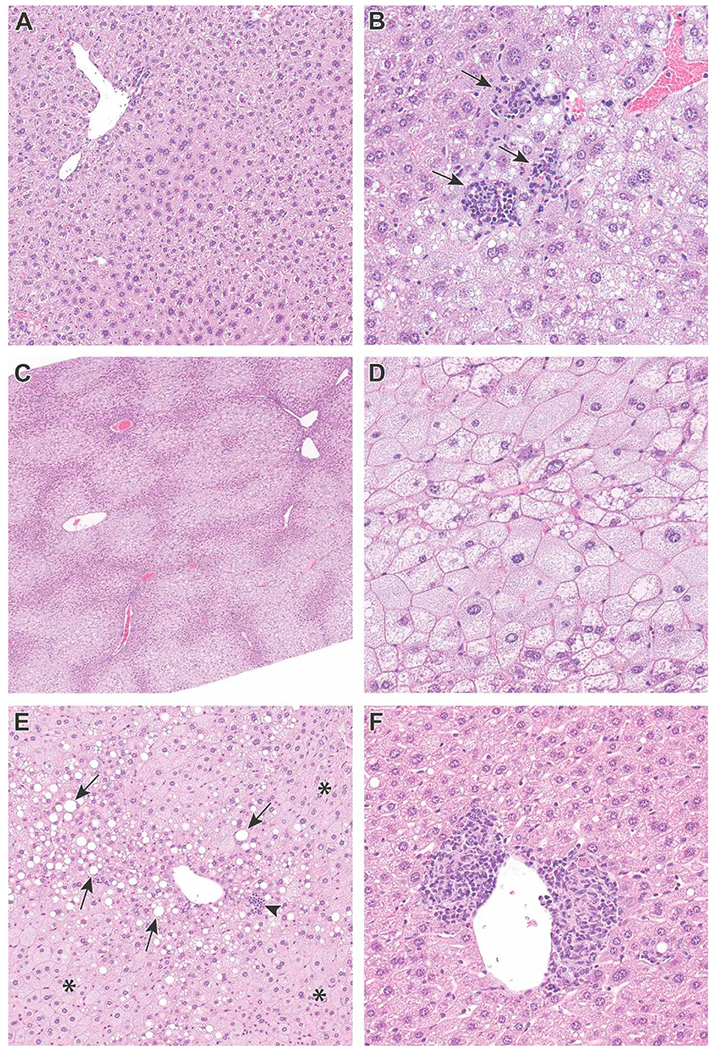
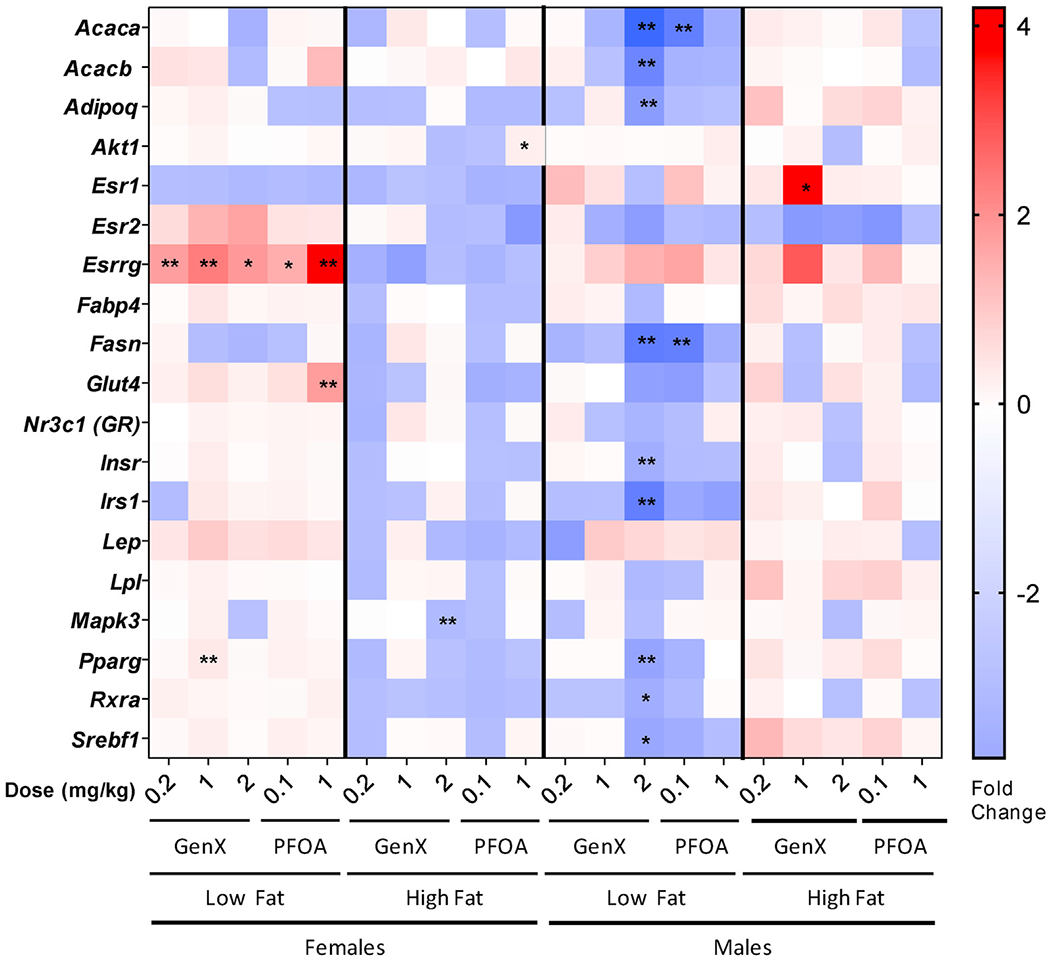
Results: Prenatal exposure to GenX led to its accumulation in the serum and urine of 5-day old pups (P = 0.007, P < 0.001), which was undetectable by weaning. By 18 weeks of age, male mice fed LFD in the 2.0 mg/kg GenX group displayed increased weight gain (P < 0.05), fat mass (P = 0.016), hepatocellular microvesicular fatty change (P = 0.015), and insulin sensitivity (P = 0.014) in comparison to control males fed LFD. Female mice fed HFD had a significant increase in hepatocyte single cell necrosis in 1.0 mg/kg GenX group (P = 0.022) and 1.0 mg/kg PFOA group (P = 0.003) compared to control HFD females. Both sexes were affected by gestational GenX exposure; however, the observed phenotype varied between sex with males displaying more characteristics of metabolic disease and females exhibiting liver damage in response to the gestational exposure.
Conclusions: Prenatal exposure to 1 mg/kg GenX and 1 mg/kg PFOA induces adverse metabolic outcomes in adult mice that are diet- and sex-dependent. GenX also accumulated in pup serum, suggesting that placental and potentially lactational transfer are important exposure routes for GenX.
Keywords: GenX; Gestational exposure; HFPO-DA; Metabolism; Microvesicular fatty change; PFAS; PFOA.
Conflict of interest statement
Declaration of competing interest The authors report no conflicts of interest.
Figures
Similar articles
-
Evaluation of Maternal, Embryo, and Placental Effects in CD-1 Mice following Gestational Exposure to Perfluorooctanoic Acid (PFOA) or Hexafluoropropylene Oxide Dimer Acid (HFPO-DA or GenX).Environ Health Perspect. 2020 Feb;128(2):27006. doi: 10.1289/EHP6233. Epub 2020 Feb 13. Environ Health Perspect. 2020. PMID: 32074459 Free PMC article.
-
Transcriptional pathways linked to fetal and maternal hepatic dysfunction caused by gestational exposure to perfluorooctanoic acid (PFOA) or hexafluoropropylene oxide-dimer acid (HFPO-DA or GenX) in CD-1 mice.Ecotoxicol Environ Saf. 2022 Dec 15;248:114314. doi: 10.1016/j.ecoenv.2022.114314. Epub 2022 Nov 24. Ecotoxicol Environ Saf. 2022. PMID: 36436258 Free PMC article.
-
NTP technical report on the toxicity studies of Dibutyl Phthalate (CAS No. 84-74-2) Administered in Feed to F344/N Rats and B6C3F1 Mice.Toxic Rep Ser. 1995 Apr;30:1-G5. Toxic Rep Ser. 1995. PMID: 12209194
-
Environmental contamination and human exposure to PFASs near a fluorochemical production plant: Review of historic and current PFOA and GenX contamination in the Netherlands.Environ Int. 2020 Apr;137:105583. doi: 10.1016/j.envint.2020.105583. Epub 2020 Feb 24. Environ Int. 2020. PMID: 32106048 Review.
-
NTP Research Report on the CLARITY-BPA Core Study: A Perinatal and Chronic Extended-Dose-Range Study of Bisphenol A in Rats: Research Report 9 [Internet].Research Triangle Park (NC): National Toxicology Program; 2018 Sep. Research Triangle Park (NC): National Toxicology Program; 2018 Sep. PMID: 31305969 Free Books & Documents. Review.
Cited by
-
A Critical Review and Meta-Analysis of Impacts of Per- and Polyfluorinated Substances on the Brain and Behavior.Front Toxicol. 2022 Apr 11;4:881584. doi: 10.3389/ftox.2022.881584. eCollection 2022. Front Toxicol. 2022. PMID: 35480070 Free PMC article. Review.
-
Per- and Polyfluoroalkyl Substances and Breastfeeding as a Vulnerable Function: A Systematic Review of Epidemiological Studies.Toxics. 2023 Mar 29;11(4):325. doi: 10.3390/toxics11040325. Toxics. 2023. PMID: 37112552 Free PMC article. Review.
-
Cumulative maternal and neonatal effects of combined exposure to a mixture of perfluorooctanoic acid (PFOA) and perfluorooctane sulfonic acid (PFOS) during pregnancy in the Sprague-Dawley rat.Environ Int. 2022 Dec;170:107631. doi: 10.1016/j.envint.2022.107631. Epub 2022 Nov 12. Environ Int. 2022. PMID: 36402036 Free PMC article.
-
RISING STARS: Sex differences in toxicant-associated fatty liver disease.J Endocrinol. 2023 Jun 16;258(1):e220247. doi: 10.1530/JOE-22-0247. Print 2023 Jul 1. J Endocrinol. 2023. PMID: 37074385 Free PMC article. Review.
-
Neurotransmission Targets of Per- and Polyfluoroalkyl Substance Neurotoxicity: Mechanisms and Potential Implications for Adverse Neurological Outcomes.Chem Res Toxicol. 2022 Aug 15;35(8):1312-1333. doi: 10.1021/acs.chemrestox.2c00072. Epub 2022 Aug 3. Chem Res Toxicol. 2022. PMID: 35921496 Free PMC article. Review.
References
-
- Hales CM, Prevalence of obesity and severe obesity among adults, United States (360) (2020) 8, 2017–2018. - PubMed
-
- Samson Metabolic, Syndrome | elsevier enhanced reader, Internet, https://reader.elsevier.com/reader/sd/pii/S0889852913001084?token=081907.... (Accessed 21 January 2020). Available from.
-
- Bruce KD, Hanson MA, The developmental origins, mechanisms, and implications of metabolic syndrome, J. Nutr 140 (3) (2010. Mar 1) 648–652. - PubMed
-
- Barker DJP, The developmental origins of chronic adult disease, Acta Paediatr Oslo Nor 93 (446) (2004. Dec) 26–33, 1992 Suppl. - PubMed
Grants and funding
LinkOut - more resources
Full Text Sources
Research Materials
Miscellaneous