

Combining ALT/AST Values with Surgical APGAR Score Improves Prediction of Major Complications after Hepatectomy
- PMID: 35098141
- PMCID: PMC8794434
- DOI: 10.26502/jsr.10020179
Combining ALT/AST Values with Surgical APGAR Score Improves Prediction of Major Complications after Hepatectomy
Abstract
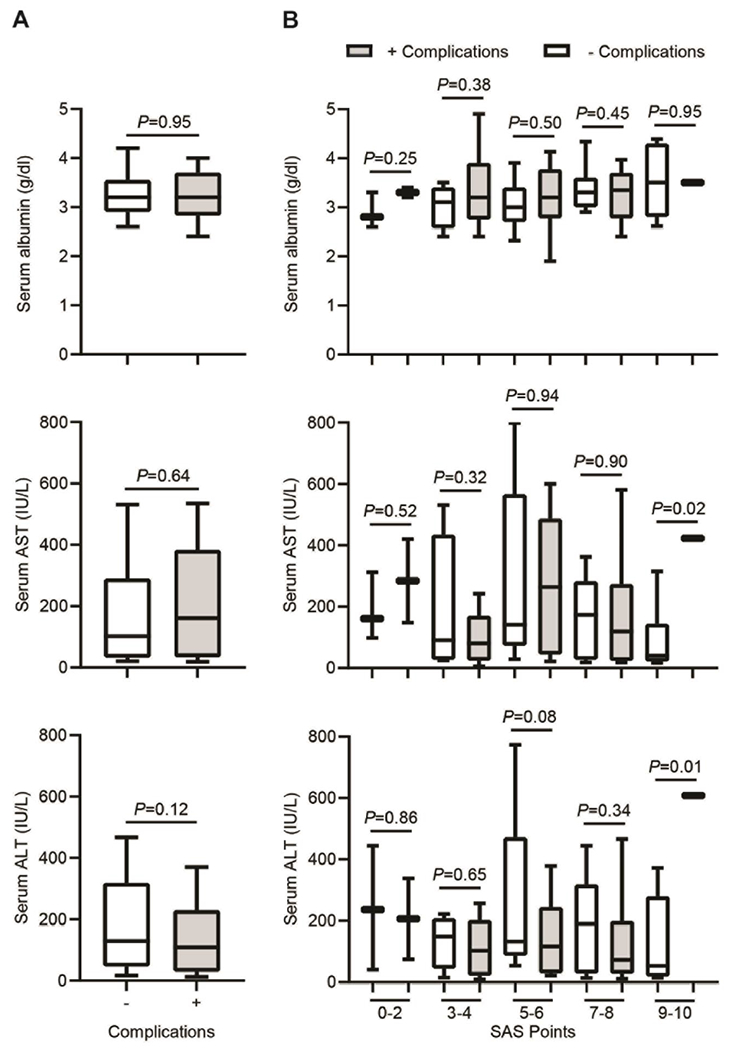
Hepatectomy is a complex procedure with high morbidity and mortality. Early prediction/prevention of major complications is highly valuable for patient care. Surgical APGAR score (SAS) has been validated to predict post-surgical complications (PCs). We aimed to define a simple complications classification following hepatectomy based on a therapy-oriented severity Clavien-Dindo classification (CDC). 119 patients undergoing liver resection were included. PCs were determined at follow-up based on CDC. Clinicopathological factors were used to calculate SAS. A receiver-operator characteristic (ROC) curve analysis estimated the predictive value of SAS for PCs. Circulating markers levels of liver injury were analyzed as critical elements on PCs. SAS (P=0.008), estimated blood-loss (P=0.018) and operation time (P=0.0008) were associated with PCs. SAS was reduced in patients with (+) compared to those without (-) complications (6.64±1.84 vs 5.70±1.79, P=0.0079). The area-under-the-curve was 0.646 by ROC, indicating an acceptable discrimination with 65% possibility to distinguish (-) and (+) groups (P=0.004). Best cutoff value for SAS was ≤6/≥7, at which sensitivity and specificity were maximal. ALT/ASL levels were significantly different within the group with 9-10 SAS points (P=0.01 and 0.02). In conclusion, SAS provides accurate risk stratification for major PCs after hepatectomy, and might help improving the overall patient outcome.
Keywords: Circulating markers; Hepatectomy; Liver disease; Postoperative Complications; Surgical APGAR Score.
Conflict of interest statement
Disclosure statement The authors declare no conflicts of interest
Figures

References
-
- Mittler J, McGillicuddy JW, Chavin KD. Laparoscopic liver resection in the treatment of hepatocellular carcinoma. Clin Liver Dis 15 (2011): 371–384. - PubMed
-
- Utsunomiya T, Shimada M. Modified hanging method for liver resection. J Hepatobiliary Pancreat Sci 19 (2012): 19–24. - PubMed
-
- Morbidity Virani S. and mortality after liver resection: results of the patient safety in surgery study. J Am Coll Surg 204 (2007): 1284–1292. - PubMed
-
- Takayama T Surgical treatment for hepatocellular carcinoma. Jpn J Clin Oncol 41 (2011): 447–454. - PubMed
-
- Rahbari NN. The predictive value of postoperative clinical risk scores for outcome after hepatic resection: a validation analysis in 807 patients. Ann Surg Oncol 18 (2011): 3640–3649. - PubMed
Grants and funding
LinkOut - more resources
Full Text Sources