. 2022 Jan 20;3(1):101119.
doi: 10.1016/j.xpro.2021.101119. eCollection 2022 Mar 18.

Fluorescence imaging detection of nanodomain redox signaling events at organellar contacts

Affiliations

Fluorescence imaging detection of nanodomain redox signaling events at organellar contacts

David M Booth et al. STAR Protoc. .

Abstract

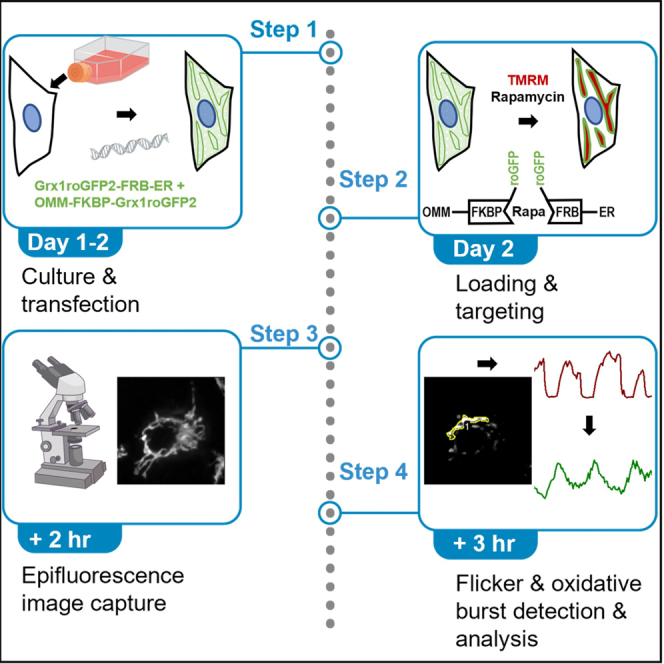
This protocol describes how to visualize, detect, and analyze redox signals (oxidative bursts) at the ER-mitochondrial interface. It uses drug-inducible crosslinking to target the genetically encoded glutathione redox sensor Grx1roGFP2 to organellar contact sites to measure local redox changes associated with transient depolarizations of the mitochondrial membrane potential (flickers). The strategy allows imaging of the oxidized to reduced glutathione ratio (GSSG:GSH) in subcellular regions below the diffraction limit with good temporal resolution and minimum phototoxicity. Moreover, the strategy also applies to diverse parameters including pH, H2O2, and Ca2+. For complete details on the use and execution of this profile, please refer to Booth et al. (2016) and Booth et al. (2021).

Keywords: Cell Biology; Microscopy; Molecular/Chemical Probes.


Conflict of interest statement

The authors declare no competing interests.

Figures

None
Graphical abstract
Figure 1
Figure 1
Culture of HepG2 cells Phase contrast images of HepG2 cells at ∼85% max confluency. Scale bar: 50 μm
Figure 2
Figure 2
Optical setup of fluorescence microscope (A) Excitation spectra of fluorophores with complementary excitation filters. (B) Transmission spectra of dichroic filter. (C) Emission spectra of fluorophores with complementary emission filter.
Figure 3
Figure 3
Probe targeting in HepG2 cells (A) HepG2 cells with TMRM loaded mitochondria (upper) expressing ER-surface and OMM-surface Grx1roGFP2 linkers (lower) before (left) and after (right) targeting to the ER-mitochondrial interface with rapamycin. (B) Enlarged region of A showing morphology rearrangement of ER-dominant Grx1roGFP2 signal in the lower cell with no response in the upper. Scale bar: 10 μm (A) & 5 μm (B).
Figure 4
Figure 4
On Stage calibration of Grx1roGFP2 Individual wavelength responses of a single HepG2 cell expressing ER-M Grx1roGFP2 & OMM-Grx1roGFP2 targeted to the ER-mitochondrial interface. Grx1 is fully reduced through addition of 1mM DTT. A second DTT addition is used to ensure complete reduction of the probe as shown by increase of the F480 emission signal and decrease of the F402 nm signal shown as fluorescence arbitrary units. The DTT containing imaging solution is replaced by multiple washes and addition of 200μM H2O2. A second pulse of H2O2 is added to ensure full oxidation as shown by a decrease of the F480 nm emission and increase of the F402 nm emission.
Figure 5
Figure 5
Examples of mitochondrial flicker analysis (A) two flickers of the same organelle, A and B identified by difference image analysis. Each have stable pre-flicker fluorescence values (F0A and F0B), maximum depolarization (FminA and FminB). Half-Max depolarization is calculated and marked for each flicker (Half-MaxA and Half-MaxB). Initiation for both flickers is derived from the time of Half-Max depolarization. (B) Fluorescence values and time points given for flickers A and B in panel A.
Figure 6
Figure 6
Mitochondrial membrane flickers and oxidative bursts evoked in HepG2 cells after stimulation with Staurosporine (A) Example images from Difference Image Analysis. showing individual flickers and regions of interest (ROIs) selected around them. Area based on 0.4μm2 pixel size. (B) Graph showing area of flickers Vs. time following stimulation (Staurosporine, 2μM at t= 5mins) (C) Sample traces of repeated oxidative bursts derived from flicker ROI masking of Grx1roGFP2 fluorescence emission.
Figure 7
Figure 7
Potential pitfalls of imaging mitochondrial membrane potential with TMRM (A) Cells treated with a depolarization cocktail (FCCP: 5 μM & Oligomycin: 2.5 μg/μL) show an immediate transition from a mitochondrial fluorescence distribution (t = 0 min) to a less-specific whole-cell fluorescence (t = 1 min). Following rapid loss of the mitochondrial distribution, TMRM fluorescence persists for many minutes (t = 5 min). Scale bar: 10 μm. (B) Line graph depiction of (A) in which FCCP & Oligomycin (addition indicated by arrow at 0 min) cause a rapid redistribution of TMRM fluorescence from the mitochondrial matrix (Red) to the cytosol (blue) where it is slowly lost from the whole cell region (Black). Detail of the redistribution is shown in expanded timescale (total: 90 s. Inset). The loss of TMRM fluorescence from the whole cell region may have a slow kinetic generating an artificially high Fmin (Dashed line). Replenishment of the imaging buffer (arrow at 6:30 s) speeds TMRM loss to generate a more accurate Fmin (Dotted line). (C) Section of a HepG2 cell undergoing mitochondrial flickers stimulated by staurosporine. Transient loss of ΔѰm causes a rapid loss of TMRM fluorescence (M1, t = 19, pseudo color difference: Red) in the active mitochondrion. TMRM leaving the flickering mitochondrion is visible as a cloud of increased fluorescence in the surrounding cytosol (t = 19 pseudo color: Blue). Cytosolic fluorescence of released TMRM decreases (t = 21 s pseudo color: Red) as it is taken up by neighboring polarized mitochondria (M2, t = 21 s pseudo color: Blue), which declines upon the repolarization of the flickering mitochondrion (M1, Blue, M2, Red). Scale Bar 5μm. (D) Line graph of 3 regions of interest (Flickering mitochondrion: M1, stable mitochondrion: M2 & extramitochondrial region of cytosol: Cyto). Demonstrating loss of TMRM from M1 to the cytosol and subsequent uptake to the polarized M2. Restoration to the starting distribution begins after repolarization of M1 (t = 20 s).

References

    1. Booth D.M., Enyedi B., Geiszt M., Varnai P., Hajnoczky G. Redox nanodomains are induced by and control calcium signaling at the ER-mitochondrial interface. Mol. Cell. 2016;63:240–248. - PMC - PubMed
    1. Booth D.M., Varnai P., Joseph S.K., Hajnoczky G. Oxidative bursts of single mitochondria mediate retrograde signaling toward the ER. Mol. Cell. 2021 doi: 10.1016/j.molcel.2021.07.014. - DOI - PMC - PubMed
    1. Csordas G., Varnai P., Golenar T., Roy S., Purkins G., Schneider T.G., Balla T., Hajnoczky G. Imaging interorganelle contacts and local calcium dynamics at the ER-mitochondrial interface. Mol. Cell. 2010;39:121–132. - PMC - PubMed
    1. Duchen M.R., Leyssens A., Crompton M. Transient mitochondrial depolarizations reflect focal sarcoplasmic reticular calcium release in single rat cardiomyocytes. J. Cell Biol. 1998;142:975–988. - PMC - PubMed
    1. Gerencser A.A., Chinopoulos C., Birket M.J., Jastroch M., Vitelli C., Nicholls D.G., Brand M.D. Quantitative measurement of mitochondrial membrane potential in cultured cells: calcium-induced de- and hyperpolarization of neuronal mitochondria. J. Physiol. 2012;590:2845–2871. - PMC - PubMed

Publication types

LinkOut - more resources