. 2022 Feb 15;135(4):jcs259194.
doi: 10.1242/jcs.259194. Epub 2022 Feb 24.

Novel stress granule-like structures are induced via a paracrine mechanism during viral infection

Affiliations

Novel stress granule-like structures are induced via a paracrine mechanism during viral infection

Valentina Iadevaia et al. J Cell Sci. .

Abstract

To rapidly adapt to stresses such as infections, cells have evolved several mechanisms, which include the activation of stress response pathways and the innate immune response. These stress responses result in the rapid inhibition of translation and condensation of stalled mRNAs with RNA-binding proteins and signalling components into cytoplasmic biocondensates called stress granules (SGs). Increasing evidence suggests that SGs contribute to antiviral defence, and thus viruses need to evade these responses to propagate. We previously showed that feline calicivirus (FCV) impairs SG assembly by cleaving the scaffolding protein G3BP1. We also observed that uninfected bystander cells assembled G3BP1-positive granules, suggesting a paracrine response triggered by infection. We now present evidence that virus-free supernatant generated from infected cells can induce the formation of SG-like foci, which we name paracrine granules. They are linked to antiviral activity and exhibit specific kinetics of assembly-disassembly, and protein and RNA composition that are different from canonical SGs. We propose that this paracrine induction reflects a novel cellular defence mechanism to limit viral propagation and promote stress responses in bystander cells.

Keywords: G3BP1; Stress granule; Virus.


Conflict of interest statement

Competing interests The authors declare no competing or financial interests.

Figures
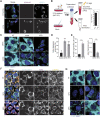
Fig. 1.
Fig. 1.
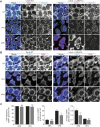
FCV infection results in the formation of paracrine granules. (A) Confocal microscopy analysis of CRFK cells infected with FCV (MOI 0.2) or UV-inactivated FCV [FCV(UVi)] for 5 h. Samples were stained for the SG marker G3BP1 (cyan) and infected cells detected by immunostaining against FCV NS6/7 (magenta), and the nuclei were stained with DAPI (blue). Scale bars: 20 μm. White arrowheads indicate G3BP1 foci. (B) Schematic representation of the VFS preparation procedure. Detection of FCV replication by TCID50 assay following VFS treatment or infection of CRFK cells with FCV at MOI of 2. Results are mean±s.e.m. (n=3). Statistical significance is shown above the bars. **P<0.01 (one-tailed unpaired t-test). (C) CRFK or U2OS GFP-G3BP1 cells were stimulated for 1 h with VFS from a mock or FCV infection and the distribution of G3BP1 analysed by confocal microscopy using detection of endogenous G3BP1 (cyan) in CRFK, or GFP (cyan) in U2OS cells. Non-treated (NT) cells were used as controls. Nuclei were stained with DAPI (blue). Scale bars: 10 μm. (D) Bar plot (n=3) of the percentage of U2OS cells displaying G3BP1 foci, mean±s.d. for 100 G3BP1-positive cells analysed across at least 10 acquisitions. ARS, 0.5 mM sodium arsenite treatment. Statistical significance shown above the bars, ***P<0.001 (one-way ANOVA). (E) Bar plot (n=3) of the number of G3BP1 granules per cells displaying G3BP1 foci and the average granule size, mean±s.d. for 100 G3BP1-positive cells analysed across at least 10 acquisitions. Statistical significance shown above the bars, ***P<0.001, **P<0.01 (one-way ANOVA). (F) U2OS GFP-G3BP1 cells were stimulated for 1 h with VFS or 0.5 mM sodium arsenite (ARS) prior to fixation and the formation of PGs or SGs analysed by confocal microscopy. Non-treated (NT) cells were used as controls. Cells were stained with GFP (cyan), FXR1 (magenta) and UBAP2L (gold) as PG or SG markers. Nuclei were stained with DAPI (blue). Scale bars: 10 μm. (G) U2OS GFP-G3BP1 cells were pretreated with ARS or VFS and for forced SG disassembly, treated with 10 μg/ml of CHX for the final 30 min (+CHX). The presence of G3BP1 granules was assessed as in D. Scale bars: 10 μm. Images in A,C,F and G are representative of three experiments.
Fig. 2.
Fig. 2.
G3BP1 is not an essential for PG assembly. (A) Wild-type (WT) or ΔΔ G3BP1/2 U2OS cells were stimulated for 1 h with VFS or 0.5 mM sodium arsenite (ARS) prior to fixation and the formation of PGs or SGs analysed by confocal microscopy. Non-treated (NT) cells were used as controls. Cells were stained with FXR1 (magenta) and UBAP2L (cyan) as PG or SG markers. Nuclei were stained with DAPI (blue). Scale bars: 10 μm. (B) Wild-type (WT) or ΔΔ UBAP2L HeLa cells were stimulated as in A prior to fixation and the formation of PGs or SGs analysed by confocal microscopy. Non-treated (NT) cells were used as controls. Cells were stained with G3BP1 (cyan) and PABP1 (PABP, magenta) as PG or SG markers. Nuclei were stained with DAPI (blue). Scale bars: 10 μm. (C) Bar plot (n=3) of the average number of WT or ΔΔ UBAP2L HeLa cells with G3BP1 granules, the number of G3BP1 granules per cells displaying G3BP1 foci and the average granule size, mean±s.d. for 100 cells analysed across at least 10 acquisitions. Black, WT; grey, ΔΔ UBAP2L. Statistical significance shown above the bars. ***P<0.001; **P<0.01; ns, not significant (two-way ANOVA).
Fig. 3.
Fig. 3.
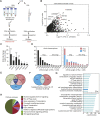
Proteomic analysis reveals differences between VFS-induced PGs and ARS-induced SGs. (A) Schematic representation of the granule isolation procedure. MS, mass spectrometry. (B) Protein A Dynabeads analysed by epifluoresence microscopy in non-treated (NT) or VFS-treated U2OS GFP-G3BP1 cells following PG isolation; bead-bound G3BP1 granules are indicated by white arrowheads. (C) Scatterplot of 110 proteins enriched in PGs over control (log2 transformed for each IP ratio relative to control IgG). Proteins identified as components of other biocondensates (SGs; PBs, P-bodies; PSPs, paraspeckles) are indicated in colour. The mean enrichment is shown by a solid line and dotted lines indicate the threshold for significance. (D) Venn diagram comparison of 110 proteins identified in PGs and 317 in SGs (from Jain et al., 2016). The representation factor shows the enrichment over the expected, and the P-value (two-way ANOVA) is based on the cumulative distribution function (CDF) of the hypergeometric distribution of the dataset over the mouse proteome. (E) Box-plots of the average score of the probability of a protein containing a long intrinsically disordered region determined using SLIDER in the GFP versus IgG IPs for VFS-treated or control (NT) cells. Lines mark the average values, boxes show the interquartile range of the probability values and whiskers indicate the range. The dotted line marks the average value for control IgG. Statistical significance shown above the bars, ****P<0.0001 (one-way ANOVA). (F) Bar plot of the most enriched protein domains in the PG discovery analysis using Pfam, SMART and InterPro. (G) GO pathway analysis of the 110 resident proteins isolated in PGs using Cytoscape.
Fig. 4.
Fig. 4.
Transcriptomic analysis reveals differences between VFS-induced PGs and ARS-induced SGs. (A) Schematic representation of the procedure for total and PG transcriptome analysis in VFS-treated or untreated cells. (B) Volcano plot showing statistically significantly enriched differentially expressed RNAs (log2 fold change of VFS versus non-treated) in PGs. RNAs in red correspond to those validated by qPCR in C. BH, Benjamini–Hochberg. (C) Transcript levels of PG resident mRNAs were quantified via RT-qPCR relative to untreated and normalized to the individual total level of each RNA. Error bars represent s.e.m. (n=3), and statistical significance is shown above the bars, *P<0.05, ***P<0.005 (one-way ANOVA). (D) Comparison of the mRNA length for transcripts enriched in PGs and arsenite-induced SGs (from Khong et al., 2017) compared to total transcriptome distribution. CDS, coding DNA sequence; UTR, untranslated region. (E) Venn diagram comparison of mRNAs enriched in PGs and arsenite-induced SGs (from Khong et al., 2017; Namkoong et al., 2018). (F) Venn diagram comparison of the GO terms (molecular function and biological process) enriched in the mRNAs enriched in PGs or SGs upon VFS-stimulation or sodium arsenite (ARS) treatment (from Khong et al., 2017). (G) Comparison of the top 10 GO terms enrichment (molecular function and biological process) for mRNAs enriched in PGs (mid blue) or SGs (pink). GO terms overlapping both conditions are in light blue. (H) Clustering by functional pathways identified from GO analysis (KEGG/Reactome) of the mRNAs enriched in VFS-treated versus non-treated U2OS cells.
Fig. 5.
Fig. 5.
N6-methyladenosine modified RNAs are enriched in PGs. (A) Top 5 RNA motifs identified from DREME analysis of the PG transcriptome, with corresponding putative RBP targets identified from Tomtom analysis of these motifs and the corresponding proteins identified by proteomic analysis as PG components. (B) U2OS GFP-G3BP1 cells were stimulated for 1 h with VFS or 0.5 mM sodium arsenite (ARS) prior to fixation and the formation of PGs or SGs analysed by confocal microscopy. Non-treated (NT) cells were used as controls. Cells were immunostained against GFP (cyan) and m6A (magenta). Nuclei were stained with DAPI (blue). Scale bars: 10 μm. (C) Venn diagram comparison of 1374 RNAs identified in PGs and 4839 m6A-edited mRNAs localised to SGs (from Anders et al., 2018). The representation factor shows the enrichment over the expected, and the P-value (two-tailed unpaired t-test) is based on the cumulative distribution function of the hypergeometric distribution of the dataset over the human genome. (D) The presence of G3BP1 granules was assessed as in B. Cells were stained with GFP (cyan) and YTHDF3 (magenta). Nuclei were stained with DAPI (blue). Scale bars: 10 μm. Images in B and D are representative of three experiments.
Fig. 6.
Fig. 6.
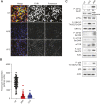
PG assembly is associated with global shut-off in translation and activation of intracellular signalling pathways. (A) U2OS cells stimulated for 1 h with VFS or 0.5 mM sodium arsenite (ARS) were incubated with 10 μg/ml puromycin to label nascent polypeptide chains prior to fixation. Non-treated (NT) cells were used as a control. Puromycin-labelled chains were visualised by immunostaining against puromycin (green), and PG or SG cells were detected by immunostaining against FXR1 (red). Nuclei were stained with DAPI. Scale bars: 100 μm. (B) Representative scatter plots of de novo protein synthesis measured by fluorescence intensity of the puromycin signal (n=3). Lines indicate the mean values. (C) Representative western blot analysis (n=3) of cells stimulated as in A. Antibodies used are indicated to the left. The levels of phosphorylated eIF2α are shown, normalised to levels in non-treated cells.
Fig. 7.
Fig. 7.
VFS treatment impairs FCV replication in CRFK cells. (A) CRFK cells were stimulated for 1 h with decreasing amounts of VFS and infected with FCV at an MOI of 1. The cells were incubated for 12 h, and the viral titre was estimated by a TCID50 assay. Error bars represent s.d. Three separate experiments were analysed by standard two-tailed paired t-test (**P<0.01; ns, not significant). (B) Transcript levels of indicated mRNAs were quantified via RT-qPCR in CRFK cells following stimulation with VFS for 1 or 6 h and normalized to non-treated cells. Error bars represent s.e.m. (n=3).

References

    1. An, H., Tan, J. T. and Shelkovnikova, T. A. (2019). Stress granules regulate stress-induced paraspeckle assembly. J. Cell Biol. 218, 4127-4140. 10.1083/jcb.201904098 - DOI - PMC - PubMed
    1. Anders, M., Chelysheva, I., Goebel, I., Trenkner, T., Zhou, J., Mao, Y., Verzini, S., Qian, S.-B. and Ignatova, Z. (2018). Dynamic m(6)A methylation facilitates mRNA triaging to stress granules. Life Sci Alliance. 1, e201800113. 10.26508/lsa.201800113 - DOI - PMC - PubMed
    1. Anderson, P., Kedersha, N. and Ivanov, P. (2015). Stress granules, P-bodies and cancer. Biochim. Biophys. Acta 1849, 861-870. - PMC - PubMed
    1. Aulas, A., Fay, M. M., Lyons, S. M., Achorn, C. A., Kedersha, N., Anderson, P. and Ivanov, P. (2017). Stress-specific differences in assembly and composition of stress granules and related foci. J. Cell Sci. 130, 927-937. - PMC - PubMed
    1. Bailey, T. L., Boden, M., Buske, F. A., Frith, M., Grant, C. E., Clementi, L., Ren, J., Li, W. W. and Noble, W. S. (2009). MEME SUITE: tools for motif discovery and searching. Nucleic Acids Res. 37, W202-W208. 10.1093/nar/gkp335 - DOI - PMC - PubMed

Publication types

MeSH terms

Substances