. 2022 May 3;189(1):129-151.
doi: 10.1093/plphys/kiac024.

Heinz-resistant tomato cultivars exhibit a lignin-based resistance to field dodder (Cuscuta campestris) parasitism

Affiliations

Heinz-resistant tomato cultivars exhibit a lignin-based resistance to field dodder (Cuscuta campestris) parasitism

Min-Yao Jhu et al. Plant Physiol. .

Abstract

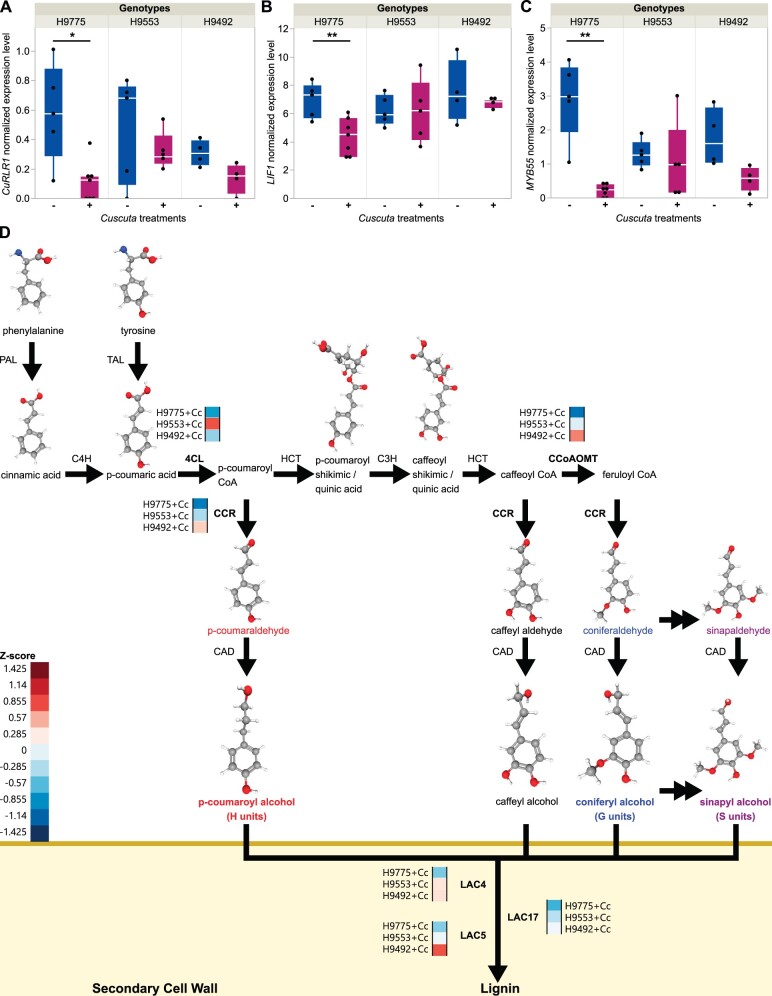
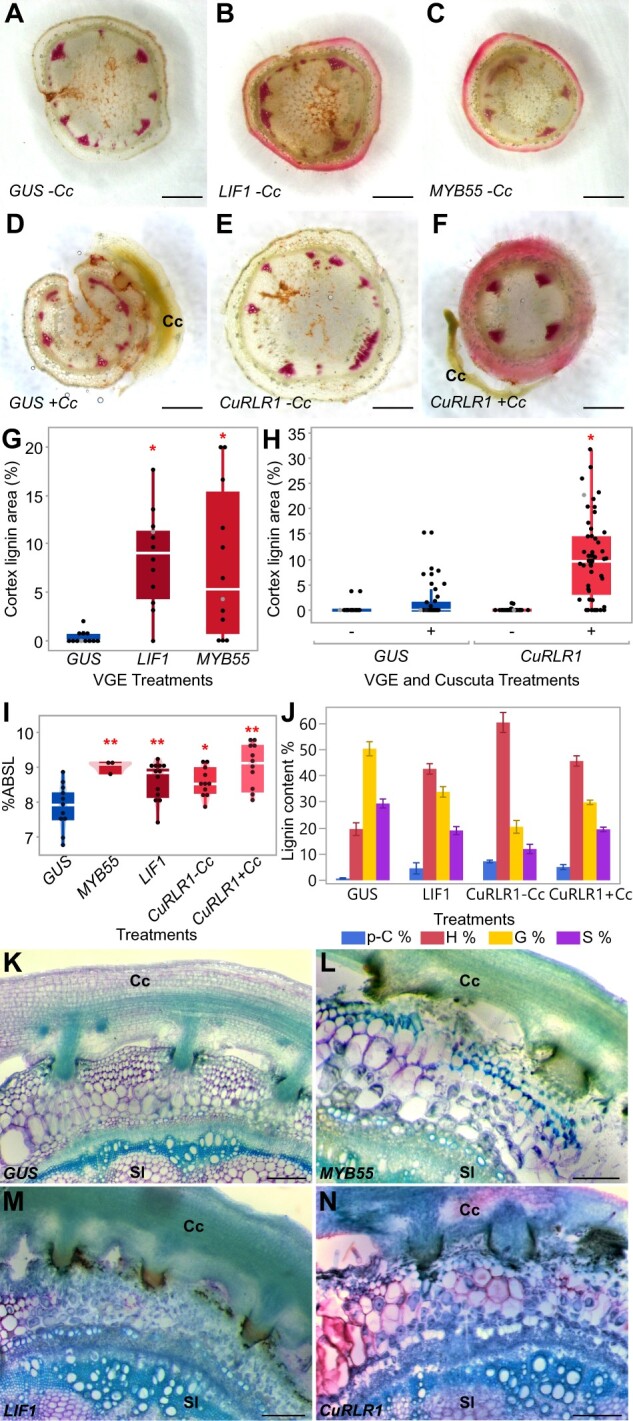
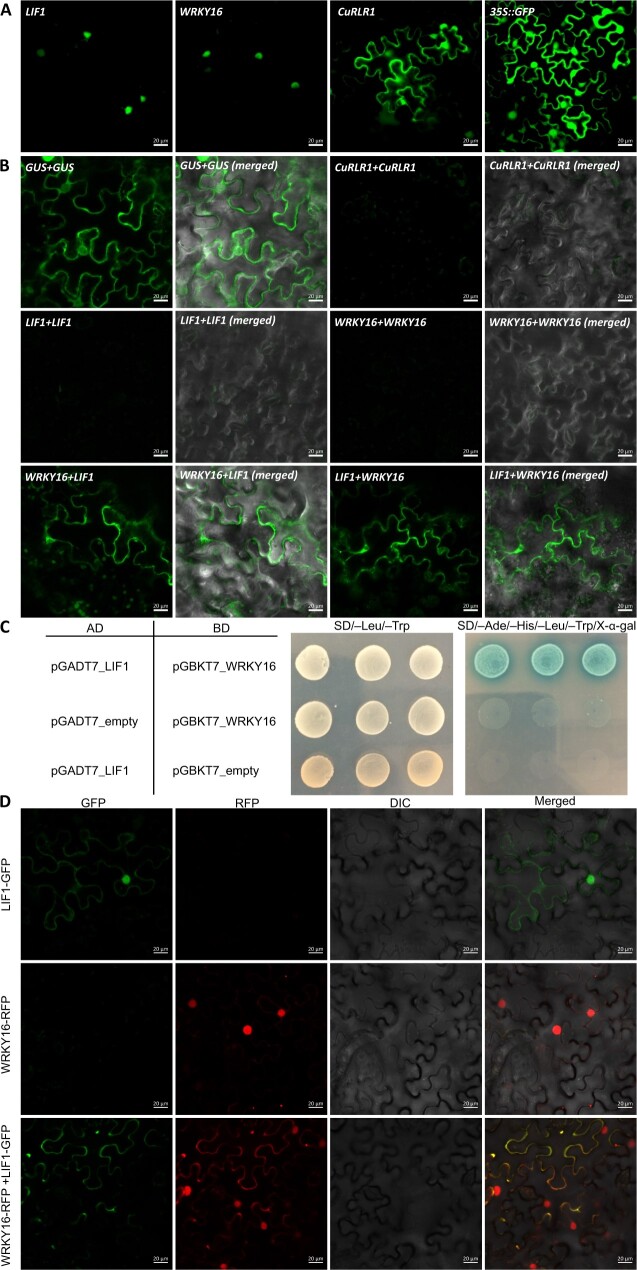
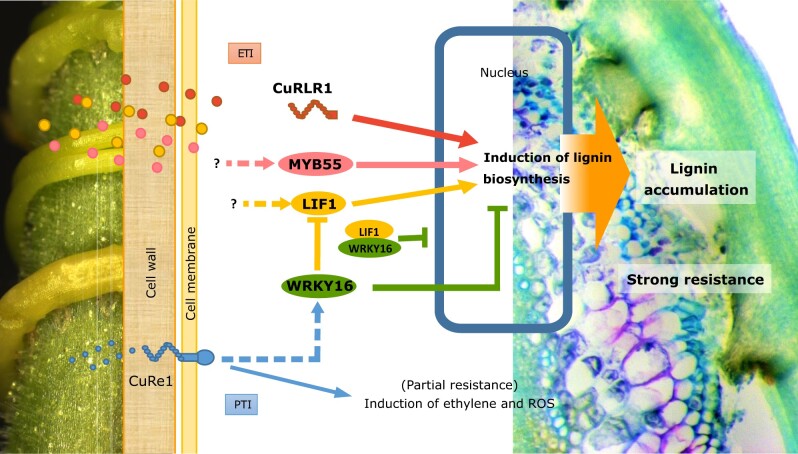
Cuscuta species (dodders) are agriculturally destructive, parasitic angiosperms. These parasitic plants use haustoria as physiological bridges to extract nutrients and water from hosts. Cuscuta campestris has a broad host range and wide geographical distribution. While some wild tomato relatives are resistant, cultivated tomatoes are generally susceptible to C. campestris infestations. However, some specific Heinz tomato (Solanum lycopersicum) hybrid cultivars exhibit resistance to dodders in the field, but their defense mechanism was previously unknown. Here, we discovered that the stem cortex in these resistant lines responds with local lignification upon C. campestris attachment, preventing parasite entry into the host. Lignin Induction Factor 1 (LIF1, an AP2-like transcription factor), SlMYB55, and Cuscuta R-gene for Lignin-based Resistance 1, a CC-NBS-LRR (CuRLR1) are identified as factors that confer host resistance by regulating lignification. SlWRKY16 is upregulated upon C. campestris infestation and potentially negatively regulates LIF1 function. Intriguingly, CuRLR1 may play a role in signaling or function as an intracellular receptor for receiving Cuscuta signals or effectors, thereby regulating lignification-based resistance. In summary, these four regulators control the lignin-based resistance response in specific Heinz tomato cultivars, preventing C. campestris from parasitizing resistant tomatoes. This discovery provides a foundation for investigating multilayer resistance against Cuscuta species and has potential for application in other essential crops attacked by parasitic plants.


Figures

Figure 1
Figure 1
The comparison of resistance responses to C. campestris in tomato cultivars. (A) Cuscuta campestris grows on the susceptible H9775, (B) and cannot attach on the resistant H9553. Yellow arrowhead indicates C. campestris formed successful haustorial attachment. White arrowhead indicates C. campestris haustoria detached and left the scar on the host stem. C, The biomass ratio of host and C. campestris (Cuscuta weight/tomato weight) on different cultivars. Data were assessed using pairwise comparisons with Tukey’s test. Different letters indicate these groups are statistically significant different. P-values between “a” and “b” are <0.05. H1706, n = 9; H9775, n = 10, H9492, n = 10, H9553 n = 7. Data were collected at 45 DPA. D–G, 100-μm vibratome longitudinal sections of C. campestris haustoria attaching to H1706 (D and E) and H9553 (F and G), and stained with Toluidine Blue O. Lignin is stained as blue. Red arrowhead indicates haustorial vascular connections. Cc indicates C. campestris; Sl indicates S. lycopersicum. C, cortex; P, phloem; X, xylem. E and G are zoom-in image of the same section of D and F. D and F, Scale bar, 40 µm. E and G, Scale bar, 10 µm. (H–O) are ∼300 μm sections of the haustoria attachment sites stained with Ph–HCl. Scale bar, 1 mm. Lignin is stained as red. Stem cross-sections of H1706 (H and L), H9775 (I and M), H9492 (J and N), and H9553 (K and O) without C. campestris treatment (labeled with −Cc) and with C. campestris attached (labeled with +Cc). P, Cortex lignin area percentage in different cultivars. Data presented are assessed using multiple comparisons with Dunnett’s test. *P< 0.05, **P < 0.01. Q, Cell death area percentage in different cultivars. P and Q, H1706-Cc, n = 20; H1706+Cc, n = 38; H9775−Cc, n = 19; H9775+Cc, n = 40; H9492−Cc, n = 16; H9492+Cc, n = 38; H9553−Cc, n = 17; H9553+Cc, n = 30. Data were collected at 14 DPA. The data points labeled with gray color indicate the sample that we show in the section picture (H–I). C, P, and Q, The boxplot consists of a box extending from the 25th quantile to the 75th quantile. The centerline in the box indicates the median. The length of the box is the interquartile range (IQR), which is the difference between the 25th quantile and the 75th quantile. The whiskers extend from the ends of the box to the outermost data point that falls within 1.5 times of IQR. Points outside of the whiskers are outliers.
Figure 2
Figure 2
Key candidate genes and lignin biosynthesis genes that display expression changes upon C. campestris infestation. A–C, The normalized expressions levels (CPM, counts per million) of genes in susceptible cultivar H9775 and in resistant hybrid cultivar H9553 and H9492 under C. campestris infestation. – and + indicates without or with C. campestris infection treatments, respectively. Biologically independent replicates: RNA-seq libraries: H9775−Cc, n = 5; H9775+Cc, n = 7; H9492−Cc, n = 4; H9492+Cc, n = 4; H9553−Cc, n = 5; H9553+Cc, n = 5. Data are assessed using two-tailed t test. *P < 0.04, **P < 0.01, ***P < 0.005. The boxplot consists of a box extending from the 25th quantile to the 75th quantile. The centerline in the box indicates the median. The length of the box is the IQR, which is the difference between the 25th quantile and the 75th quantile. The whiskers extend from the ends of the box to the outermost data point that falls within 1.5 times of IQR. Points outside of the whiskers are outliers. D, The lignin biosynthesis pathway with key enzyme expression levels. Genes that are differentially expressed were selected and the normalized expression values across three cultivars were color coded according to z-score. + Cc indicates with C. campestris infection treatments. TAL, tyrosine ammonia-lyase; 4CL, 4-coumarate CoA ligase; HCT, hydroxycinnamoyl-CoA shikimate/Quinate hydroxycinnamoyltransferase; C3H, p-coumarate 3-hydroxylase; CCoAOMT, caffeoyl-CoA O-methyltransferase; CCR, cinnamoyl-CoA reductase; CAD, cinnamyl alcohol dehydrogenase; LAC, laccase. 3D structure images of phenylalanine, tyrosine, cinnamic acid, p-coumaric acid, p-coumaroyl shikimic acid, caffeoyl shikimic acid, p-coumaraldehyde, p-coumaryl alcohol, caffeyl aldehyde, caffeyl alcohol, coniferaldehyde, coniferyl alcohol, sinapaldehyde, and sinapyl alcohol are from PubChem (National Center for Biotechnology Information, 2021a, 2021b, 2021c, 2021d, 2021e, 2021f, 2021g, 2021h, 2021i, 2021j, 2021k, 2021l, 2021m, 2021n).
Figure 3
Figure 3
VGE in tomato H1706. A–F, ∼300-μm stem sections near injection sites, Ph–HCl stains lignin red. Scale bar, 1 mm. VGE of GUS (A), LIF1 (B), SlMYB55 (C), and CuRLR1 (E) in stem without C. campestris. VGE of GUS (D) and CuRLR1 (F) with C. campestris. G, Cortex lignin area percentage in VGE of LIF1 and SlMYB55 (n = 12 each) and H, CuRLR1 with and without C. campestris (GUS-Cc, n = 18; GUS+Cc, n = 28; CuRLR1−Cc, n = 47; CuRLR1+Cc, n = 53). G and H, Data were collected at 7-d post injection (DPI) and 14 DPA. Data are assessed using Dunnett’s test with GUS−Cc as negative control. *P < 0.01. The data points labeled with grey color indicate the sample that we show in the section picture (A–F). I, Acetyl bromide assay for lignin in VGE stems. Acetyl bromide soluble lignin (ABSL) indicates percent absorbance of soluble lignin. Samples were collected at 7 DPI and 6 DPA. Data are assessed using Dunnett’s test. *P <0.05, **P <0.01. Biological replicates for GUS, n = 18; SlMYB55, n = 10; LIF1, n = 18, CuRLR1-Cc, n = 18; CuRLR1+Cc, n = 18. Technical replicates for acetyl bromide assay; GUS, n = 11; SlMYB55, n = 3; LIF1, n = 13; CuRLR1−Cc, n = 11; CuRLR1+Cc, n = 11. G–I, The boxplot consists of a box extending from the 25th quantile to the 75th quantile. The centerline in the box indicates the median. The length of the box is the IQR, which is the difference between the 25th quantile and the 75th quantile. The whiskers extend from the ends of the box to the outermost data point that falls within 1.5 times of IQR. Points outside of the whiskers are outliers. J, Pyro-GC assay for monolignols in CuRLR1 VGE samples with and without C. campestris. p-C, p-coumaric acid; H, H types of (p-coumaryl alcohol); G, G types of monolignol (coniferyl alcohol); S, S types of monolignol (sinapyl alcohol). Samples were collected at 7 DPI and 6 DPA. Biological replicates collected from first internodes; GUS, n = 8; LIF1, n = 8, CuRLR1-Cc, n = 18; CuRLR1+Cc, n = 18. Pyro-GC assay technical replicates; GUS, n = 3; LIF1, n = 3; CuRLR1-Cc, n = 5; CuRLR1+Cc, n = 5. K–N, VGE of CuRLR1, LIF1 and SlMYB55 induces cortical lignin making H1706 resistant to C. campestris. Scale bar, 30 µm. Samples were collected at 7 DPI and 6 DPA. Cc indicates C. campestris; Sl indicates S. lycopersicum.
Figure 4
Figure 4
BH t-SNE generated gene clusters and GCN analysis. A, BH t-SNE generated gene clusters based on their gene expression patterns. Total cluster (module) number was 48. Different colors indicate different clusters. B, The candidate genes that are included in the clusters are labeled with their corresponding colors. The selected gene clusters for GCN are labeled in yellow (CuRe1 and WRKY16 cluster, cluster 17), red (CCOMT and LAC cluster, cluster 11), blue (MYB55 cluster, cluster 39), pink (LIF1 cluster, cluster 46), green (CCR cluster, cluster 23) colors. CuRLR1 is in the noise cluster, and is labeled in gray color. Parameters used in this analysis: perplexity (perp) = 20, lying = 250, cutoff = 20, seed = 2. C–F, GCNs of four different Heinz susceptible and resistant cultivars upon C. campestris treatments. S indicates susceptible; R indicates resistant. Based on BH t-SNE analysis, 1,676 genes in cluster 11, 17, 23, 39, 46, and CuRLR1 were selected for building GCNs. +Cc indicates with C. campestris infection treatments. Different colors of the nodes indicate different modules based on GCN community structure. The genes that are listed at the left of the GCN and not labeled in the network are the genes that have no coexpression connections with all the other genes in the list.
Figure 5
Figure 5
The role of SlWRKY16 in Cuscuta resistance using CRISPR/Cas9 gene knockouts. A and B, Normalized CuRel and SlWRKY16 expression level from RNA-seq data (CPM, counts per million) in different Heinz cultivars with/without Cuscuta treatments. Biologically independent replicates: RNA-seq libraries, H1706-Cc, n = 7; H1706+Cc, n = 7; H9775−Cc, n = 5; H9775+Cc, n = 7; H9492−Cc, n = 5; H9492+Cc, n = 4; H9553−Cc, n = 5; H9553+Cc, n = 5. Data are assessed using one-tailed t test. *P <0.05, ***P <0.005. C–J, Samples and data were collected at 7 DPA. C and D, Overall phenotype comparison between M82 and homozygous SlWRKY16 CRISPR lines (wrky16). Scale bar, 2 cm. E and F, Cuscuta campestris growing on M82 and wrky16. Scale bar, 2 mm. G and H, ∼300-μm hand sections of M82 and wrky16 stems near Cuscuta attachment site stained with Ph–HCl. Lignin is stained red. Cc indicates C. campestris; Sl indicates S. lycopersicum. Scale bar, 1 mm. I, Leaf number of wrky16 and M82. Biological replicates, n = 18 for each. J, Cortex lignin area percentage in M82 and wrky16 stems. Data presented are assessed using Student’s t test. ***P<0.001. Replicates: M82, n = 33; wrky16, n = 34. A, B, I, and J, The boxplot consists of a box extending from the 25th quantile to the 75th quantile. The centerline in the box indicates the median. The length of the box is the IQR, which is the difference between the 25th quantile and the 75th quantile. The whiskers extend from the ends of the box to the outermost data point that falls within 1.5 times of IQR. Points outside of the whiskers are outliers.
Figure 6
Figure 6
Subcellular localization of candidate genes and protein–protein interactions. A, Subcellular localizations of LIF1, SlWRKY16, and CuRLR1 proteins. B, Verification of protein–protein interactions and locations of SlWRKY16 and LIF1 by BiFC. The gene with cCitrine fusion is listed before the “+” sign and the gene with nCitrine fusion is listed after the “+” sign. C, Yeast two-hybrid (Y2H) results for interaction between LIF1 and SlWRKY16. The plasmids with GAL4 activation domain (AD) and GAL4 DNA binding domain (BD) were co-transformed to yeast AH109 competent cells. Transformed yeast cells were screened on SD/–Leu/–Trp medium plates to select successful co-transformants and then assayed by culturing on high-stringency SD/–Ade/–His/–Leu/–Trp medium plates with 40 μg·mL−1 X-α-Gal. The positive protein–protein interactions between LIF1 and SlWRKY16 are indicated by growth on SD/–Ade/–His/–Leu/–Trp/X-α-Gal medium plates and blue colony color. D, Co-expression of fusion protein LIF1-GFP and SlWRKY16-RFP to observe subcellular localizations. Yellow color in the merged panel indicates that GFP and RFP signals are overlapped. Scale bars for A, B, D: 20 µm.
Figure 7
Figure 7
Model of C. campestris resistance response in tomato cultivars. Red-labeled pathway: identified cytosolic CuRLR1, which may receive large signaling molecules from C. campestris or play a role in signal transduction upon Cuscuta perception. This triggers downstream signal transduction and induces a lignin-based resistance response. This resistant response may be an ETI. Pink- and yellow-labeled pathway: SlMYB55 and LIF1 function as positive regulators in the lignin biosynthesis pathway. Yellow- and green-labeled pathway: SlWRKY16- and LIF1-mediated lignin-based resistant responses and with a potential connection to CuRe1. Blue-labeled pathway: previously identified CuRe1-mediated PAMP/MAMP-triggered immunity pathway. ROS, reactive oxygen species.

Similar articles

Cited by

References

    1. Adcock IM, Caramori G (2009) Transcription factors. In Barnes PJ, Drazen JM, Rennard SI, Thomson NC, eds, Asthma and COPD, Ed 2. Academic Press, Oxford, pp 373–380
    1. Agrios GN (2005) Plant diseases caused by parasitic higher plants, invasive climbing plants, and parasitic green algae. In Plant Pathology, Ed 5. Academic Press, San Diego, pp 705–722
    1. Ashton FM (1976) Cuscuta Spp. (Dodder): A Literature Review of Its Biology and Control. Division of Agricultural Sciences, University of California, Issues pp 1872–1890
    1. Barnes WJ, Anderson CT (2017) Acetyl bromide soluble lignin (ABSL) assay for total lignin quantification from plant biomass. Bio-protocol 7: e2149. - PMC - PubMed
    1. Barros J, Serk H, Granlund I, Pesquet E (2015) The cell biology of lignification in higher plants. Ann Bot 115: 1053–1074 - PMC - PubMed