

Estimation of Changes in Intracardiac Hemodynamics Using Wearable Seismocardiography and Machine Learning in Patients With Heart Failure: A Feasibility Study
- PMID: 35100106
- PMCID: PMC9347221
- DOI: 10.1109/TBME.2022.3147066
Estimation of Changes in Intracardiac Hemodynamics Using Wearable Seismocardiography and Machine Learning in Patients With Heart Failure: A Feasibility Study
Abstract
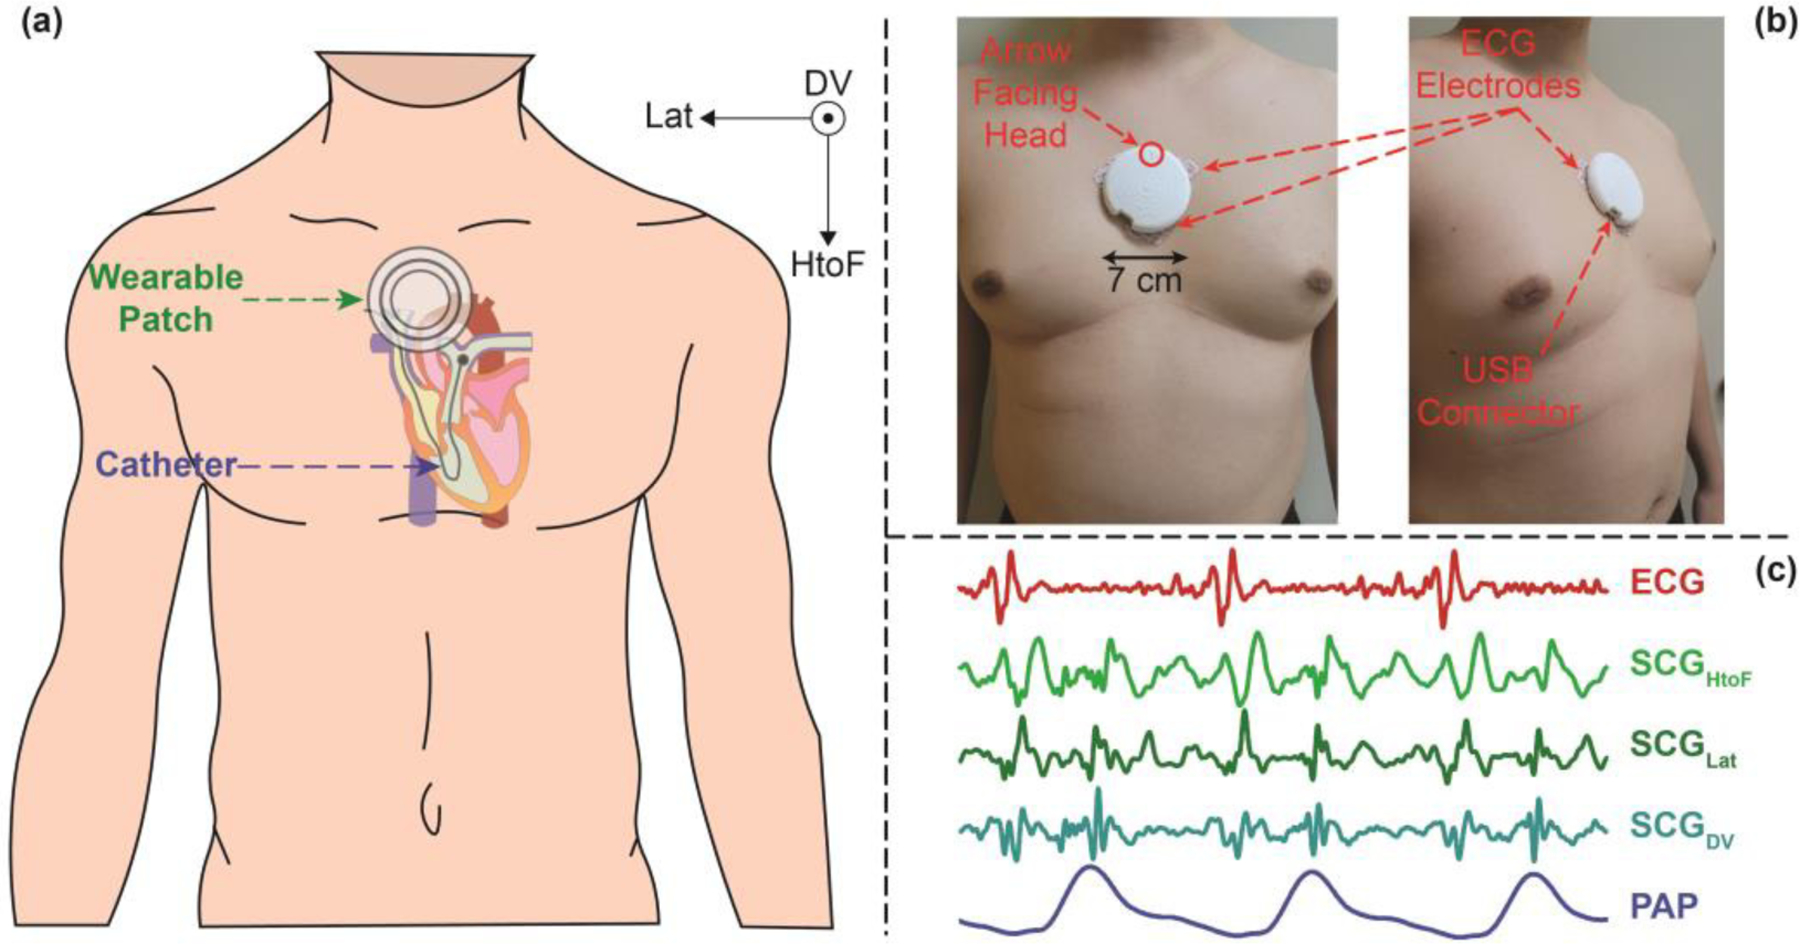
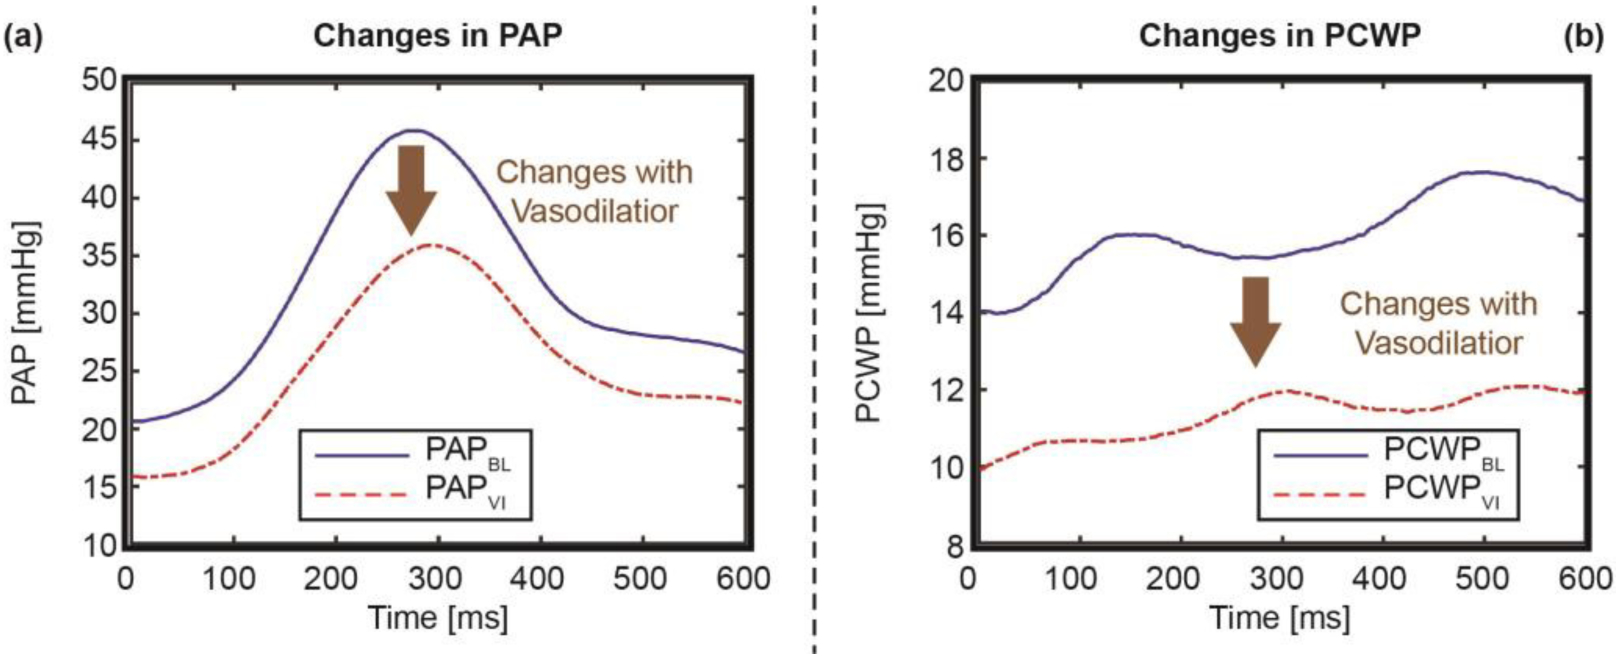
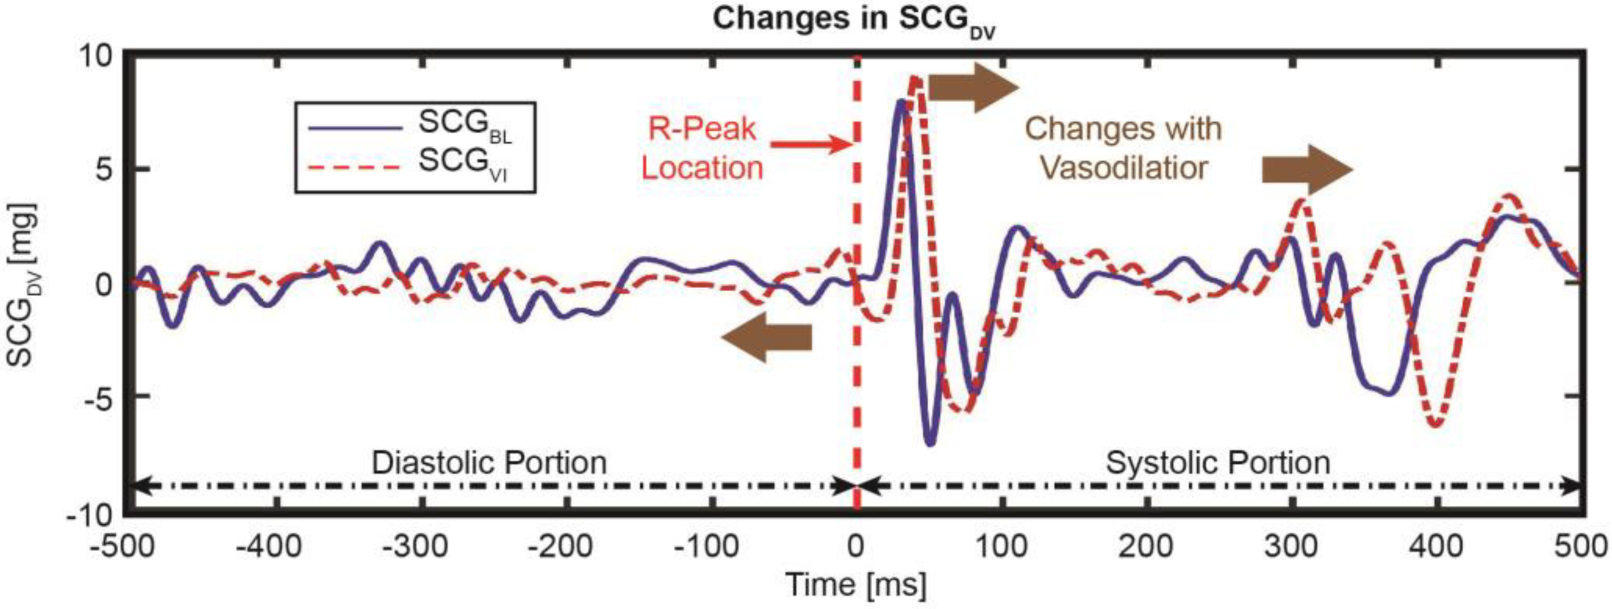
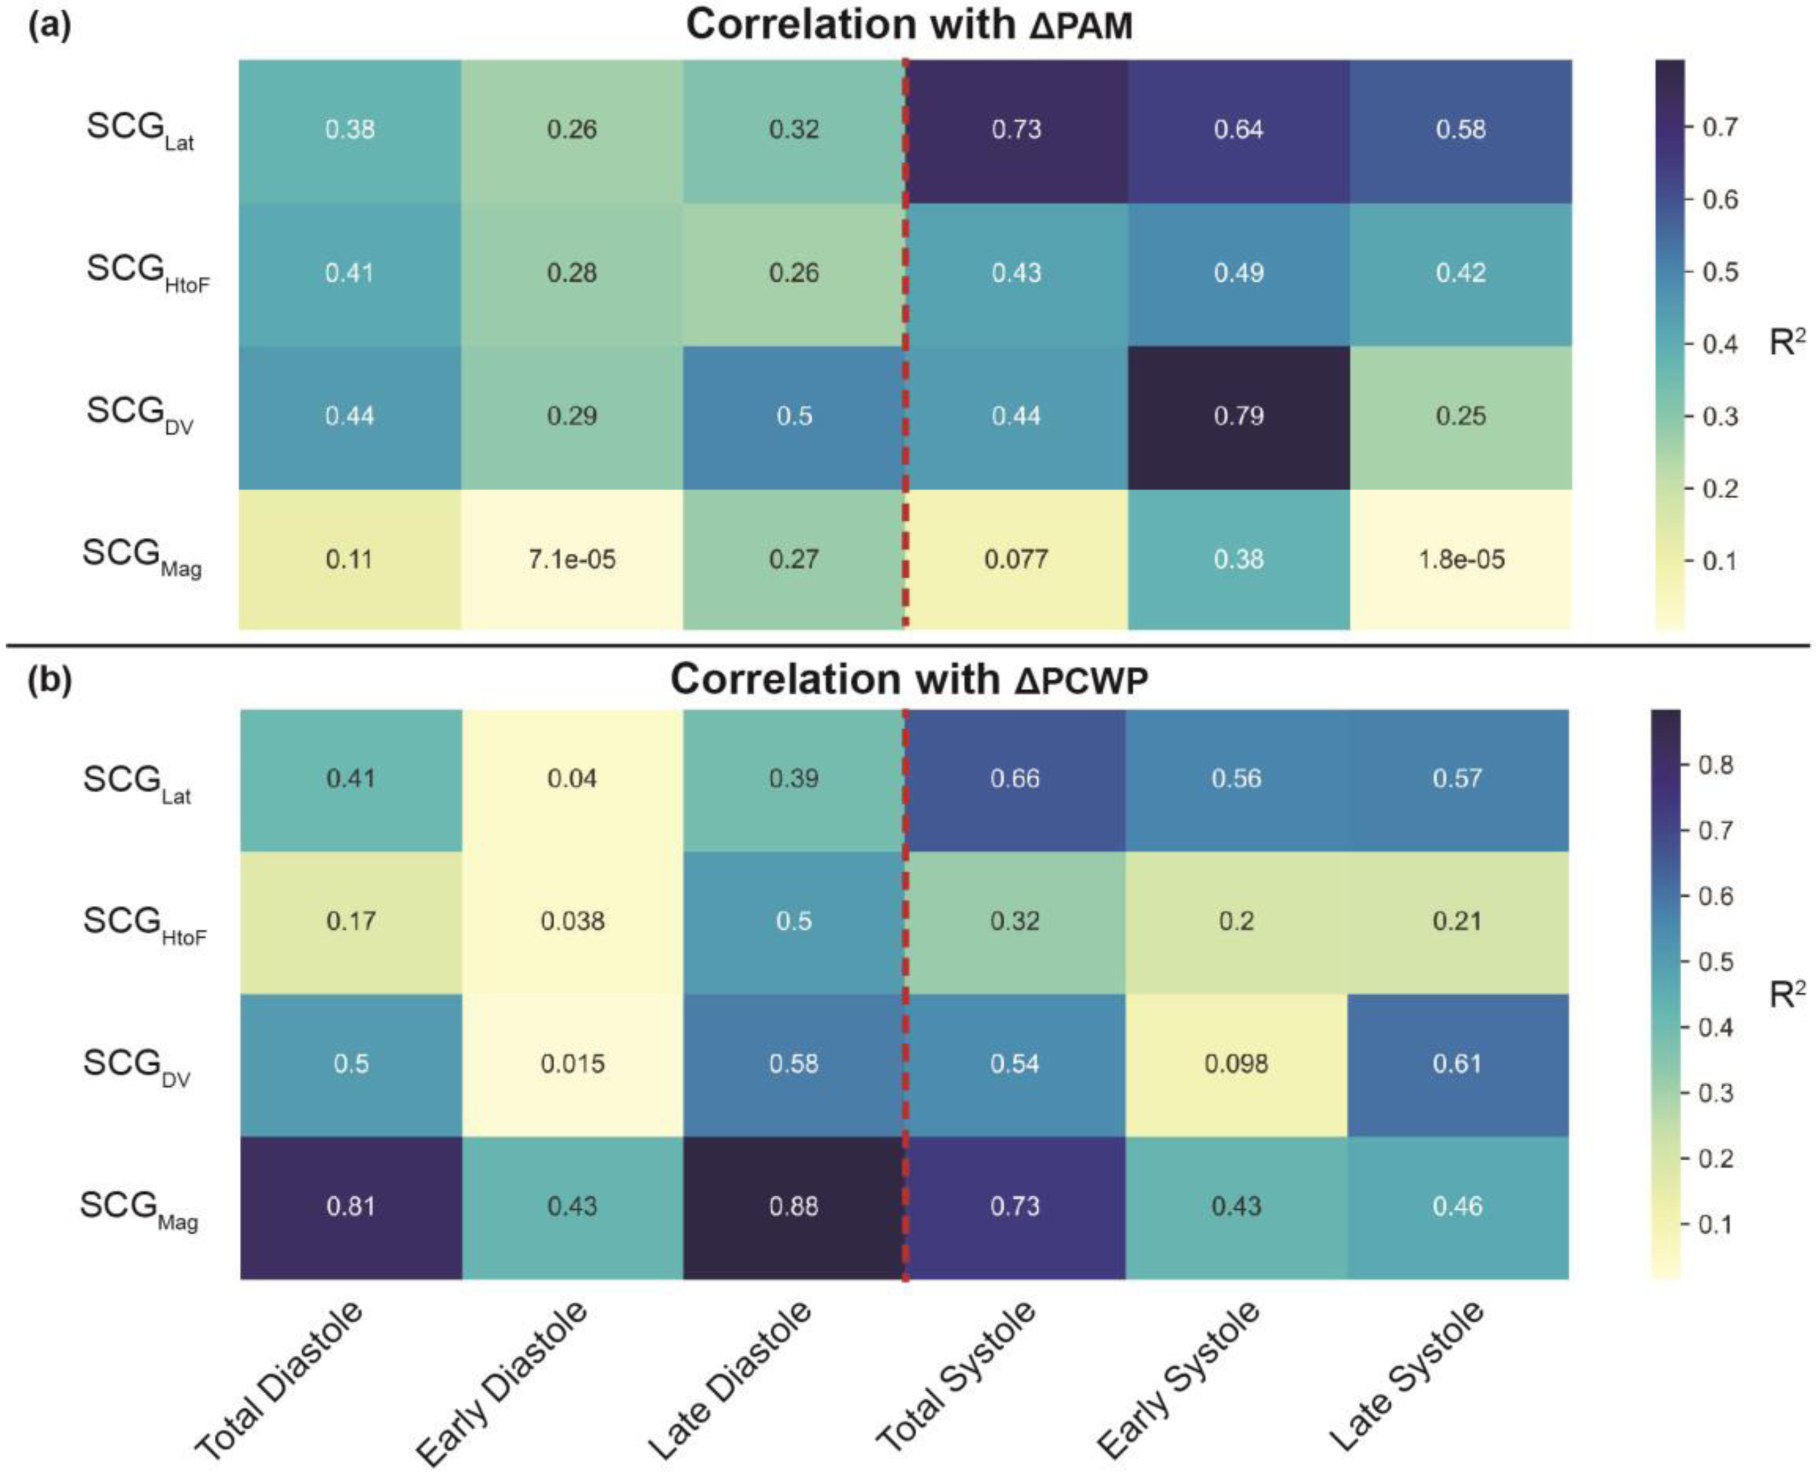
Objective: Tracking changes in hemodynamic congestion and the consequent proactive readjustment of treatment has shown efficacy in reducing hospitalizations for patients with heart failure (HF). However, the cost-prohibitive nature of these invasive sensing systems precludes their usage in the large patient population affected by HF. The objective of this research is to estimate the changes in pulmonary artery mean pressure (PAM) and pulmonary capillary wedge pressure (PCWP) following vasodilator infusion during right heart catheterization (RHC), using changes in simultaneously recorded wearable seismocardiogram (SCG) signals captured with a small wearable patch.
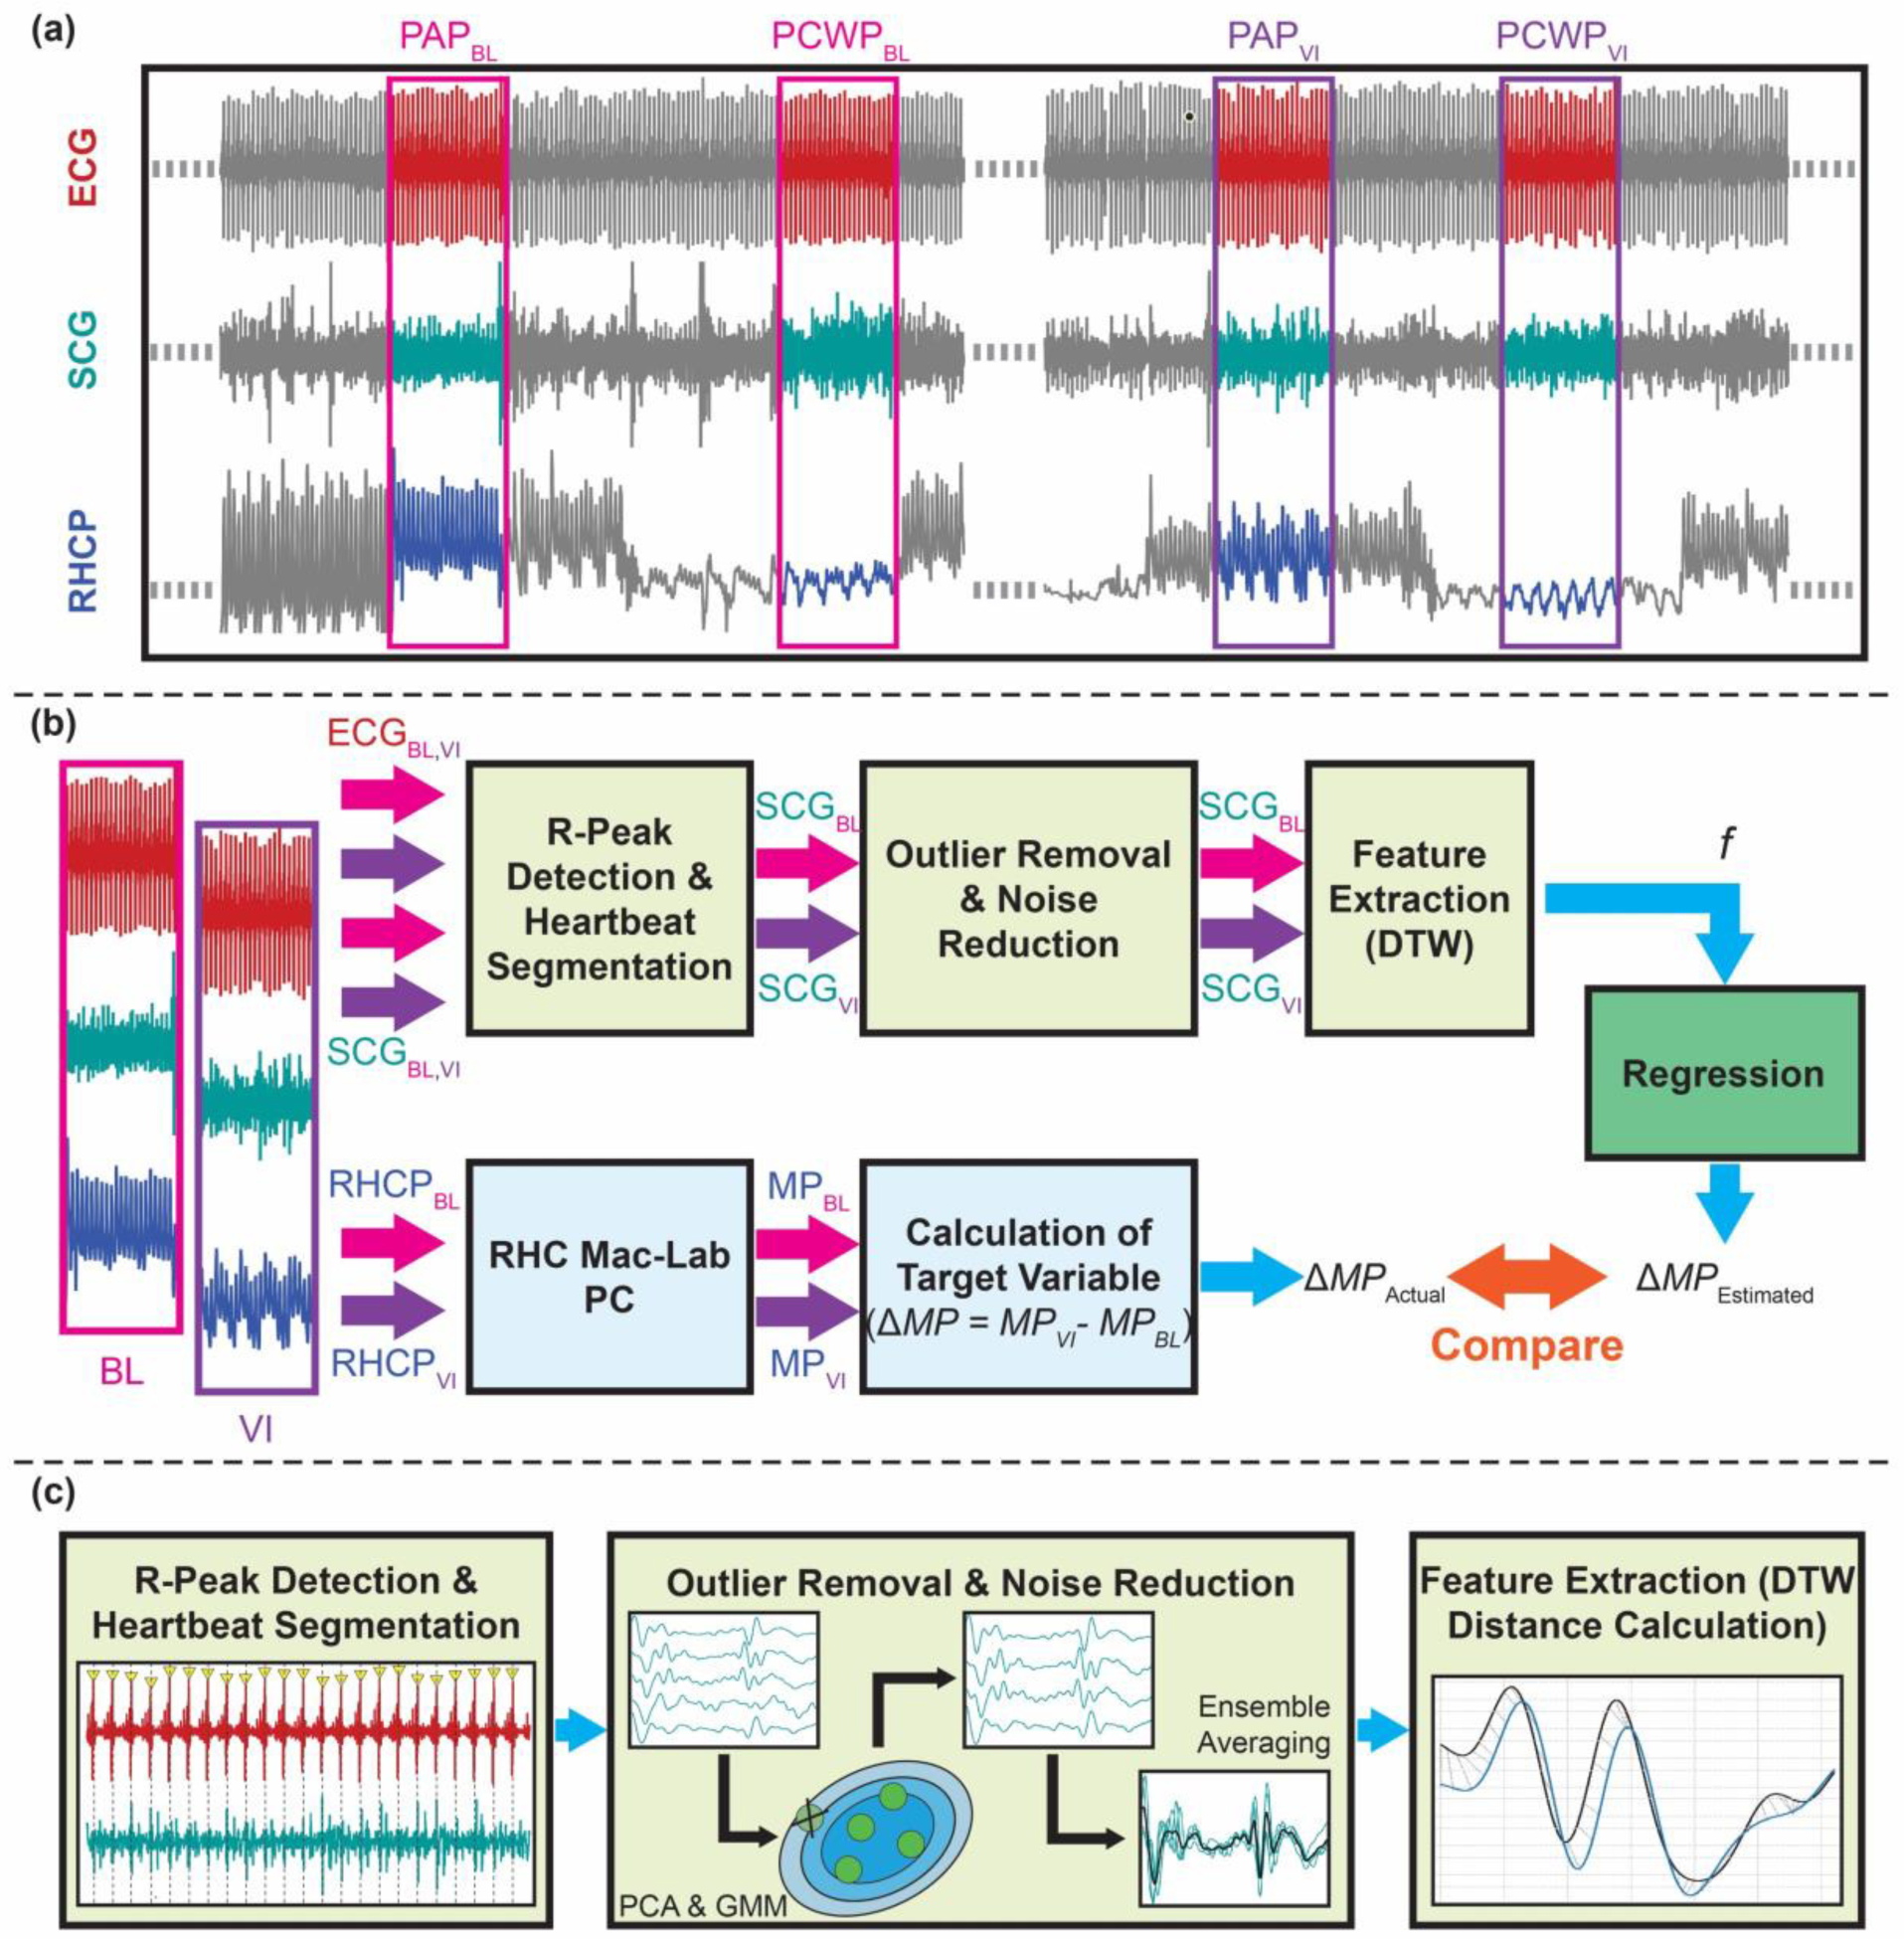
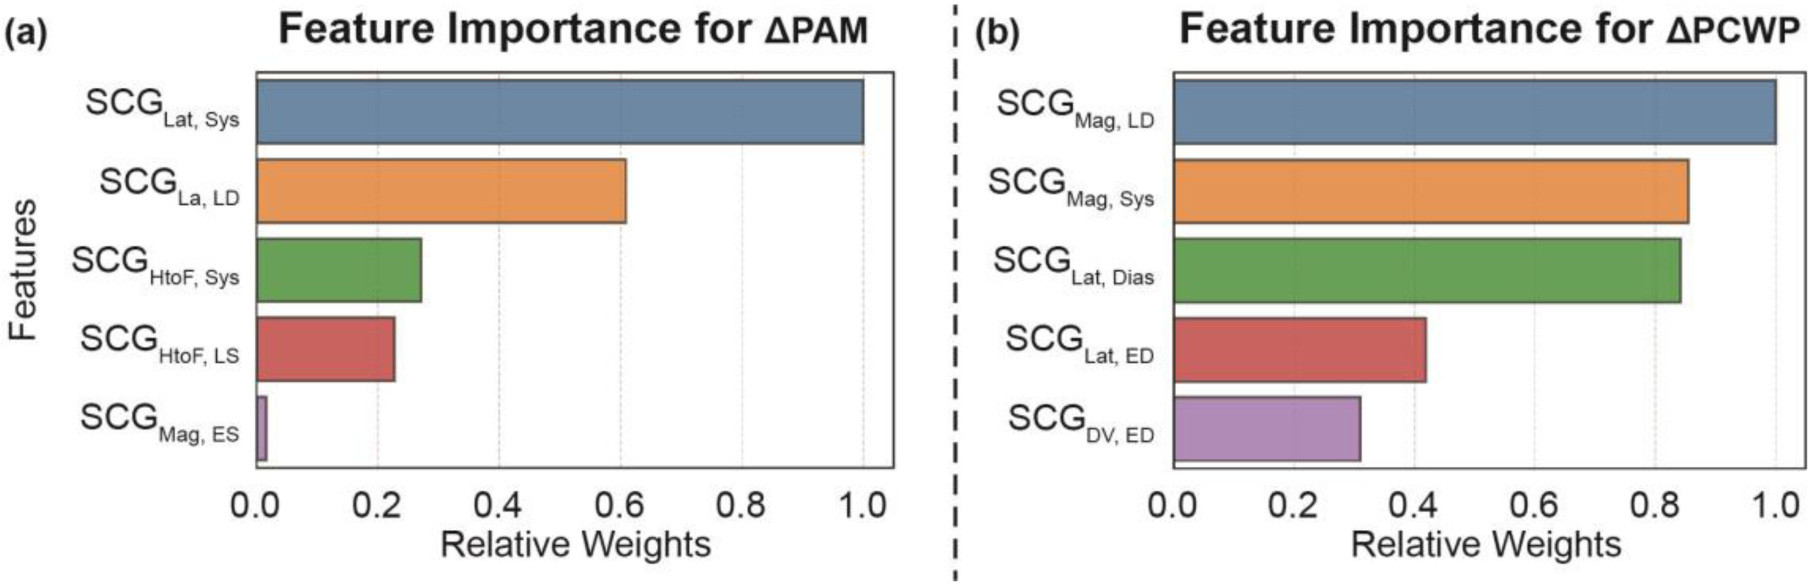
Methods: A total of 20 patients with HF (20% women, median age 55 (interquartile range (IQR), 44-64) years, ejection fraction 24 (IQR, 16-43)) were fitted with a wearable sensing patch and underwent RHC with vasodilator challenge. We divided the dataset randomly into a training-testing set (n = 15) and a separate validation set (n = 5). We developed globalized (population) regression models to estimate changes in PAM and PCWP from the changes in simultaneously recorded SCG.
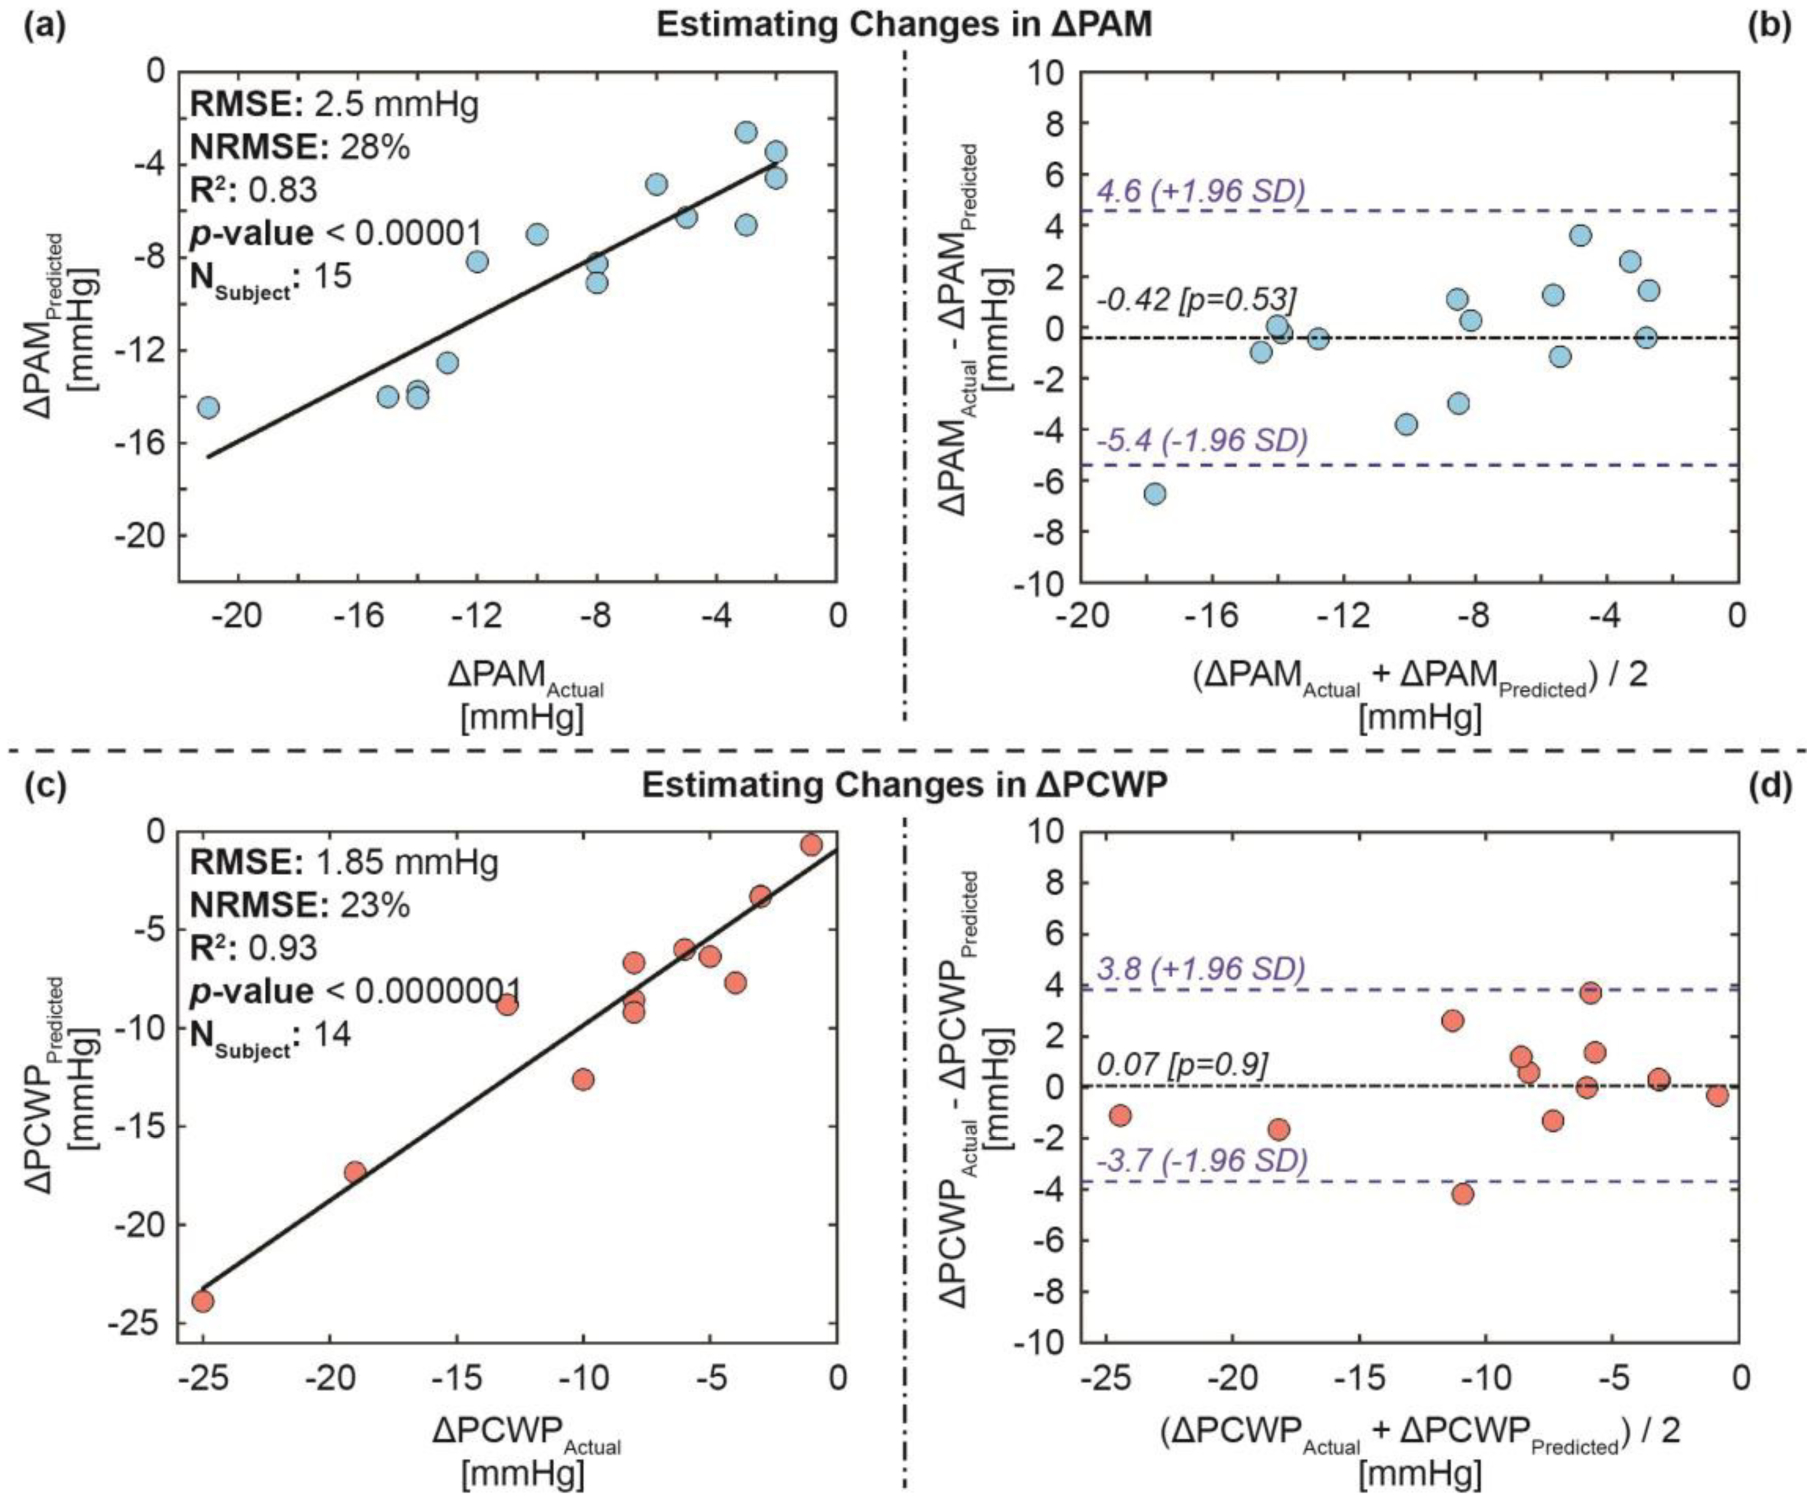
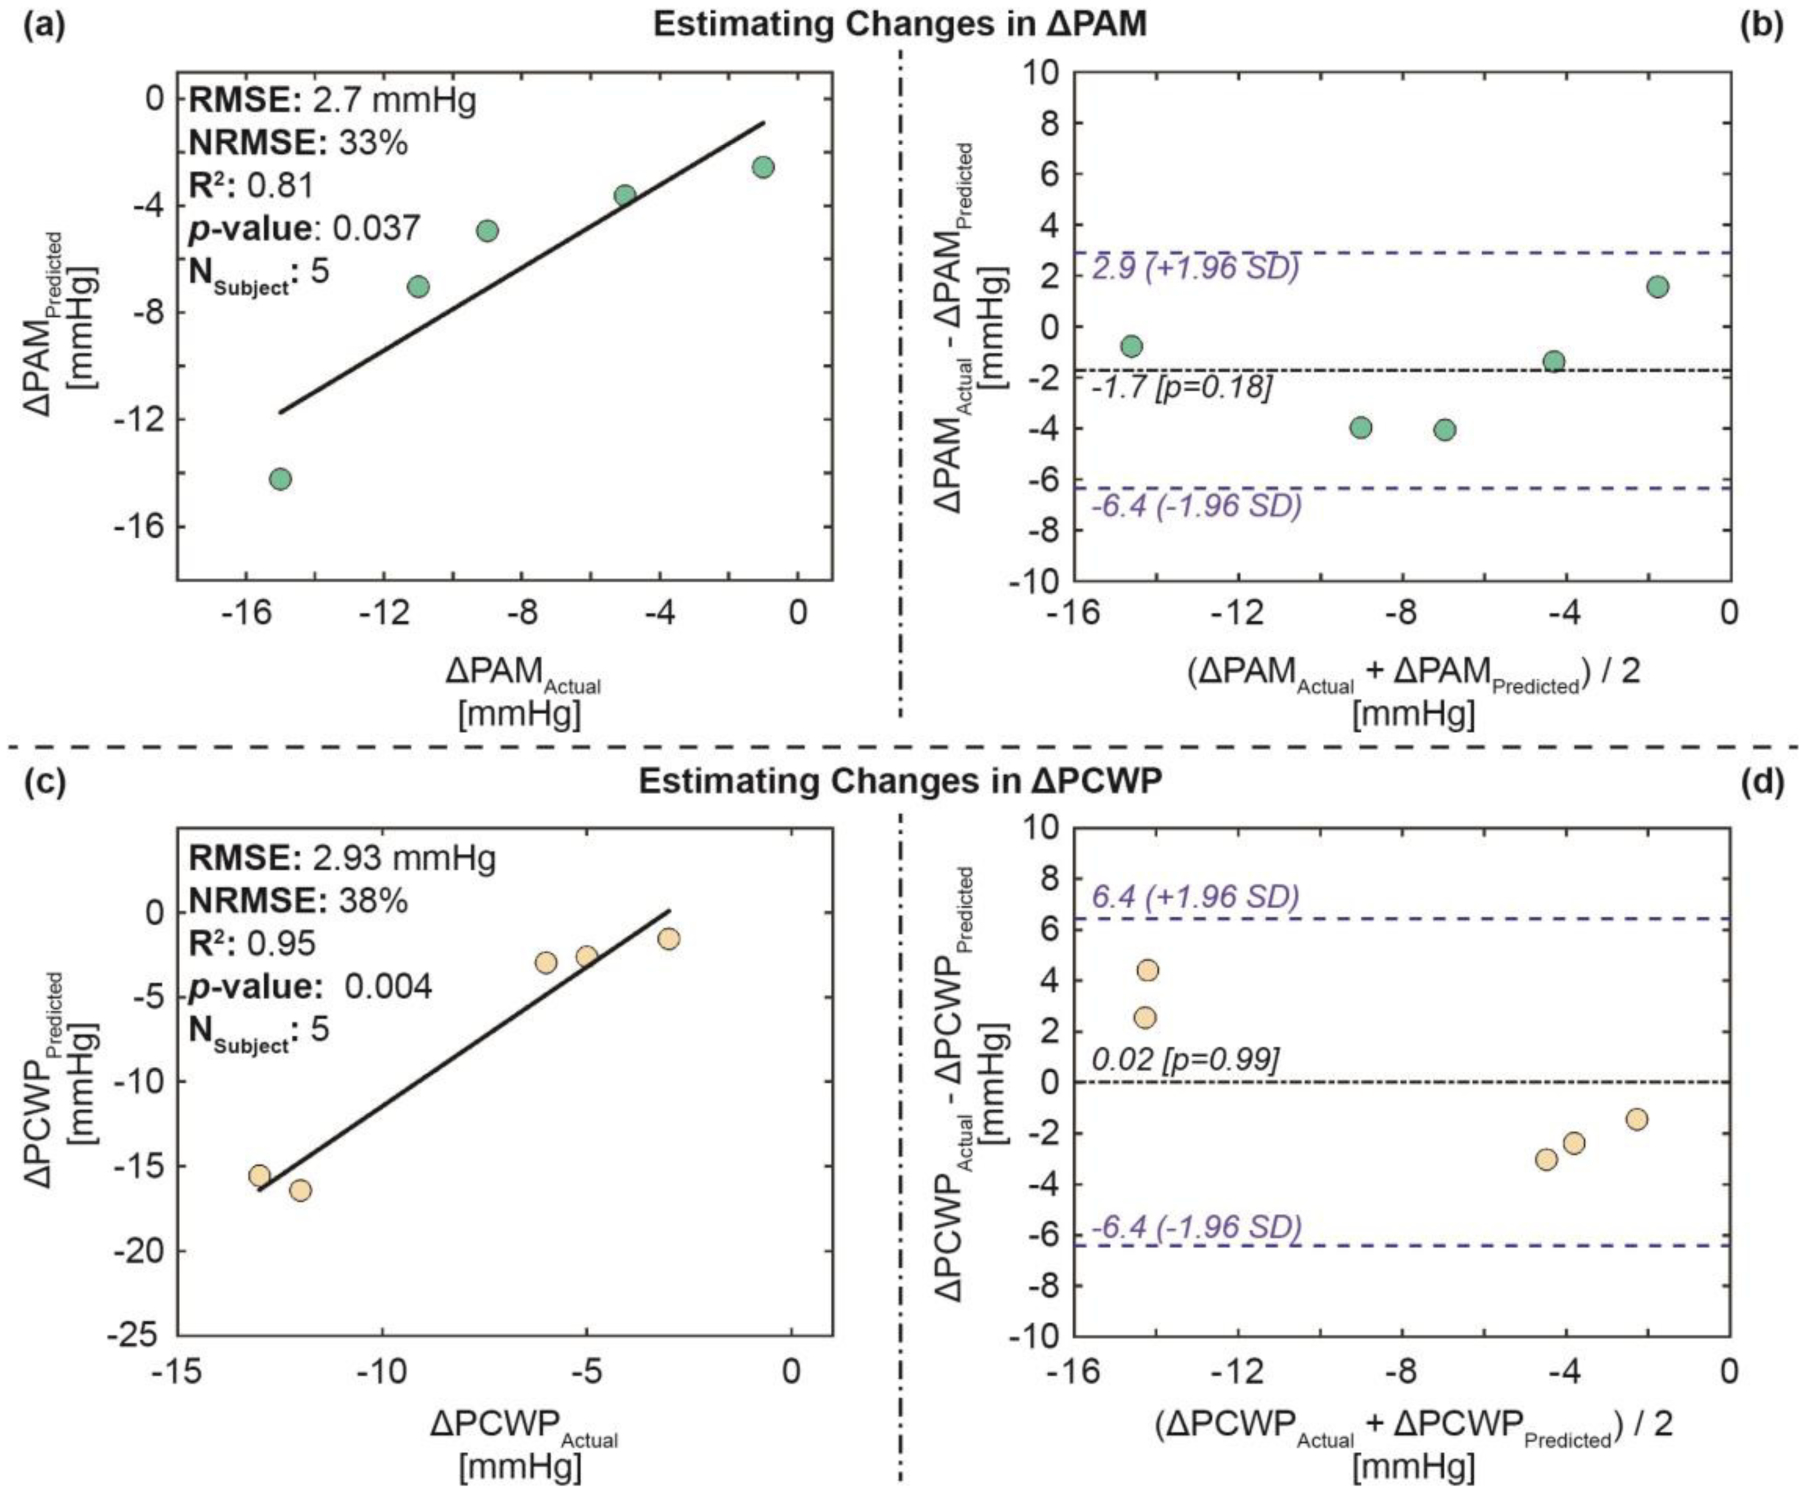
Results: The regression model estimated both pressures with good accuracies: root-mean-square-error (RMSE) of 2.5 mmHg and R2 of 0.83 for estimating changes in PAM, and RMSE of 1.9 mmHg and R2 of 0.93 for estimating changes in PCWP for the training-testing set, and RMSE of 2.7 mmHg and R2 of 0.81 for estimating changes in PAM, and RMSE of 2.9 mmHg and R2 of 0.95 for estimating changes in PCWP for the validation set respectively.
Conclusion: Changes in wearable SCG signals may be used to track acute changes in intracardiac hemodynamics in patients with HF.
Significance: This method holds promise in tracking longitudinal changes in hemodynamic congestion in hemodynamically-guided remote home monitoring and treatment for patients with HF.
Figures
Similar articles
-
Noninvasive Pulmonary Capillary Wedge Pressure Estimation in Heart Failure Patients With the Use of Wearable Sensing and AI.JACC Heart Fail. 2025 Aug;13(8):102513. doi: 10.1016/j.jchf.2025.102513. Epub 2025 Jun 20. JACC Heart Fail. 2025. PMID: 40542792
-
Wearable Patch-Based Estimation of Oxygen Uptake and Assessment of Clinical Status during Cardiopulmonary Exercise Testing in Patients With Heart Failure.J Card Fail. 2020 Nov;26(11):948-958. doi: 10.1016/j.cardfail.2020.05.014. Epub 2020 May 27. J Card Fail. 2020. PMID: 32473379 Free PMC article.
-
Novel Wearable Seismocardiography and Machine Learning Algorithms Can Assess Clinical Status of Heart Failure Patients.Circ Heart Fail. 2018 Jan;11(1):e004313. doi: 10.1161/CIRCHEARTFAILURE.117.004313. Circ Heart Fail. 2018. PMID: 29330154 Free PMC article.
-
Decongestion Models and Metrics in Acute Heart Failure: ESCAPE Data in the Age of the Implantable Cardiac Pressure Monitor.Tex Heart Inst J. 2022 Jul 1;49(4):e217587. doi: 10.14503/THIJ-21-7587. Tex Heart Inst J. 2022. PMID: 36001949 Free PMC article.
-
Hemodynamic Monitoring Devices in the Management of Outpatient Heart Failure.J Soc Cardiovasc Angiogr Interv. 2023 Dec 4;2(6Part B):101186. doi: 10.1016/j.jscai.2023.101186. eCollection 2023 Nov-Dec. J Soc Cardiovasc Angiogr Interv. 2023. PMID: 39131070 Free PMC article. Review.
Cited by
-
Accurate Modeling of Ejection Fraction and Stroke Volume With Mobile Phone Auscultation: Prospective Case-Control Study.JMIR Cardio. 2024 Jun 26;8:e57111. doi: 10.2196/57111. JMIR Cardio. 2024. PMID: 38924781 Free PMC article.
-
A Wavelet-Based Approach for Motion Artifact Reduction in Ambulatory Seismocardiography.IEEE J Transl Eng Health Med. 2024 Feb 20;12:348-358. doi: 10.1109/JTEHM.2024.3368291. eCollection 2024. IEEE J Transl Eng Health Med. 2024. PMID: 38606390 Free PMC article.
-
Non-contact heart vibration measurement using computer vision-based seismocardiography.Sci Rep. 2023 Jul 21;13(1):11787. doi: 10.1038/s41598-023-38607-7. Sci Rep. 2023. PMID: 37479720 Free PMC article.
-
Non-invasive heart failure monitoring: leveraging smart scales and digital biomarkers to improve heart failure outcomes.Heart Fail Rev. 2024 Sep;29(5):1145-1156. doi: 10.1007/s10741-024-10426-6. Epub 2024 Jul 23. Heart Fail Rev. 2024. PMID: 39039364 Review.
-
Application of Telemedicine in the Management of Cardiovascular Diseases: A Focus on Heart Failure.Rev Cardiovasc Med. 2025 Jul 1;26(6):37835. doi: 10.31083/RCM37835. eCollection 2025 Jun. Rev Cardiovasc Med. 2025. PMID: 40630466 Free PMC article. Review.
References
-
- Adamson PB, “Pathophysiology of the transition from chronic compensated and acute decompensated heart failure: new insights from continuous monitoring devices,” Current heart failure reports, vol. 6, no. 4, p. 287, 2009. - PubMed
-
- Zile MR et al., “Hemodynamic factors associated with acute decompensated heart failure: part 1—insights into pathophysiology,” Journal of cardiac failure, vol. 17, no. 4, pp. 282–291, 2011. - PubMed
-
- Adamson PB et al., “Hemodynamic factors associated with acute decompensated heart failure: part 2—use in automated detection,” Journal of cardiac failure, vol. 17, no. 5, pp. 366–373, 2011. - PubMed
-
- Abraham WT et al., “Wireless pulmonary artery haemodynamic monitoring in chronic heart failure: a randomised controlled trial,” The Lancet, vol. 377, no. 9766, pp. 658–666, 2011. - PubMed
-
- Abraham WT et al., “Sustained efficacy of pulmonary artery pressure to guide adjustment of chronic heart failure therapy: complete follow-up results from the CHAMPION randomised trial,” The Lancet, vol. 387, no. 10017, pp. 453–461, 2016. - PubMed
Publication types
MeSH terms
Substances
Grants and funding
LinkOut - more resources
Full Text Sources
Medical
Research Materials
Miscellaneous
