. 2022 Jan 31;18(1):e1010029.
doi: 10.1371/journal.pgen.1010029. eCollection 2022 Jan.

Redundant neural circuits regulate olfactory integration

Affiliations

Redundant neural circuits regulate olfactory integration

Wenxing Yang et al. PLoS Genet. .

Abstract

Olfactory integration is important for survival in a natural habitat. However, how the nervous system processes signals of two odorants present simultaneously to generate a coherent behavioral response is poorly understood. Here, we characterize circuit basis for a form of olfactory integration in Caenorhabditis elegans. We find that the presence of a repulsive odorant, 2-nonanone, that signals threat strongly blocks the attraction of other odorants, such as isoamyl alcohol (IAA) or benzaldehyde, that signal food. Using a forward genetic screen, we found that genes known to regulate the structure and function of sensory neurons, osm-5 and osm-1, played a critical role in the integration process. Loss of these genes mildly reduces the response to the repellent 2-nonanone and disrupts the integration effect. Restoring the function of OSM-5 in either AWB or ASH, two sensory neurons known to mediate 2-nonanone-evoked avoidance, is sufficient to rescue. Sensory neurons AWB and downstream interneurons AVA, AIB, RIM that play critical roles in olfactory sensorimotor response are able to process signals generated by 2-nonanone or IAA or the mixture of the two odorants and contribute to the integration. Thus, our results identify redundant neural circuits that regulate the robust effect of a repulsive odorant to block responses to attractive odorants and uncover the neuronal and cellular basis for this complex olfactory task.


Conflict of interest statement

The authors have declared that no competing interests exist.

Figures
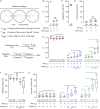
Fig 1
Fig 1. C. elegans displays olfactory integration.
(A) A schematic showing chemotaxis assays and definition of choice index and integration index. (B, C) The odorant isoamyl alcohol (IAA) attracts wild-type C. elegans, while the odorant 2-nonanone (Nona) repels it (B). However, pairing 2-nonanone with IAA repels C. elegans similarly as 2-nonanone (B), completely blocking the attraction of IAA (C). (D) The percentages of incorrect choices (defined in Materials and Methods) for assays in B and C. (E—G) 2-nonanone blocks the attraction of IAA in a dosage-dependent manner. In B–G, box plots indicate median, the first and the third quartile, and the minimal and maximal values; the numbers of assays are indicated in the parentheses, which are highlighted in orange if the data are not normally distributed; Nona, 2-nonanone. Two tailed unpaired t-test (B, D, data are normally distributed) or One way ANOVA with Dunnett’s multiple comparisons test (E–G, if data are normally distributed) or Kruskal-Wallis test with Dunn’s multiple comparisons test (E–G, if data are not normally distributed), **** p < 0.0001, *** p < 0.001, ** p < 0.01, * p < 0.05, ns, not significant.
Fig 2
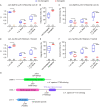
Fig 2. Mutations in genes regulating sensory neurons disrupt olfactory integration.
(A, B) Mutations in osm-5, osm-1 and dyf-7 mildly disrupt chemotaxis to IAA or 2-nonanone (A), but strongly disrupt olfactory integration (A, B). (C) The percentages of incorrect choices for assays in A, B. In A–C, box plots indicate median, the first and the third quartile, and the minimal and maximal values; the numbers of assays are indicated in the parentheses, which are highlighted in orange if the data are not normally distributed; Nona, 2-nonanone. Mutant indexes or percentages were compared with wild type using One way ANOVA with Dunnett’s multiple comparisons test (if data are normally distributed) or Kruskal-Wallis test with Dunn’s multiple comparisons test (if data are not normally distributed), **** p < 0.0001, *** p < 0.001, ** p < 0.01, * p < 0.05, ns, not significant.
Fig 3
Fig 3. Expressing osm-5 or osm-1 rescues the defects in olfactory integration.
(A—C) Expressing a wild-type osm-5 cDNA using an osm-5 promoter rescues the defects of osm-5(p813) mutants in chemotaxis to IAA or 2-nonanone (A) and olfactory integration (A, B), as well as behavioral choices during the assays (C). (D—F) Expressing a wild-type fosmid containing osm-1 genomic sequence rescues the defects of osm-1(yx50) mutants in chemotaxis to IAA or 2-nonanone (D) and olfactory integration (D, E), as well as behavioral choices during the assays (F). (G) Schematics showing protein domains of OSM-5, OSM-1 and DYF-7, as well as the mutations identified in this or previous studies. In A–F, box plots indicate median, the first and the third quartile, and the minimal and maximal values; the numbers of assays are indicated in the parentheses, which are highlighted in orange if the data are not normally distributed; Nona, 2-nonanone. Two tailed unpaired t-test (if data are normally distributed) or two tailed Mann-Whitney test (if data are not normally distributed) is used to compare transgenic animals and their non-transgenic siblings tested in parallel. **** p < 0.0001, *** p < 0.001, ** p < 0.01, * p < 0.05.
Fig 4
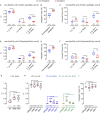
Fig 4. osm-5 acts in AWB or ASH neurons to regulate chemotaxis and olfactory integration.
(A—C) Expressing a wild-type osm-5 cDNA in AWB rescues the defects of osm-5(p813) mutants in chemotaxis to 2-nonanone (Nona) (A) and olfactory integration (A, B), as well as behavioral choices during the assays (C). (D—F) Expressing a wild-type osm-5 cDNA in ASH rescues the defects of osm-5(p813) mutants in chemotaxis to 2-nonanone (Nona) (D) and olfactory integration (D, E), as well as behavioral choices during the assays (F). (G) Ablation of AWB or ASH impairs avoidance of 0.1 μL 2-nonanone. (H, I) Ablation of AWC reduces attraction of 1 μL IAA, ablation of AWB reduces avoidance of 1 μL 2-nonanone, ablation of AWB or ASH reduces avoidance of the mixture of 1 μL 2-nonanone and 1 μL IAA (H) without a significant effect on the integration index (I). In A–I, box plots indicate the median, the first and the third quartile, and the minimal and maximal values; the numbers of assays are indicated in the parentheses, which are highlighted in orange if the data are not normally distributed. In A–F, two tailed unpaired t-test (if data are normally distributed) or two tailed Mann-Whitney test (if data are not normally distributed) is used to compare transgenic animals and their non-transgenic siblings tested in parallel. In G–I, indexes of ablated animals are compared with that of wild type (N2) using One way ANOVA with Dunnett’s multiple comparisons test (if data are normally distributed) or Kruskal-Wallis test with Dunn’s multiple comparisons test (if data are not normally distributed). **** p < 0.0001, *** p < 0.001, ** p < 0.01, * p < 0.05, ns, not significant.
Fig 5
Fig 5. osm-5 acts in AWB to regulate neuronal responses of AWB to IAA, 2-nonanone, and the mixture.
(A) Schematics illustrating the definition of ON and OFF response and the latency of the OFF response. (B—D) Exposure to IAA increases GCaMP signal of AWB (ON response) and removal of IAA decreases it (OFF response). The osm-5(p813) mutation disrupts both the ON and OFF responses and expressing osm-5 in AWB rescues the defects. (E—H) Exposure to 2-nonanone (Nona) suppresses the GCaMP signal of AWB (ON response) and removal of 2-nonanone increases it (OFF response). The osm-5(p813) mutation decreases the amplitude and increases the latency of the OFF response and expressing osm-5 in AWB rescues the defect in latency. (I—L) Exposure to the mixture of IAA and 2-nonanone (Nona) suppresses the GCaMP signal of AWB (ON response) and removal of the mixture increases it (OFF response). The osm-5(p813) mutation decreases the amplitude and increases the latency of the OFF response and expressing osm-5 in AWB rescues both defects. The change in fluorescence intensity (ΔF) for each frame is the difference between its fluorescence intensity and the average intensity over the 10-second recording before the stimulus onset (Fbase): ΔF = F—Fbase. The average ΔF/Fbase % during the 10-second window after onset minus average ΔF/Fbase % of the 10-second window before onset is used to measure ON response. The average ΔF/Fbase % during the 10-second window after removal minus average ΔF/Fbase % of the 10-second window before removal is used to measure OFF response. Latency is defined as the time that it takes for the calcium signal to rise to the mean of the 10-second window before odor removal plus 3 × standard deviation. In B, E, I, solid lines and shades are respectively mean and SEM and in C, D, F–H, J–L, horizontal bars in each graph are median with 95% confidence interval, individual data points are shown as dots. The numbers of the worms imaged are shown in the parentheses, which are highlighted in orange if the data are not normally distributed. Kruskal-Wallis Test with Dunn’s multiple comparisons test is used to compare mutants with wild-type and rescued animals, because data are not normally distributed. **** p < 0.0001, *** p < 0.001, ** p < 0.01, * p < 0.05, ns, not significant.
Fig 6
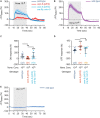
Fig 6. osm-5 acts in ASH to regulate neuronal response of ASH to 2-nonanone.
(A—D) Exposure to 2-nonanone (Nona) increases GCaMP signal of ASH (ON response) and removal of 2-nonanone decreases it (OFF response). The osm-5(p813) mutation disrupts both the ON and OFF responses and expressing osm-5 in ASH rescues the defects. (E) Exposure to IAA does not induce a significant change in GCaMP signal of ASH. The change in fluorescence intensity (ΔF) for each frame is the difference between its fluorescence intensity and the average intensity over the 10-second recording before the stimulus onset (Fbase): ΔF = F—Fbase. The average ΔF/Fbase % during the 10-second window after onset minus average ΔF/Fbase % of the 10-second window before onset is used to measure ON response. The average ΔF/Fbase % during the 10-second window after removal minus average ΔF/Fbase % of the 10-second window before removal is used to measure OFF response. In A, B, E, solid lines and shades are respectively mean and SEM and in C, D, horizontal bars in each graph are medianwith 95% confidence interval, individual data points are shown as dots. The numbers of the worms imaged are shown in the parentheses, which are colored in orange if the data are not normally distributed. Difference among the groups is analyzed by One way ANOVA with Dunnett’s multiple comparisons test (if data are normally distributed) or Kruskal-Wallis test with Dunn’s multiple comparisons test (if data are not normally distributed). *** p < 0.001, ** p < 0.01, ns, not significant.
Fig 7
Fig 7. osm-5 regulates neuronal responses of AVA, AIB and RIM interneurons to IAA, 2-nonanone, and the mixture.
(A—C) Exposure to 10−4 IAA suppresses GCaMP signal of AVA in both wild-type and osm-5(p813) mutant animals (A). Exposure to 10−5 2-nonanone (Nona) does not evoke a significant GCaMP signal in AVA (B). Exposure to 10−5 2-nonanone (Nona) and 10−4 IAA suppresses GCaMP signal of AVA in osm-5(p813) mutants, but not in wild-type animals (C). (D—F) Exposure to 10−4 IAA suppresses GCaMP signal of AIB in both wild-type and osm-5(p813) mutant animals (D). Exposure to 10−5 2-nonanone (Nona) suppresses GCaMP signal of AIB in wild-type animals, but not in osm-5(p813) mutant animals (E). Exposure to 10−5 2-nonanone (Nona) and 10−4 IAA suppresses GCaMP signal of AIB in wild-type, and the suppression is reduced in osm-5(p813) mutant animals (F). (G—I) Exposure to 10−4 IAA suppresses GCaMP signal of RIM in both wild-type and osm-5(p813) mutant animals (G). Exposure to 10−5 2-nonanone (Nona) does not evoke a significant GCaMP signal in RIM in either wild-type or osm-5(p813) mutant animals (H). Exposure to 10−5 2-nonanone and 10−4 IAA suppresses the GCaMP signal of RIM in both wild-type and osm-5(p813) mutant animals (I). The change in fluorescence intensity (ΔF) for each frame is the difference between its fluorescence intensity and the average intensity over the 10-second recording before the stimulus onset (Fbase): ΔF = F—Fbase. The average ΔF/Fbase % during the 5-second or 2nd 10-second window after onset minus average ΔF/Fbase % of the 10-second window before onset is used to measure ON response (Materials and Methods). The average ΔF/Fbase % during the 5-second window after removal minus average ΔF/Fbase % of the 10-second window before removal is used to measure OFF response. The solid lines and shades are respectively mean and SEM. The numbers of animals imaged are shown on each panel. Detailed statistics is presented in S4 Fig. *** p < 0.001, ** p < 0.01, * p < 0.05.
Fig 8
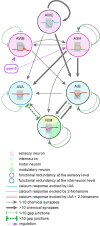
Fig 8. A model for redundant circuits underlying olfactory integration.
We designed a new behavior paradigm to study a form of olfactory integration of repellent 2-nonanone and attractant IAA, which signal danger and food, respectively, in C. elegans. Our results suggest that AWB and ASH sensory neurons initiate redundant circuits to regulate integrated response to the two odorants. The signals generated by 2-nonanone and IAA are integrated at the levels of sensory neurons and downstream interneurons, including AVA, to weaken the signal and attraction evoked by IAA. Together, we propose that functional redundancy of neuronal circuits ensures the avoidance behavior when 2-nonanone, a repulsive odorant signaling danger, is present simultaneously with attractive odorants, such as IAA. Note: the synapses and gap junctions are illustrated based on the outputs from http://www.nemanode.com [52].

References

    1. Li Q, Liberles SD. Aversion and attraction through olfaction. Curr Biol. 2015;25(3):R120–R9. Epub 2015/02/05. doi: 10.1016/j.cub.2014.11.044 ; PubMed Central PMCID: PMC4317791. - DOI - PMC - PubMed
    1. Bargmann CI, Hartwieg E, Horvitz HR. Odorant-Selective Genes and Neurons Mediate Olfaction in C. elegans. Cell. 1993;74(3):515–27. doi: 10.1016/0092-8674(93)80053-h WOS:A1993LT73900013. - DOI - PubMed
    1. Saraiva LR, Kondoh K, Ye X, Yoon KH, Hernandez M, Buck LB. Combinatorial effects of odorants on mouse behavior. Proc Natl Acad Sci U S A. 2016;113(23):E3300–E6. Epub 2016/05/22. doi: 10.1073/pnas.1605973113 ; PubMed Central PMCID: PMC4988607. - DOI - PMC - PubMed
    1. Troemel ER, Kimmel BE, Bargmann CI. Reprogramming chemotaxis responses: Sensory neurons define olfactory preferences in C. elegans. Cell. 1997;91(2):161–9. doi: 10.1016/s0092-8674(00)80399-2 WOS:A1997YC35000004. - DOI - PubMed
    1. Logan JG, Birkett MA, Clark SJ, Powers S, Seal NJ, Wadhams LJ, et al.. Identification of human-derived volatile chemicals that interfere with attraction of Aedes aegypti mosquitoes. J Chem Ecol. 2008;34(3):308–22. Epub 2008/03/01. doi: 10.1007/s10886-008-9436-0 . - DOI - PubMed

Publication types