. 2022 Jan 31;18(1):e1009719.
doi: 10.1371/journal.pgen.1009719. eCollection 2022 Jan.

Transcription factor regulation of eQTL activity across individuals and tissues

Affiliations

Transcription factor regulation of eQTL activity across individuals and tissues

Elise D Flynn et al. PLoS Genet. .

Abstract

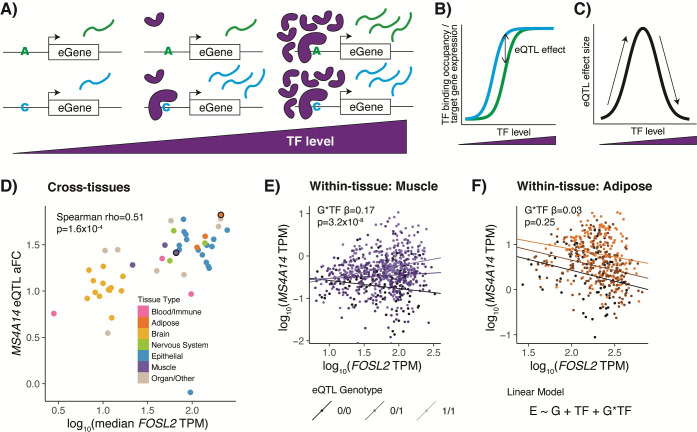
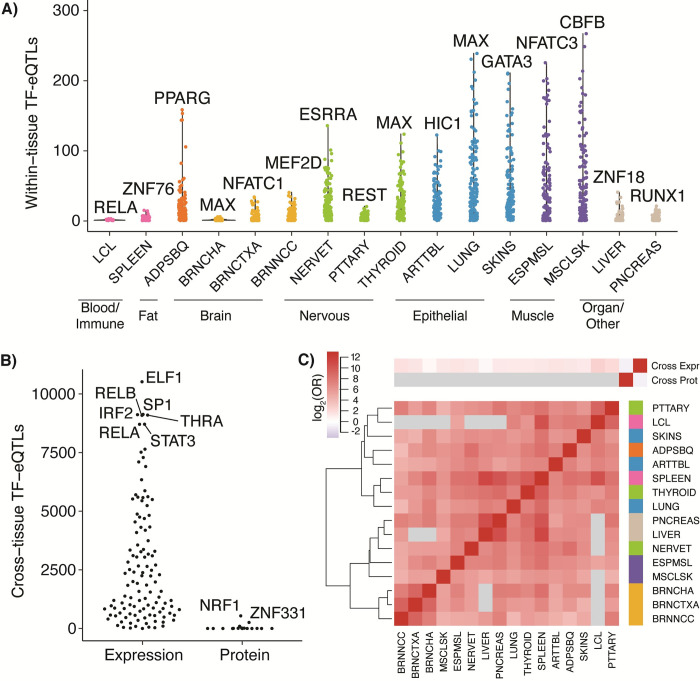
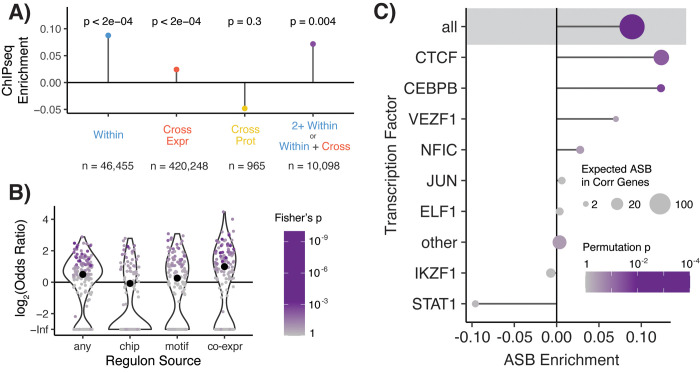
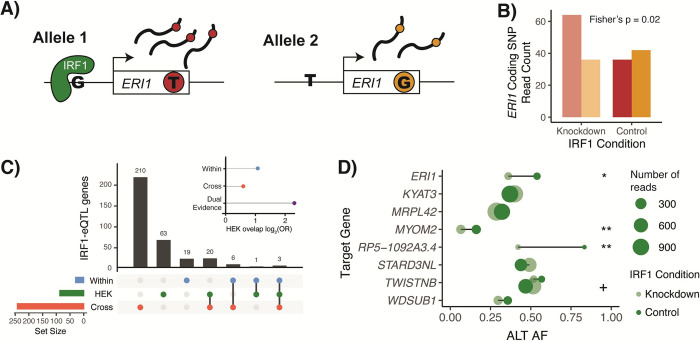
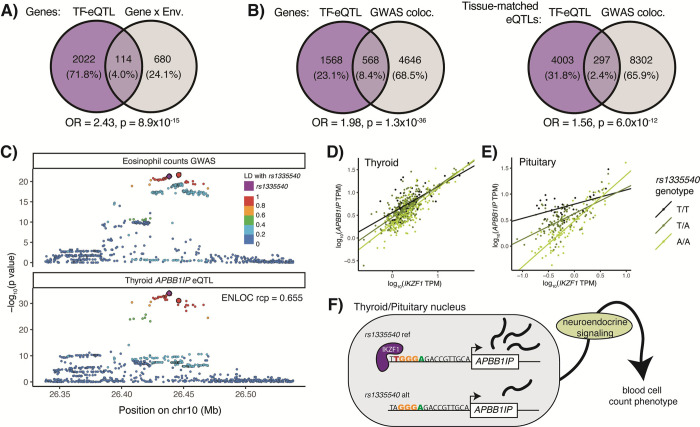
Tens of thousands of genetic variants associated with gene expression (cis-eQTLs) have been discovered in the human population. These eQTLs are active in various tissues and contexts, but the molecular mechanisms of eQTL variability are poorly understood, hindering our understanding of genetic regulation across biological contexts. Since many eQTLs are believed to act by altering transcription factor (TF) binding affinity, we hypothesized that analyzing eQTL effect size as a function of TF level may allow discovery of mechanisms of eQTL variability. Using GTEx Consortium eQTL data from 49 tissues, we analyzed the interaction between eQTL effect size and TF level across tissues and across individuals within specific tissues and generated a list of 10,098 TF-eQTL interactions across 2,136 genes that are supported by at least two lines of evidence. These TF-eQTLs were enriched for various TF binding measures, supporting with orthogonal evidence that these eQTLs are regulated by the implicated TFs. We also found that our TF-eQTLs tend to overlap genes with gene-by-environment regulatory effects and to colocalize with GWAS loci, implying that our approach can help to elucidate mechanisms of context-specificity and trait associations. Finally, we highlight an interesting example of IKZF1 TF regulation of an APBB1IP gene eQTL that colocalizes with a GWAS signal for blood cell traits. Together, our findings provide candidate TF mechanisms for a large number of eQTLs and offer a generalizable approach for researchers to discover TF regulators of genetic variant effects in additional QTL datasets.


Conflict of interest statement

I have read the journal’s policy and the authors of this manuscript have the following competing interests: EDF is currently employed by Patch Biosciences. TL advises Variant Bio, Goldfinch Bio, GlaxoSmithKline and has equity in Variant Bio. FA is an inventor on a patent application related to TensorQTL.

Figures

Fig 1
Fig 1. TF model of eQTL effects.
A) TF binding to an eQTL variant with different allelic TF affinities is depicted at low, medium, and high TF levels. B) TF binding occupancy, resulting in target gene expression, for the two eQTL alleles across TF levels. C) Difference in expression of alleles or eQTL effect size, quantified as log2 allelic fold change, across TF levels. Our applied models only examine monotonic effects, which can be imagined as different sides of the hill. D) Tissues are plotted by eQTL effect size vs. median TF expression for an example MS4A14 eQTL and the FOSL2 TF. Cross-tissue TF-eQTL interactions are discovered by a Spearman correlation of these two measures, or with TF protein levels for the protein-based analysis. Two tissues circled in black are highlighted in the following panels. E) & F) Individuals are plotted by eGene expression vs. TF expression in Skeletal Muscle (E) or Adipose Visceral (F) tissue and are shaded by the genotype of the eQTL variant. Within-tissue TF-eQTL interactions are discovered using a multiple linear regression interaction model of normalized eGene expression by TF level, genotype, and TF level by genotype. Linear regression lines are plotted separately for each genotype, with corresponding G*TF interaction beta and p-value displayed on the chart. In Muscle, an eQTL is present, observable as a difference between the genotypes, and the difference gets larger as TF expression is higher, suggesting an interaction between TF level and eQTL effect. In Adipose, an eQTL is present, observable as a difference between the genotypes, but that difference does not appear to correlate with TF level.
Fig 2
Fig 2. Discovered TF-eQTL interactions.
A) Number of within-tissue TF-eQTL interactions at 5% FDR is plotted per TF for each tissue analyzed. The TF with the most interactions per tissue is highlighted. B) Number of discovered cross-tissue TF-eQTL interactions per TF for expression-based interactions and protein-based interactions (at 5% FDR). TFs with the most correlations per analysis are highlighted. C) Sharing of TF-eQTL interactions between tissues and with cross-tissue datasets. Red indicates positive enrichment and blue, negative enrichment. Grey squares indicate no shared TF-eQTL gene pairs between the two datasets.
Fig 3
Fig 3. TF binding of TF-eQTL interactions.
A) Overlap enrichment of TFBS, based on TF ChIP-seq peaks, of TF-eQTL interactions by dataset. Permutation-based p-values are plotted above each measurement. Datasets include within-tissue (blue) interactions, cross-tissue expression-based (red), cross-tissue protein-based (yellow), and TF-eQTL interactions with at least two lines of evidence from cross-tissue expression-based and within-tissue interactions (purple). B) The enrichment of target genes with two lines of evidence for TF-eQTL interactions falling into that TF’s regulon. Large black dots depict overall enrichment across TFs. C) Enrichment for allele-specific TF binding (ASB) for TF-eQTL interactions with two lines of evidence. Shaded area contains statistics for unmatched TF ASB analysis. Below that, statistics for matched TF ASB analysis is shown, with TFs with more than one expected ASB event plotted individually, and all other TFs combined (other).
Fig 4
Fig 4. IRF1-eQTL interactions in HEK293-TLR4 IRF1 knockdown.
A) Depiction of allele-specific expression, with IRF1 preferentially binding to the G-allele in the regulatory region of the ERI1 target gene. This leads to higher expression of allele 1, which we can measure based on the presence of a heterozygous coding SNP in the ERI1 transcript. Reads from allele 1 will have a T genotype (red) at the coding SNP and reads from allele 2 will have a G (orange). B) Read counts for ERI1 coding SNP alleles in both knockdown and control conditions. In this example, it appears that we observe allelic effects at lower (knockdown) IRF1 levels, while higher (control) levels of IRF1 may saturate binding to both alleles. Conditions are compared using Fisher’s exact test of allelic counts. C) Sharing of IRF1-interacting eQTL genes in within-tissue (blue), cross-tissue expression-based (red), and HEK293T IRF1 knockdown (green) datasets. Only genes with an adequately expressed heterozygous coding SNP in HEK293T samples are included. Inset shows enrichment for overlap between HEK293T IRF1-eQTL genes and listed datasets. D) HEK293T coding SNP alternative allele frequency in dual-evidence IRF1-eQTL genes that were heterozygous for a top TF-eQTL variant and had adequate coverage of a heterozygous coding SNP. + indicates a Fisher’s p value < 0.1, * < 0.05, ** < 0.01 of allelic counts vs. condition.
Fig 5
Fig 5. TF-eQTL implications for gene-by-environment and GWAS effects.
A) Overlap of TF-eQTL genes with GxE genes from Findley et al. 2021. B) Overlap of TF-eQTL genes with GWAS colocalizing eQTL genes from GTEx. The first diagram shows overlap for a gene with a TF-eQTL in any tissue and colocalizing eQTL in any tissue. The second shows overlap of tissue eQTLs with TF-eQTL and/or colocalizing GWAS locus in the given tissue. C) Representative eQTL and GWAS p-values are plotted for variants in the region of an APBB1IP eQTL and blood trait GWAS locus. Lead variants from IKZF1-eQTL interactions in thyroid, pituitary, and tibial artery are larger and outlined in black. (The lead variant from pituitary/artery cannot be seen as it falls behind rs1335540.) D) & E) Individual samples in thyroid and pituitary tissues are plotted by IKZF1 and APBB1IP expression, and linear regression lines are plotted by genotype. The difference in APBB1IP expression between the genotypes gets smaller as IKZF1 expression increases across the samples. F) Schematic of IKZF1 regulation of APBB1IP and blood cell counts. An IKZF1 binding site predicted by the HOCOMOCO IKZF1 motif lies nine bases upstream of APBB1IP’s transcription start site, which is disrupted by the alternative allele of rs1335540. Under our neuroendocrine signaling hypothesis, APBB1IP expression in neuroendocrine tissues goes on to alter system-wide neuroendocrine signaling, which would cause changes in blood cell counts. As IKZF1 appears to regulate the APBB1IP eQTLs in these tissues, it would follow that IKZF1 TF therefore may regulate the effect of this locus on blood cell counts.

Similar articles

Cited by

References

    1. GTEx Consortium. The Genotype-Tissue Expression (GTEx) pilot analysis: Multitissue gene regulation in humans. Science. 2015;348: 648–660. doi: 10.1126/science.1262110 - DOI - PMC - PubMed
    1. Gaffney DJ, Veyrieras J-B, Degner JF, Pique-Regi R, Pai AA, Crawford GE, et al.. Dissecting the regulatory architecture of gene expression QTLs. Genome Biol. 2012;13: R7. doi: 10.1186/gb-2012-13-1-r7 - DOI - PMC - PubMed
    1. Kilpinen H, Waszak SM, Gschwind AR, Raghav SK, Witwicki RM, Orioli A, et al.. Coordinated Effects of Sequence Variation on DNA Binding, Chromatin Structure, and Transcription. Science. 2013; 1–5. - PMC - PubMed
    1. GTEx Consortium, Aguet F, Brown AA, Castel SE, Davis JR, He Y, et al.. Genetic effects on gene expression across human tissues. Nature Publishing Group. 2017;550: 204–213. - PMC - PubMed
    1. Consortium GTEx. The GTEx Consortium atlas of genetic regulatory effects across human tissues. Science. 2020;369: 1318–1330. doi: 10.1126/science.aaz1776 - DOI - PMC - PubMed

Publication types

Substances