. 2022 Jan 31;17(1):e0263070.
doi: 10.1371/journal.pone.0263070. eCollection 2022.

A robust biostatistical method leverages informative but uncertainly determined qPCR data for biomarker detection, early diagnosis, and treatment

Affiliations

A robust biostatistical method leverages informative but uncertainly determined qPCR data for biomarker detection, early diagnosis, and treatment

Wei Zhuang et al. PLoS One. .

Abstract

As a common medium-throughput technique, qPCR (quantitative real-time polymerase chain reaction) is widely used to measure levels of nucleic acids. In addition to accurate and complete data, experimenters have unavoidably observed some incomplete and uncertainly determined qPCR data because of intrinsically low overall amounts of biological materials, such as nucleic acids present in biofluids. When there are samples with uncertainly determined qPCR data, some investigators apply the statistical complete-case method by excluding the subset of samples with uncertainly determined data from analysis (CO), while others simply choose not to analyze (CNA) these datasets altogether. To include as many observations as possible in analysis for interesting differential changes between groups, some investigators set incomplete observations equal to the maximum quality qPCR cycle (MC), such as 32 and 40. Although straightforward, these methods may decrease the sample size, skew the data distribution, and compromise statistical power and research reproducibility across replicate qPCR studies. To overcome the shortcomings of the existing, commonly-used qPCR data analysis methods and to join the efforts in advancing statistical analysis in rigorous preclinical research, we propose a robust nonparametric statistical cycle-to-threshold method (CTOT) to analyze incomplete qPCR data for two-group comparisons. CTOT incorporates important characteristics of qPCR data and time-to-event statistical methodology, resulting in a novel analytical method for qPCR data that is built around good quality data from all subjects, certainly determined or not. Considering the benchmark full data (BFD), we compared the abilities of CTOT, CO, MC, and CNA statistical methods to detect interesting differential changes between groups with informative but uncertainly determined qPCR data. Our simulations and applications show that CTOT improves the power of detecting and confirming differential changes in many situations over the three commonly used methods without excess type I errors. The robust nonparametric statistical method of CTOT helps leverage qPCR technology and increase the power to detect differential changes that may assist decision making with respect to biomarker detection and early diagnosis, with the goal of improving the management of patient healthcare.


Conflict of interest statement

This work was conducted with the internal funding, NCTR protocol E0772101, of the U.S. Food and Drug Administration, a U.S. government agency. The authors have declared that no competing interests exist. The views presented in this article do not necessarily reflect those of the U.S. Food and Drug Administration. Any mention of commercial products is for clarification and is not intended as an endorsement. This does not alter our adherence to PLOS ONE policies on sharing data and materials.

Figures

Fig 1
Fig 1. Amplification curves of qPCR reactions.
In the example, five molecular targets reached the threshold of 0.5 before the 32nd cycle, i.e., Cq < 32, while two reached the threshold between the 32nd and the 40th cycle. The eighth molecular target did not reach the threshold by the 40th cycle, i.e., Cq > 40. QuantStudio Real-Time PCR software version 1.3 (Applied Biosystems by Thermo Fisher Scientific) was used to create the figure.
Fig 2
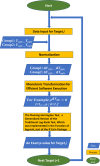
Fig 2. The flowchart to perform CTOT with the R coin package.
Y(ijk) denotes the Cq value reported by a qPCR assay for molecular target j (j = 1, 2, …, or g) of sample i (i = 1, 2, …, or n) in group k (k = 1 or 2). ΔY(ijk) denotes normalized Cq for target j of sample i in group k.
Fig 3
Fig 3. Boxplots of simulated Cq data.
The points above the solid line would be uncertainly measured by qPCR should 40 be the cutoff for data quality control or for biological, clinical, or technical concerns in practice. The points above the dash line would be uncertainly measured by qPCR should 32 be the cutoff for quality control or for biological, clinical, or technical concerns in practice.
Fig 4
Fig 4. The empirical power of the CTOT, MC, and CO methods compared with that of BFD.
BFD stands for the benchmark with full data analyzed with the current standard method, which includes t-tests for two-group comparisons. CTOT stands for the cycle-to-threshold method, while CO denotes the complete-observation method and MC denotes the method that sets uncertain and incomplete observations equal to the assay-specific maximum cycle threshold C1. Uncertain qPCR data may occur in one or both groups under comparison. % denotes the percentage of uncertainty that is observed in only one group among the replicates. nrep denotes the number of the replicates with at least one uncertain observation. β0 and β1 are parameters of the underlying models. |β1| is the absolute value of effect size. Panels A, B, and C represent the empirical power of the log-normal, Weibull, and log-logistic simulation type, respectively.
Fig 5
Fig 5. An Example to Illustrate the Issue of Potential False Negatives of MC and CO.
(A) The original Cq data simulated with a normal distribution (corresponding to the log-normal simulation type in Table 2, β0 = 13.35 and β1 = 2.06; the corresponding empirical power of BFD is 0.80). (B) The normalized Cq data with the BFD, CTOT, MC, or CO methods applied. The filled diamonds denote the Cq data with BFD. BFD stands for the benchmark with full data analyzed with the current standard method, which include t-tests for two-group comparisons. The filled triangles denote the Cq data with CTOT, the cycle-to-threshold method. The vertical green arrows indicate the ranges uncertain observations belong to, e.g., being greater than or equal to the assay-specific maximum cycle threshold C1. The filled squares denote the Cq data with MC, the method that sets uncertain and incomplete observations equal to C1. The maximum quality cycle threshold C1 = 40 is highlighted with a horizontal solid line. The open circles denote the Cq data with CO, the complete-observation method. The first five simulated samples belong to Group 1. The second five simulated samples belong to Group 2. The vertical dash line separates Groups 1 and 2.
Fig 6
Fig 6. An example to illustrate differences of the MC, CO, and CTOT methods.
(A) The original Cq data simulated with a normal distribution (corresponding to the log-normal simulation type in Table 5, β0 = 8.47 and β1 = 4.65; the corresponding empirical power of BFD is 0.91). (B) The normalized Cq data with the BFD, CTOT, MC, or CO methods applied. The filled diamonds denote the Cq data with BFD. BFD stands for the benchmark with full data analyzed with the current standard method, which include t-tests for two-group comparisons. The filled triangles denote the Cq data with CTOT, the cycle-to-threshold method. The vertical green arrows indicate the ranges uncertain observations belong to, e.g., being greater than or equal to the assay-specific maximum cycle threshold C1. The filled squares denote the Cq data with MC, the method that sets uncertain and incomplete observations equal to the assay-specific maximum cycle threshold C1. The maximum quality cycle threshold C1 = 40 is highlighted with a horizontal solid line. The open circle denoted CO, the complete-observation method. The first five simulated samples belong to Group 1. The second five simulated samples belong to Group 2. The vertical dash line separates Groups 1 and 2.
Fig 7
Fig 7. Empirical type I error rates of CTOT, BFD, CO, and MC methods.
CTOT stands for the cycle-to-threshold method. BFD stands for the benchmark with full data analyzed with the current standard method, which includes t-tests for two-group comparisons. CO denotes the complete-observation method and MC denotes the method that sets uncertain observations equal to the assay-specific maximum cycle threshold C1. In the simulation, C1 is set to be 40.ΔCq followed normal distributions and eΔCq followed log-normal distributions. Parameter Set 1: β0 = 5, σ = 1; Parameter Set 2: β0 = 10, σ = 1; +Parameter Set 3: β0 = 5, σ = 2; and Parameter Set 4: β0 = 10, σ = 2 with the parameterization listed for log-normal distribution in Table 2.
Fig 8
Fig 8. Comparison of the statistical significance between t-tests with C1 = 40 and CTOT with C1 = 32.
The sensitivity analysis was performed on 17 two-group comparisons on rat serum microRNAs miR-210-3p and miR-128-3p, where there was at least one uncertain observation in either of the two groups of comparison [3]. The p-values based on t-tests and CTOT (cycle-to-threshold method) are plotted in a -log10 scale on x-axis and y-axis, respectively. C1 denotes an assay-specific maximum cycle threshold for clinical, quality, or biological relevance, e.g., the cycle number that corresponds to LLOQ (lower limit of quantification). The solid lines are set at p-value = 0.05 and the dashed lines are set at p-value = 0.005. The inset Venn diagram illustrates statistically significant differences of levels of circulating microRNAs between control and treated groups, applying the CTOT, MC, or CO method and a maximum quality cycle threshold of C1 = 32 to the data reported by Silva et al. [3].

Similar articles

Cited by

References

    1. Harrington PR, Zeng W, Naeger LK. Clinical relevance of detectable but not quantifiable hepatitis C virus RNA during boceprevir or telaprevir treatment. Hepatology. 2012;55(4):1048–57. doi: 10.1002/hep.24791 PubMed PMID: WOS:000302069900008. - DOI - PubMed
    1. Sun Y, Liu YX, Cogdell D, Calin GA, Sun BC, Kopetz S, et al.. Examining plasma microRNA markers for colorectal cancer at different stages. Oncotarget. 2016;7(10):11434–49. doi: 10.18632/oncotarget.7196 PubMed PMID: WOS:000375678300054. - DOI - PMC - PubMed
    1. Silva CS, Chang CW, Williams D, Porter-Gill P, da Costa GG, Camacho L. Effects of a 28-day dietary co-exposure to melamine and cyanuric acid on the levels of serum microRNAs in male and female Fisher 344 rats. Food Chem Toxicol. 2016;98:11–6. doi: 10.1016/j.fct.2016.09.013 PubMed PMID: WOS:000388054000003. - DOI - PMC - PubMed
    1. Anfossi S, Babayan A, Pantel K, Calin GA. Clinical utility of circulating non-coding RNAs—an update. Nature Reviews Clinical Oncology. 2018;15(9):541–63. doi: 10.1038/s41571-018-0035-x PubMed PMID: WOS:000442252300009. - DOI - PubMed
    1. De Rubis G, Krishnan SR, Bebawy M. Liquid biopsies in cancer diagnosis, monitoring, and prognosis. Trends Pharmacol Sci. 2019;40(3):172–86. doi: 10.1016/j.tips.2019.01.006 PubMed PMID: WOS:000459246400004. - DOI - PubMed

Publication types