

Image-based phenotyping of cassava roots for diversity studies and carotenoids prediction
- PMID: 35100324
- PMCID: PMC8803208
- DOI: 10.1371/journal.pone.0263326
Image-based phenotyping of cassava roots for diversity studies and carotenoids prediction
Abstract
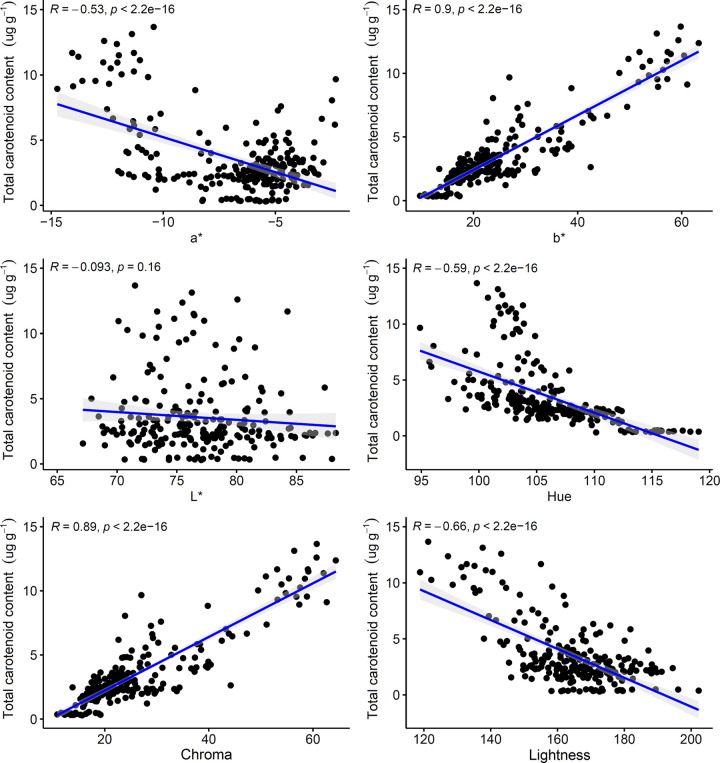
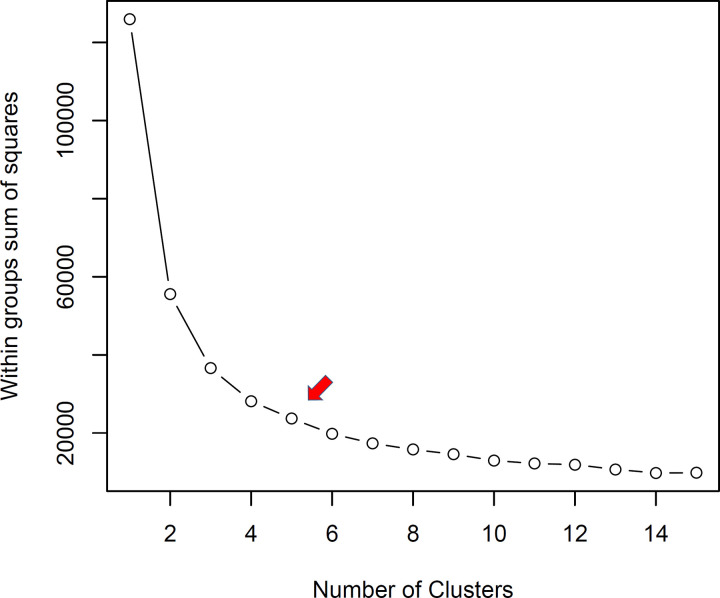
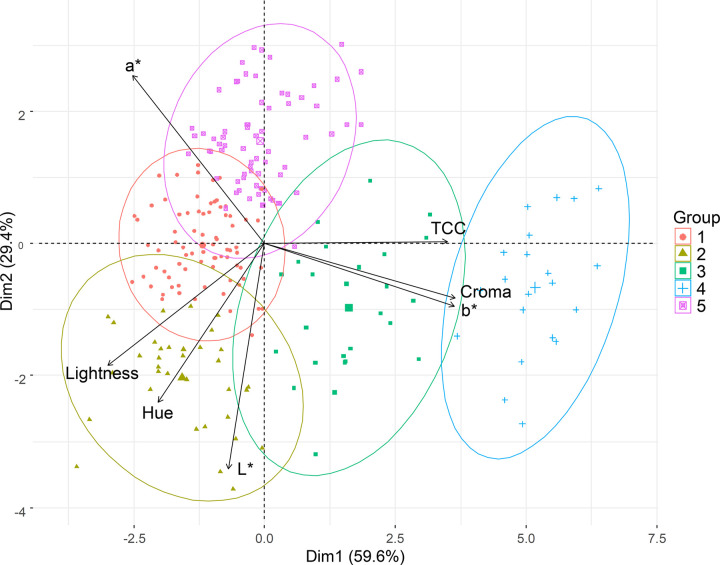
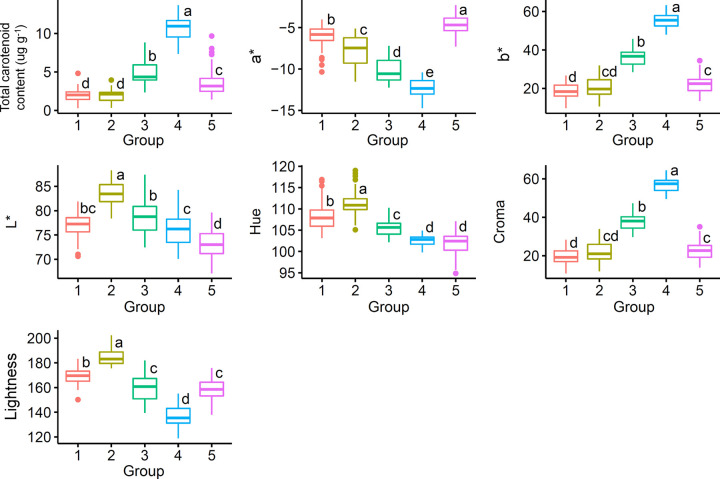
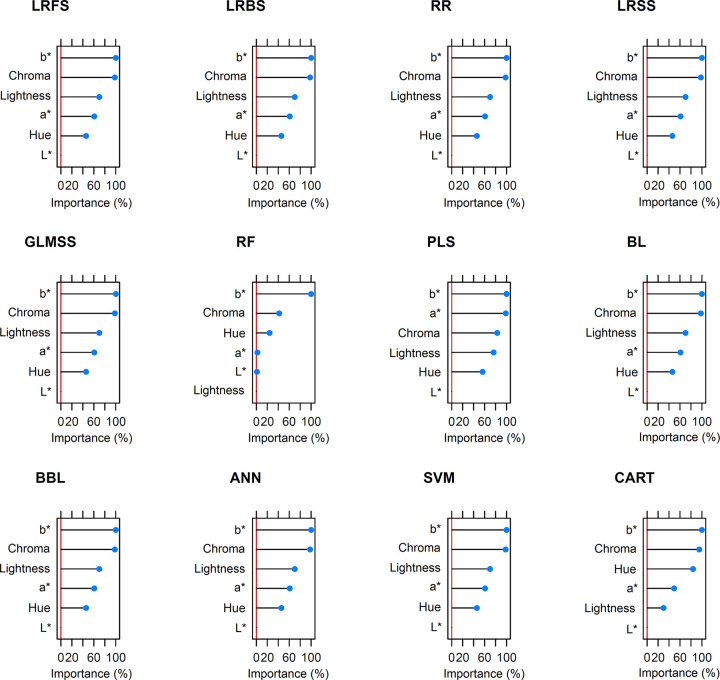
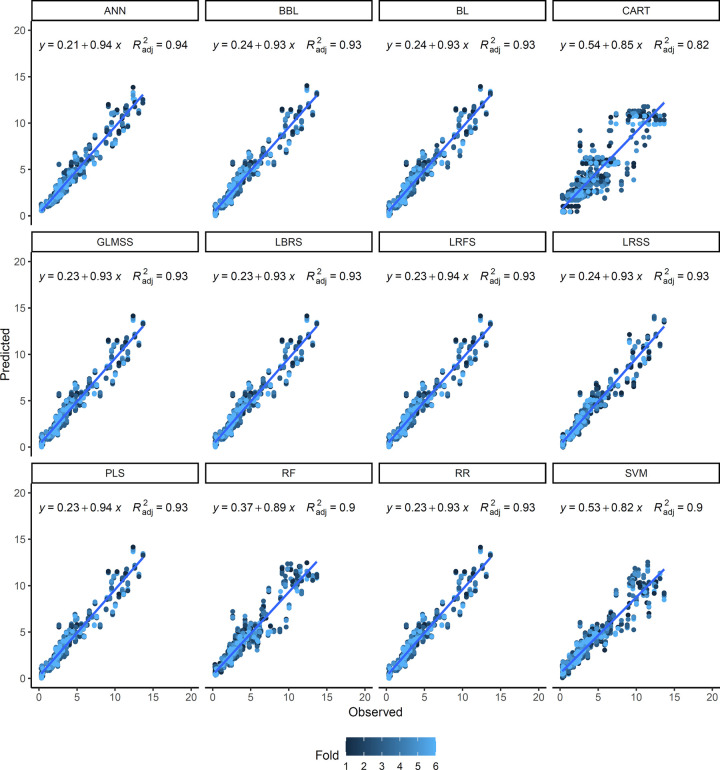
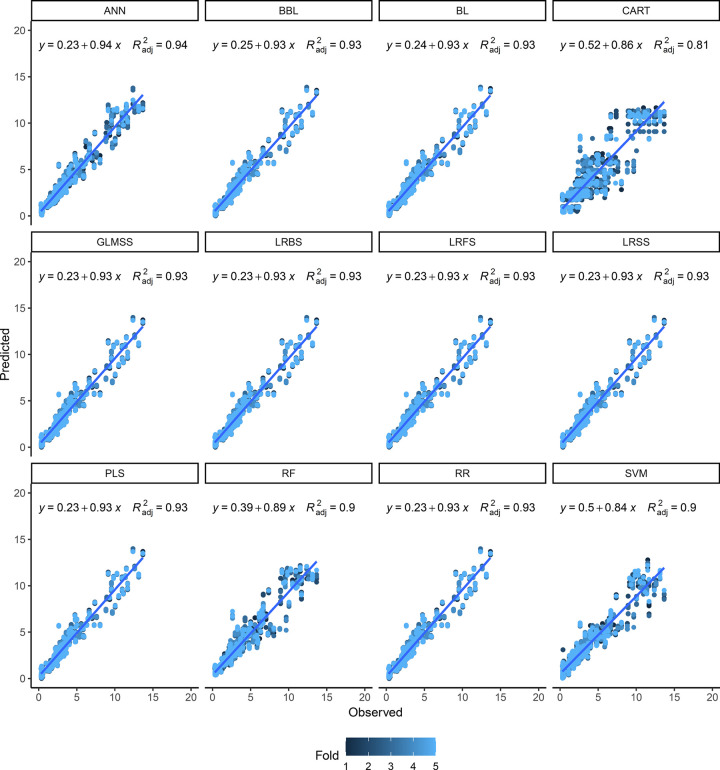
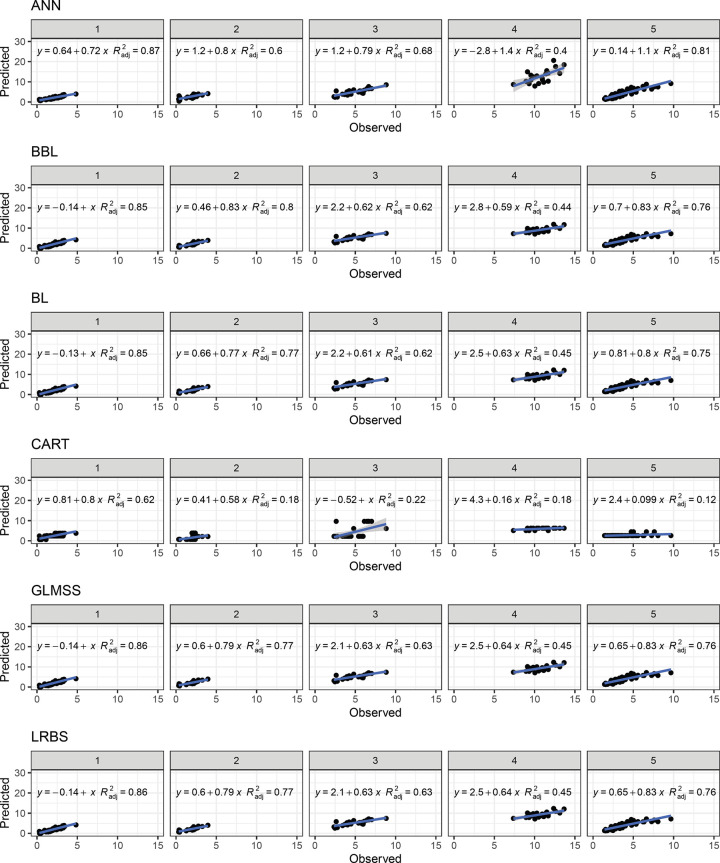
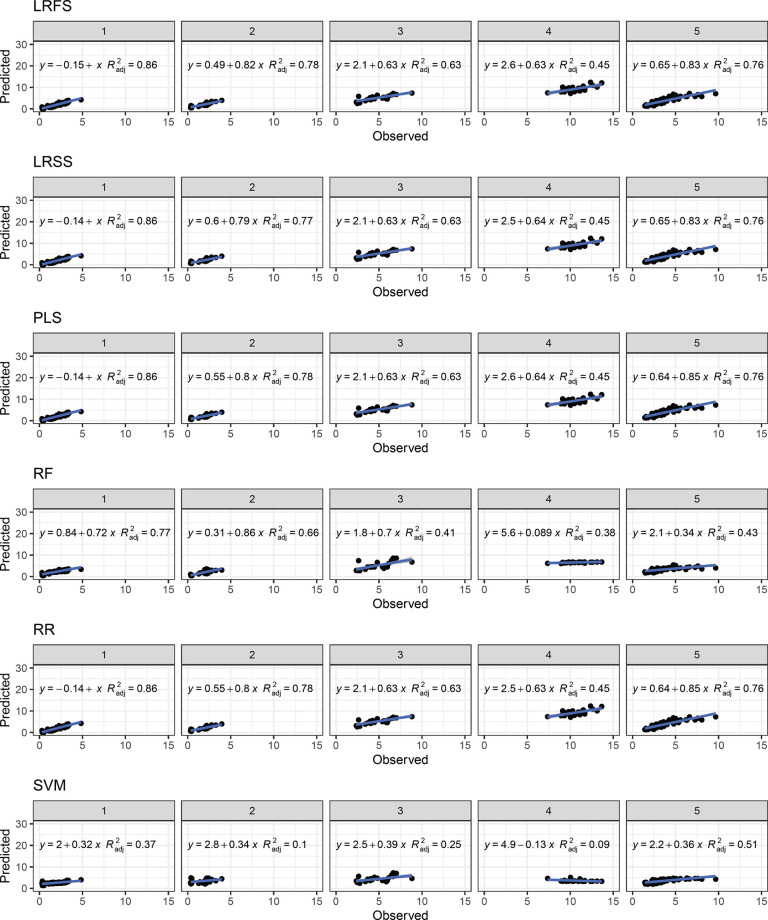
Phenotyping to quantify the total carotenoids content (TCC) is sensitive, time-consuming, tedious, and costly. The development of high-throughput phenotyping tools is essential for screening hundreds of cassava genotypes in a short period of time in the biofortification program. This study aimed to (i) use digital images to extract information on the pulp color of cassava roots and estimate correlations with TCC, and (ii) select predictive models for TCC using colorimetric indices. Red, green and blue images were captured in root samples from 228 biofortified genotypes and the difference in color was analyzed using L*, a*, b*, hue and chroma indices from the International Commission on Illumination (CIELAB) color system and lightness. Colorimetric data were used for principal component analysis (PCA), correlation and for developing prediction models for TCC based on regression and machine learning. A high positive correlation between TCC and the variables b* (r = 0.90) and chroma (r = 0.89) was identified, while the other correlations were median and negative, and the L* parameter did not present a significant correlation with TCC. In general, the accuracy of most prediction models (with all variables and only the most important ones) was high (R2 ranging from 0.81 to 0.94). However, the artificial neural network prediction model presented the best predictive ability (R2 = 0.94), associated with the smallest error in the TCC estimates (root-mean-square error of 0.24). The structure of the studied population revealed five groups and high genetic variability based on PCA regarding colorimetric indices and TCC. Our results demonstrated that the use of data obtained from digital image analysis is an economical, fast, and effective alternative for the development of TCC phenotyping tools in cassava roots with high predictive ability.
Conflict of interest statement
The authors have declared that no competing interests exist.
Figures
Similar articles
-
Phenotypic diversity and selection in biofortified cassava germplasm for yield and quality root traits.Euphytica. 2022;218(12):173. doi: 10.1007/s10681-022-03125-6. Epub 2022 Nov 17. Euphytica. 2022. PMID: 36405300 Free PMC article.
-
UV-Vis and CIELAB Based Chemometric Characterization of Manihot esculenta Carotenoid Contents.J Integr Bioinform. 2017 Dec 13;14(4):20170056. doi: 10.1515/jib-2017-0056. J Integr Bioinform. 2017. PMID: 29236680 Free PMC article.
-
Genetic inheritance of pulp colour and selected traits of cassava (Manihot esculenta Crantz) at early generation selection.J Sci Food Agric. 2018 Jun;98(8):3190-3197. doi: 10.1002/jsfa.8825. Epub 2018 Jan 16. J Sci Food Agric. 2018. PMID: 29230819
-
Cassava genetic transformation and its application in breeding.J Integr Plant Biol. 2011 Jul;53(7):552-69. doi: 10.1111/j.1744-7909.2011.01048.x. Epub 2011 Jun 22. J Integr Plant Biol. 2011. PMID: 21564542 Review.
-
The Cassava Source-Sink project: opportunities and challenges for crop improvement by metabolic engineering.Plant J. 2020 Aug;103(5):1655-1665. doi: 10.1111/tpj.14865. Epub 2020 Jun 26. Plant J. 2020. PMID: 32502321 Review.
Cited by
-
Image-Based High-Throughput Phenotyping in Horticultural Crops.Plants (Basel). 2023 May 22;12(10):2061. doi: 10.3390/plants12102061. Plants (Basel). 2023. PMID: 37653978 Free PMC article. Review.
-
Bridging artificial intelligence and fucoxanthin for the recovery and quantification from microalgae.Bioengineered. 2023 Dec;14(1):2244232. doi: 10.1080/21655979.2023.2244232. Bioengineered. 2023. PMID: 37578162 Free PMC article. Review.
-
The Development of Thematic Core Collections in Cassava Based on Yield, Disease Resistance, and Root Quality Traits.Plants (Basel). 2023 Oct 4;12(19):3474. doi: 10.3390/plants12193474. Plants (Basel). 2023. PMID: 37836214 Free PMC article.
-
Digital tools and technologies used in food fortification: A scoping review.Ann N Y Acad Sci. 2025 Feb;1544(1):106-124. doi: 10.1111/nyas.15276. Epub 2025 Jan 14. Ann N Y Acad Sci. 2025. PMID: 39808587 Free PMC article.
References
-
- Burns A, Gleadow R, Cliff J, Zacarias A, Cavagnaro T. Cassava:the drought, war and famine crop in a changing world. Sustainability. 2010; 2(11): 3572–3607.
-
- Jarvis A, Ramirez-Villegas J, Campo BVH, Navarro-Racines C. Is cassava the answer to African climate change adaptation? Tropical Plant Biology. 2012; 5(1): 9–29.
-
- Food and Agriculture Organization of the United Nations. FAOSTAT Database Gateway. [Online].; 2021. Available from:http://www.fao.org/faostat/en/#data/QC.
-
- Ferraro V, Pcicirillo C, Tomlins K, Pintado ME. Cassava (Manihot esculenta Crantz) and yam (Dioscorera spp.) crops and their derived foodstuffs:Safety, security and nutritional value. Critical reviews in food science and nutrition. 2016; 56(16): 2714–2727. doi: 10.1080/10408398.2014.922045 - DOI - PubMed
Publication types
MeSH terms
Substances
LinkOut - more resources
Full Text Sources
