. 2022 Feb 4;12(2):jkab430.
doi: 10.1093/g3journal/jkab430.

Genetic analysis of Caenorhabditis elegans pry-1/Axin suppressors identifies genes involved in reproductive structure development, stress responses, and aging

Affiliations

Genetic analysis of Caenorhabditis elegans pry-1/Axin suppressors identifies genes involved in reproductive structure development, stress responses, and aging

Avijit Mallick et al. G3 (Bethesda). .

Abstract

The Axin family of scaffolding proteins regulates a wide array of developmental and post-developmental processes in eukaryotes. Studies in the nematode Caenorhabditis elegans have shown that the Axin homolog PRY-1 plays essential roles in multiple tissues. To understand the genetic network of pry-1, we focused on a set of genes that are differentially expressed in the pry-1-mutant transcriptome and are linked to reproductive structure development. Knocking down eight of the genes (spp-1, clsp-1, ard-1, rpn-7, cpz-1, his-7, cdk-1, and rnr-1) via RNA interference efficiently suppressed the multivulva phenotype of pry-1 mutants. In all cases, the ectopic induction of P3.p vulval precursor cell was also inhibited. The suppressor genes are members of known gene families in eukaryotes and perform essential functions. Our genetic interaction experiments revealed that in addition to their role in vulval development, these genes participate in one or more pry-1-mediated biological events. Whereas four of them (cpz-1, his-7, cdk-1, and rnr-1) function in both stress response and aging, two (spp-1 and ard-1) are specific to stress response. Altogether, these findings demonstrate the important role of pry-1 suppressors in regulating developmental and post-developmental processes in C. elegans. Given that the genes described in this study are conserved, future investigations of their interactions with Axin and their functional specificity promises to uncover the genetic network of Axin in metazoans.

Keywords: C. elegans; pry-1; Axin; WNT signaling; aging; stress response; vulva development.


Figures

Figure 1
Figure 1
pry-1 mutant transcriptome is enriched with genes involved in reproductive structure development. (A) Volcano plot showing the 149 differentially expressed genes, with p < 0.05, linked to reproductive structure development in pry-1 mutant animals (Supplementary Table S2). The dotted line on the x-axis corresponds to log2 fold change of 1 and the one on the y-axis shows p-value of 0.05. Orange and green dots represent significantly upregulated and downregulated genes, respectively. (B) Phenotype-enrichment analysis of genes shown in (A). Not all categories are listed. See Supplementary Table S4 for a complete list.
Figure 2
Figure 2
Quantification of the Muv phenotype following RNAi knockdown of 26 upregulated genes in pry-1(mu38) animals. Data represent the mean of two replicates (n > 40 animals in each replicate) and error bars represent the standard deviation. For eight of the genes, located on the right of the dotted vertical line, Muv penetrance was lower than the mean ± 2x standard deviation of the control (L4440). Statistical analyses were done using one-way ANOVA with Dunnett’s post hoc test and significant differences are indicated by stars (*): * (p < 0.05), ** (p < 0.01), *** (p < 0.001), # (p < 0.0001).
Figure 3
Figure 3
Expression levels of suppressor genes determined by qPCR in pry-1 and bar-1 mutants. Normalized expression of suppressor genes in pry-1(mu38) L3 larvae and adults (A, B) and bar-1(ga80) L3 larvae (C). Each data represents the mean of two replicates and error bars the standard error of means. Significance was calculated using Bio-Rad software (one-way ANOVA) and significant differences are indicated by stars (*): * (p < 0.05), ** (p < 0.01), *** (p < 0.001).
Figure 4
Figure 4
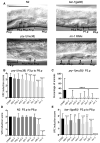
VPC induction analysis following RNAi knockdown of suppressor genes. (A) Representative images of N2, pry-1(mu38), bar-1(ga80), and rnr-1(RNAi) animals at the mid-L4 stage. Arrows in N2, pry-1(mu38), and bar-1(ga80) animals point to invaginations formed by the progeny of three VPCs (P5.p, P6.p, and P7.p) and to uninduced VPCs in rnr-1(RNAi) animal. Not all VPCs and their progeny are shown. Parts of P4.p and P8.p daughter nuclei, where visible, are indicated by half U-shaped lines. Scale bar is 50 µm. (B–E) Panels B, D, and E show average VPC induction (P3.p to P8.p) whereas panel C shows percentage of animals with induced P3.p. Black bars represent control RNAi (L4440), and gray and white represent data that are statistically insignificant and significant, respectively. (B) Knockdown of ard-1, rpn-7, cpz-1, his-7, cdk-1, and rnr-1 significantly reduced average VPC induction in pry-1(mu38) animals. (C) Same as B, except that the percentage of animals with induced P3.p is plotted. (D) Knockdown of cdk-1 and rnr-1 significantly reduced average VPC induction in N2 animals. (E) Knockdown of spp-1, ard-1, cpz-1, his-7, cdk-1, and rnr-1 significantly reduced average VPC induction in bar-1(ga80) animals. In all cases, data shown in panels B–E represent a cumulative of two replicates (n > 30 animals in total for each condition, also see Table 2) and error bars represent the standard deviation. Statistical analyses were done using one-way ANOVA with Dunnett’s post hoc test and significant differences are indicated by stars (*): * (p < 0.05), ** (p < 0.01), *** (p < 0.001), **** (p < 0.0001). Multiple comparison tests were also performed for data in panels B, C, and D using one-way ANOVA for genes that also showed effect in N2 and the results are listed as follows: cdk-1 RNAi vs. pry-1(mu38); cdk-1 RNAi (p > 0.998), cdk-1 RNAi vs. bar-1(ga80); cdk-1 RNAi (p = 0.061), pry-1(mu38); cdk-1 RNAi vs bar-1(ga80); cdk-1 RNAi (p = 0.061), rnr-1 RNAi vs pry-1(mu38); rnr-1 RNAi (p < 0.0001)****, rnr-1 RNAi vs bar-1(ga80); rnr-1 RNAi (p = 0.999), pry-1(mu38); rnr-1 RNAi vs bar-1(ga80); rnr-1 RNAi (p < 0.0001)****.
Figure 5
Figure 5
Knockdown of suppressor genes rescue lifespan, body bending and pharyngeal pumping defect of pry-1 mutants. (A–D) RNAi knockdown of cpz-1, his-7, cdk-1, and rnr-1 in N2 and pry-1 mutants (also see Supplementary Figure S2). (A–D) See Materials and Methods section and Table 3 for lifespan data and statistical analyses. (E, F) Bar graphs showing the rates of body bending and pharyngeal pumping of pry-1 mutants over a period of 4 days following RNAi of cpz-1, his-7, cdk-1, and rnr-1. (G, H) Bar graphs showing the rates of body bending and pharyngeal pumping of N2 animals. (E–H) Data represent the mean of two replicates (n > 10 animals per replicate) and error bars represent the standard deviation. Statistical analyses for panels E–H were done using one-way ANOVA with Dunnett’s post hoc test for each day and significant differences are indicated by stars (*): * (p < 0.05), ** (p < 0.01).
Figure 6
Figure 6
cpz-1, his-7, cdk-1, and rnr-1 regulate stress sensitivity in pry-1 mutants. (A) Survivability of pry-1(mu38) animals following RNAi knockdown of suppressor genes. The animals were treated with 100 mM PQ solution for 1 h. Data represent mean of two replicates (n > 30 animals). (B) Quantification of fluorescence intensity using hsp-4::GFP marker in pry-1 mutants following RNAi knockdown of spp-1, ard-1, cpz-1, his-7, cdk-1, and rnr-1. (C) Same as (B), except that fluorescence reporter is hsp-60::GFP (D) Same as B, except that fluorescence reporter is sod-3::GFP. Data represent the mean of two replicates (n > 15 animals per replicate). Error bars represent the standard deviation. Statistical analyses were done using one-way ANOVA with Dunnett’s post hoc test for each day and significant differences are indicated by stars (*): * (p < 0.05), ** (p < 0.01).
Figure 7
Figure 7
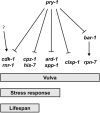
A schematic diagram showing biological processes mediated by pry-1 and eight suppressor genes. The genetic relationship is based on the expression and functional data described in this study. While all genes are involved in pry-1-mediated vulval development, only six affect stress response and four lifespan. Question mark (?) indicates that cdk-1 and rnr-1 may also be regulated in a pry-1-independent manner.

Similar articles

Cited by

References

    1. Alper S, McBride SJ, Lackford B, Freedman JH, Schwartz DA.. 2007. Specificity and complexity of the Caenorhabditis elegans innate immune response. Mol Cell Biol. 27:5544–5553. - PMC - PubMed
    1. Amrit FRG, Ratnappan R, Keith SA, Ghazi A.. 2014. The C. elegans lifespan assay toolkit. Methods. 68:465–475. - PubMed
    1. Angeles-Albores D, Raymond RY, Chan J, Sternberg PW.. 2016. Tissue enrichment analysis for C. elegans genomics. BMC Bioinformatics. 17:1–10. - PMC - PubMed
    1. Anyanful A, Easley KA, Benian GM, Kalman D.. 2009. Conditioning protects C. elegans from lethal effects of enteropathogenic E. coli by activating genes that regulate lifespan and innate immunity. Cell Host Microbe. 5:450–462. - PMC - PubMed
    1. Bennett CF, Vander Wende H, Simko M, Klum S, Barfield S, et al.2014. Activation of the mitochondrial unfolded protein response does not predict longevity in Caenorhabditis elegans. Nat Commun. 5:1–10. - PMC - PubMed

Publication types

LinkOut - more resources