. 2022 Mar 22;6(6):1766-1779.
doi: 10.1182/bloodadvances.2021005983.

Deleterious effect of bone marrow-resident macrophages on hematopoietic stem cells in response to total body irradiation

Affiliations

Deleterious effect of bone marrow-resident macrophages on hematopoietic stem cells in response to total body irradiation

Marion Chalot et al. Blood Adv. .

Abstract

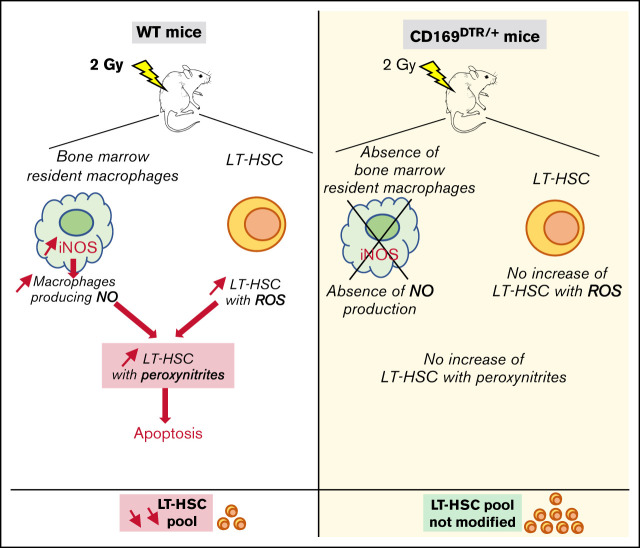
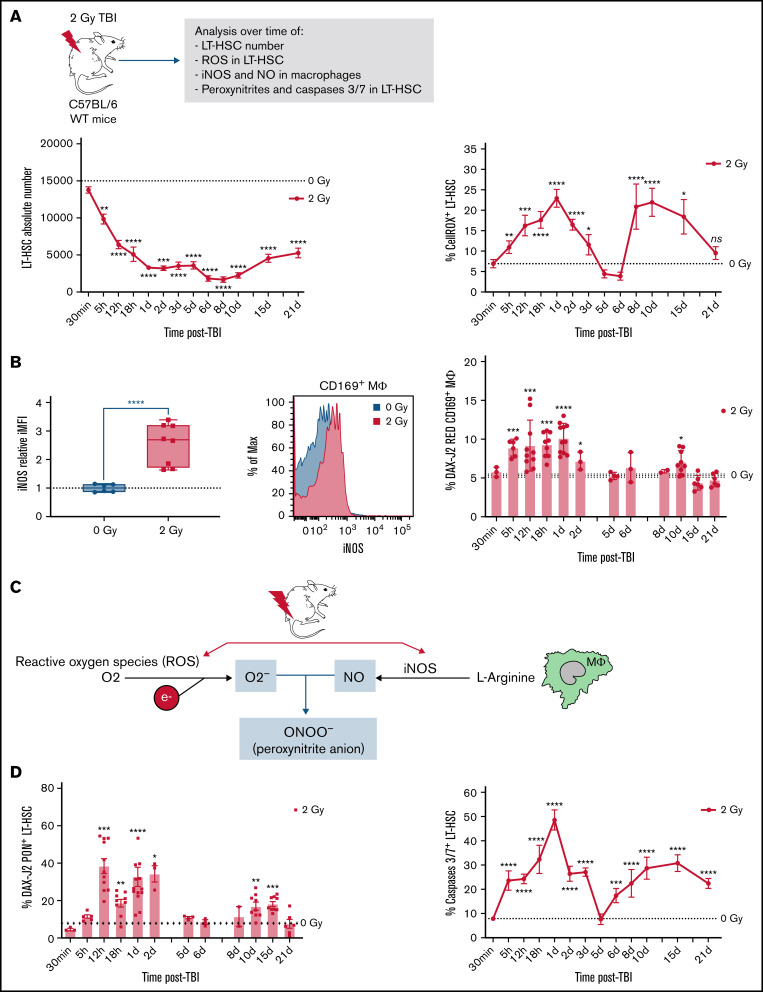
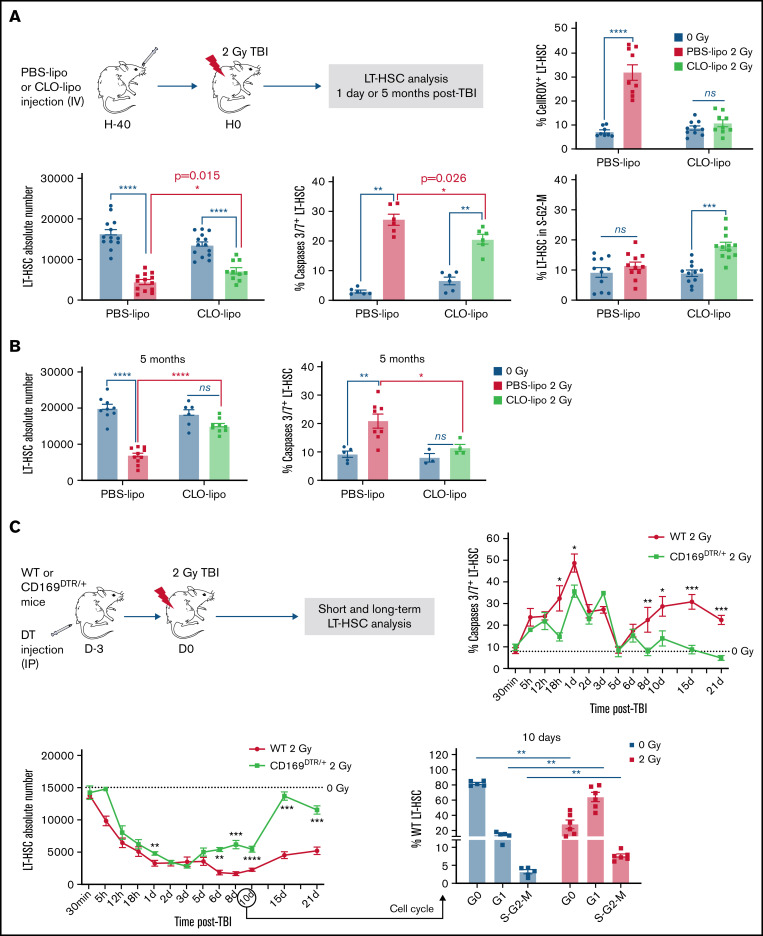
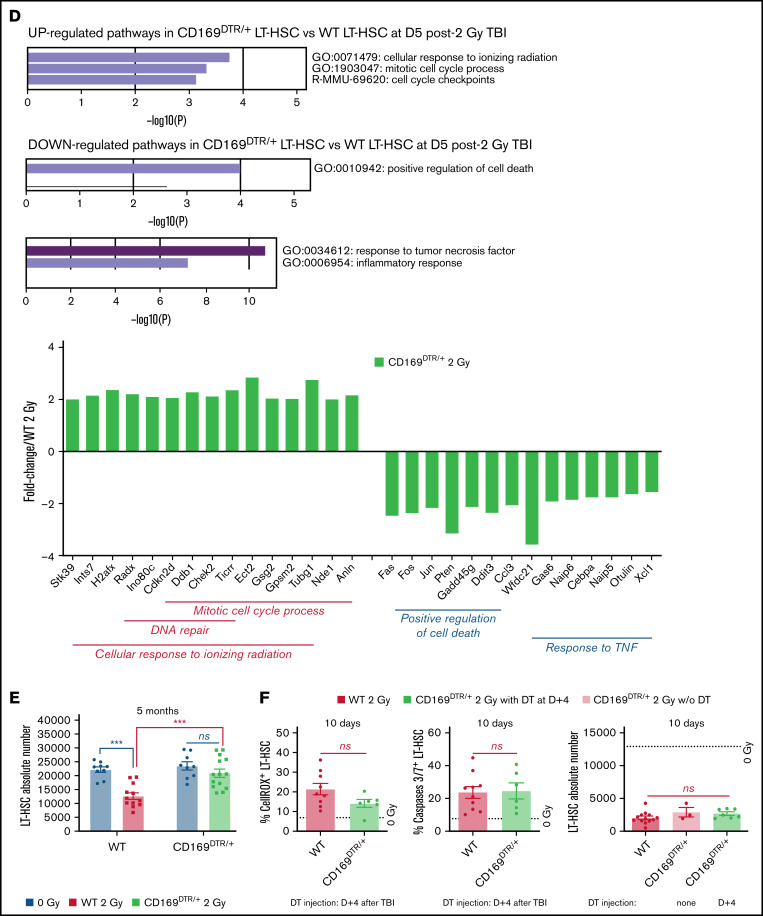
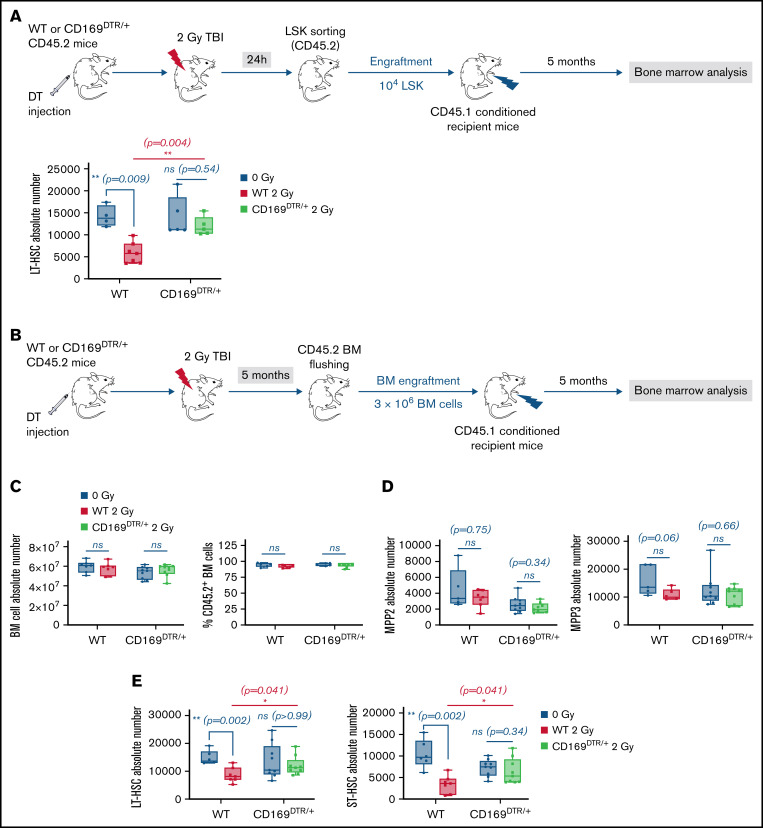
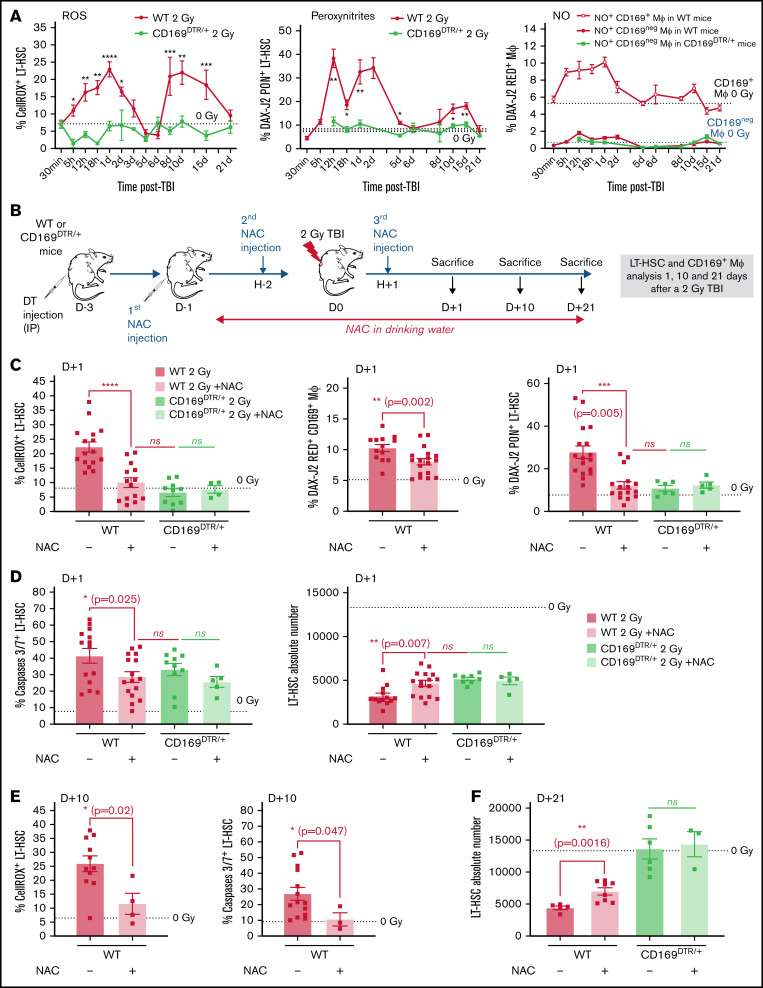
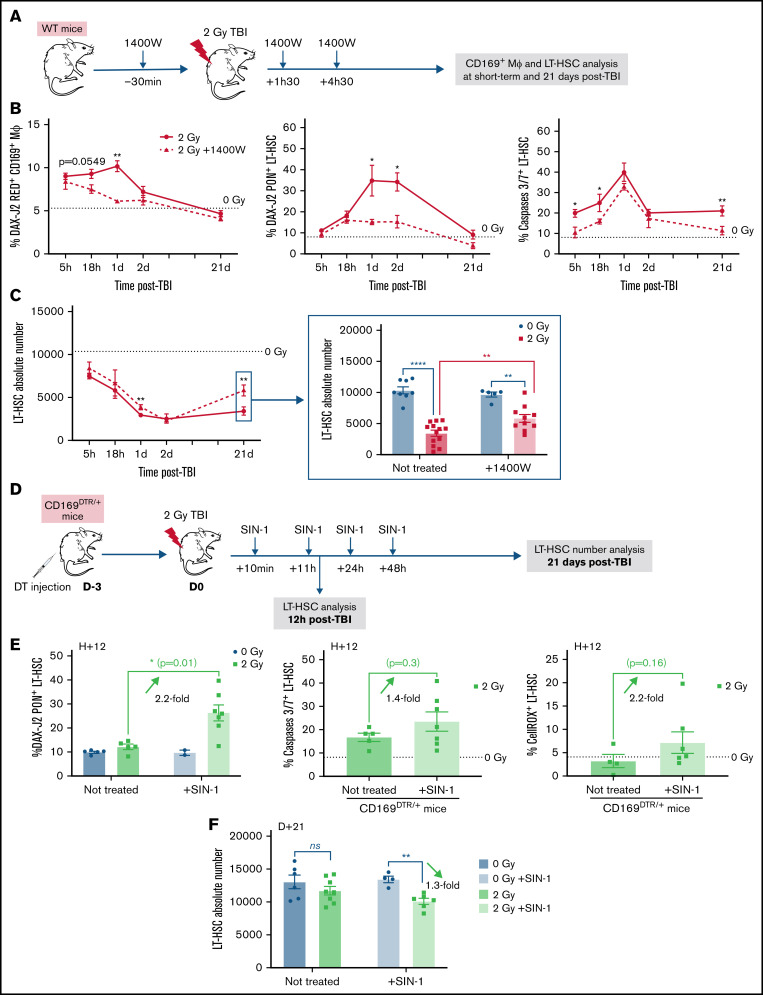
Bone marrow (BM) resident macrophages interact with a population of long-term hematopoietic stem cells (LT-HSCs) but their role on LT-HSC properties after stress is not well defined. Here, we show that a 2 Gy-total body irradiation (TBI)-mediated death of LT-HSCs is associated with increased percentages of LT-HSCs with reactive oxygen species (ROS) and of BM resident macrophages producing nitric oxide (NO), resulting in an increased percentage of LT-HSCs with endogenous cytotoxic peroxynitrites. Pharmacological or genetic depletion of BM resident macrophages impairs the radio-induced increases in the percentage of both ROS+ LT-HSCs and peroxynitrite+ LT-HSCs and results in a complete recovery of a functional pool of LT-HSCs. Finally, we show that after a 2 Gy-TBI, a specific decrease of NO production by BM resident macrophages improves the LT-HSC recovery, whereas an exogenous NO delivery decreases the LT-HSC compartment. Altogether, these results show that BM resident macrophages are involved in the response of LT-HSCs to a 2 Gy-TBI and suggest that regulation of NO production can be used to modulate some deleterious effects of a TBI on LT-HSCs.


Figures

None
Graphical abstract
Figure 1.
Figure 1.
Decreased number of LT-HSCs and increased percentages of ROS+ LT-HSCs, NO+ CD169+ macrophages (MΦ) and peroxynitrites+ LT-HSCs after a 2 Gy-TBI. (A) Kinetics of LT-HSC number (left) and the percentage of ROS+ LT-HSCs (right) in WT mice after a 2 Gy-TBI (n ≥ 3 mice for each time point). (B) Left: Increased iNOS expression in CD169+ MΦ of WT mice 1 day after a 2 Gy-TBI (n = 3 independent experiments) and representative flow analysis of iNOS expression in CD169+ MΦ 1 day after a 2 Gy-TBI. Right: Kinetics of CD169+ MΦ producing NO in WT mice after a 2 Gy-TBI (n ≥ 3 mice for each time point). (C) Scheme describing the formation of peroxynitrites from radio-induced production of ROS and NO. (D) Kinetics of peroxynitrites+ LT-HSCs (left) and of caspases 3/7+ LT-HSCs (right) in WT mice after a 2 Gy-TBI (n ≥ 3 mice for each time point). Data are represented with mean ± SEM or min to max box-and-whisker; *P < .05, **P < .01, ***P < .001, ****P < .0001 (2-tailed Mann-Whitney U test).
Figure 2.
Figure 2.
Effects of pharmacological or genetic depletion of CD169+ MΦ on LT-HSC fate short- and long-term after TBI. (A) Top: Scheme of the experimental protocol used for CLO-lipo treatment (left) and percentage of ROS+ LT-HSCs (right). Bottom: LT-HSC number (left), and percentages of caspases 3/7+ LT-HSCs (middle) and LT-HSCs in S-G2-M phases of the cell cycle (right) 1 day after a 2 Gy-TBI (n ≥ 5 mice). (B) LT-HSC number (left, n = 10 mice) and percentage of caspases 3/7+ LT-HSCs (right, n ≥ 4 mice) 5 months after a 2 Gy-TBI. (C) Top: Scheme of the experimental protocol used for DT injection in WT and CD169DTR/+ mice (left) and kinetics of caspases 3/7+ LT-HSC percentage (right). Bottom: Kinetics of LT-HSC number (left) in WT and CD169DTR/+ mice after a 2 Gy-TBI. Cell cycle analysis of WT LT-HSCs 10 days after a 2 Gy-TBI (right) (n ≥3 mice for each time point). (D) Transcriptomic analysis of CD169DTR/+ LT-HSCs vs WT LT-HSCs 5 days after a 2 Gy-TBI. Pathways up- and downregulated (top) and associated genes which are differentially expressed (bottom). (E) LT-HSC numbers in WT and CD169DTR/+ mice 5 months after a 2 Gy-TBI (n ≥ 12 mice). (F) Percentages of ROS+ (left) or caspases 3/7+ (middle) LT-HSCs and number of LT-HSCs (right) 10 days after a 2 Gy-TBI in WT and CD169DTR/+ mice DT-injected 4 days after TBI (n ≥ 3 mice). Data are represented with mean ± SEM; *P < .05, **P < .01, ***P < .001, ****P < .0001, ns: not statistically significant (2-tailed Mann-Whitney U test)
Figure 2.
Figure 2.
Effects of pharmacological or genetic depletion of CD169+ MΦ on LT-HSC fate short- and long-term after TBI. (A) Top: Scheme of the experimental protocol used for CLO-lipo treatment (left) and percentage of ROS+ LT-HSCs (right). Bottom: LT-HSC number (left), and percentages of caspases 3/7+ LT-HSCs (middle) and LT-HSCs in S-G2-M phases of the cell cycle (right) 1 day after a 2 Gy-TBI (n ≥ 5 mice). (B) LT-HSC number (left, n = 10 mice) and percentage of caspases 3/7+ LT-HSCs (right, n ≥ 4 mice) 5 months after a 2 Gy-TBI. (C) Top: Scheme of the experimental protocol used for DT injection in WT and CD169DTR/+ mice (left) and kinetics of caspases 3/7+ LT-HSC percentage (right). Bottom: Kinetics of LT-HSC number (left) in WT and CD169DTR/+ mice after a 2 Gy-TBI. Cell cycle analysis of WT LT-HSCs 10 days after a 2 Gy-TBI (right) (n ≥3 mice for each time point). (D) Transcriptomic analysis of CD169DTR/+ LT-HSCs vs WT LT-HSCs 5 days after a 2 Gy-TBI. Pathways up- and downregulated (top) and associated genes which are differentially expressed (bottom). (E) LT-HSC numbers in WT and CD169DTR/+ mice 5 months after a 2 Gy-TBI (n ≥ 12 mice). (F) Percentages of ROS+ (left) or caspases 3/7+ (middle) LT-HSCs and number of LT-HSCs (right) 10 days after a 2 Gy-TBI in WT and CD169DTR/+ mice DT-injected 4 days after TBI (n ≥ 3 mice). Data are represented with mean ± SEM; *P < .05, **P < .01, ***P < .001, ****P < .0001, ns: not statistically significant (2-tailed Mann-Whitney U test)
Figure 3.
Figure 3.
Effects of genetic depletion of CD169+ MΦ on LT-HSC functionality after TBI. (A) Top: Scheme of the experimental protocol of LSK engraftment. Bottom: Number of donor LT-HSCs in recipient mice 5 months after LSK transplantation (n = 3 independent experiments). (B) Scheme of the experimental protocol of BM engraftment. (C) BM cellularity (left) and chimerism (right) in recipient mice 5 months after BM transplantation (n = 3 independent experiments). (D) Numbers of donor MPP2 (left) and MPP3 (right) in recipient mice 5 months after BM transplantation (n = 3 independent experiments). (E) Numbers of donor LT-HSCs (left) and ST-HSCs (right) in recipient mice 5 months after BM transplantation (n = 3 independent experiments). Data are represented with min to max box-and-whisker; *P < .05, **P < .01, ns: not statistically significant (2-tailed Mann-Whitney U test).
Figure 4.
Figure 4.
Effects of CD169+ MΦ depletion or NAC treatment on the radio-induced increases of the percentages of ROS+ and peroxynitrite+ LT-HSCs. (A) Kinetics of percentages of ROS+ LT-HSCs (left) and peroxynitrite+ LT-HSCs (middle) in WT and CD169DTR/+ mice. Kinetics of percentages of CD169+ MΦ and CD169neg MΦ producing NO (right) in WT and CD169DTR/+ mice (n ≥ 3 mice for each time point). (B) Scheme of the experimental protocol for NAC treatment of WT or CD169DTR/+ mice. (C) Percentages of ROS+ LT-HSCs (left), of CD169+ MΦ producing NO (middle), and of peroxynitrite+ LT-HSCs (right) 1 day after a 2 Gy-TBI in WT and CD169DTR/+ mice treated or not with NAC. (D) Percentage of caspases 3/7+ LT-HSCs (left) and number of LT-HSCs (right) 1 day after a 2 Gy-TBI in WT and CD169DTR/+ mice treated or not with NAC (n ≥ 5 mice for each time point). (E) Percentages of ROS+ LT-HSCs (left) and caspases 3/7+ LT-HSCs (right) 10 days after a 2 Gy-TBI in WT mice treated or not with NAC (n ≥ 4 mice). (F) LT-HSC number 21 days after a 2 Gy-TBI in WT and CD169DTR/+ mice treated or not with NAC (n ≥ 4 mice for each time point). Data are represented with mean ± SEM; *P < .05, **P < .01, ***P < .001, ****P < .0001, ns: not statistically significant (2-tailed Mann-Whitney U test).
Figure 5.
Figure 5.
Modulation of NO production regulates LT-HSC recovery after a 2 Gy-TBI. (A) Scheme of the experimental protocol for the treatment of WT mice with the iNOS inhibitor (1400W) before and after a 2 Gy-TBI. (B) Kinetics of percentages of NO+ CD169+ MΦ (left), peroxynitrites+ LT-HSCs (middle), and caspases 3/7+ LT-HSCs (right) in WT mice treated or not with 1400W (n ≥ 4 mice for each time point). (C) Kinetics of LT-HSC number in WT mice treated or not with 1400W (n ≥ 4 mice for each time point). (D) Scheme of the experimental protocol for the treatment of CD169DTR/+ mice with the NO donor (SIN-1) after a 2 Gy-TBI. (E) Percentages of peroxynitrites+ LT-HSCs (left), caspases 3/7+ LT-HSCs (middle), and ROS+ LT-HSCs (right) 12 hours after a 2 Gy-TBI, in CD169DTR/+ mice treated or not with SIN-1 (n ≥ 5 mice). (F) LT-HSC number 21 days after a 2 Gy-TBI, in CD169DTR/+ mice treated or not with SIN-1 (n ≥ 6 mice). Data are represented with mean ± SEM; *P < .05, **P < .01, ****P < .0001, ns: not statistically significant (2-tailed Mann-Whitney U test).

Similar articles

Cited by

References

    1. Green DE, Rubin CT. Consequences of irradiation on bone and marrow phenotypes, and its relation to disruption of hematopoietic precursors. Bone. 2014;63:87-94. - PMC - PubMed
    1. Rodrigues-Moreira S, Moreno SG, Ghinatti G, et al. . Low-dose irradiation promotes persistent oxidative stress and decreases self-renewal in hematopoietic stem cells. Cell Rep. 2017;20(13):3199-3211. - PubMed
    1. Willey JS, Lloyd SAJ, Robbins ME, et al. . Early increase in osteoclast number in mice after whole-body irradiation with 2 Gy X rays. Radiat Res. 2008;170(3):388-392. - PMC - PubMed
    1. Guo C-Y, Luo L, Urata Y, et al. . Sensitivity and dose dependency of radiation-induced injury in hematopoietic stem/progenitor cells in mice. Sci Rep. 2015;5(1):8055. - PMC - PubMed
    1. Lu Y, Hu M, Zhang Z, Qi Y, Wang J. The regulation of hematopoietic stem cell fate in the context of radiation. Radiat. Med. Prot. 2020;1(1):31-34.

Publication types

Substances