

Bromodomain Inhibition Reveals FGF15/19 As a Target of Epigenetic Regulation and Metabolic Control
- PMID: 35100352
- PMCID: PMC9044127
- DOI: 10.2337/db21-0574
Bromodomain Inhibition Reveals FGF15/19 As a Target of Epigenetic Regulation and Metabolic Control
Abstract
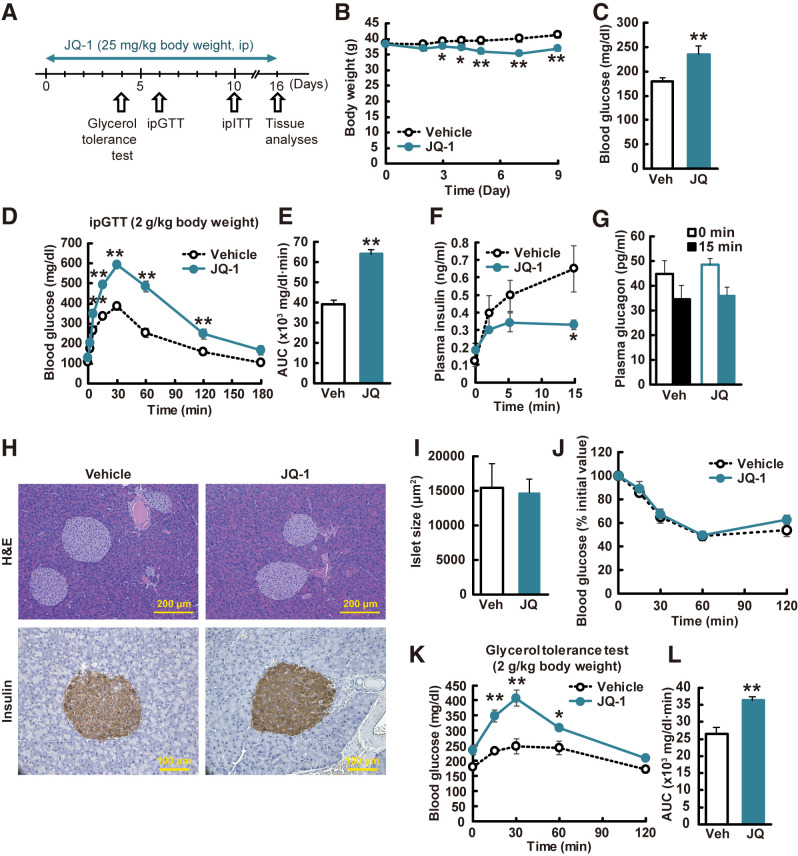
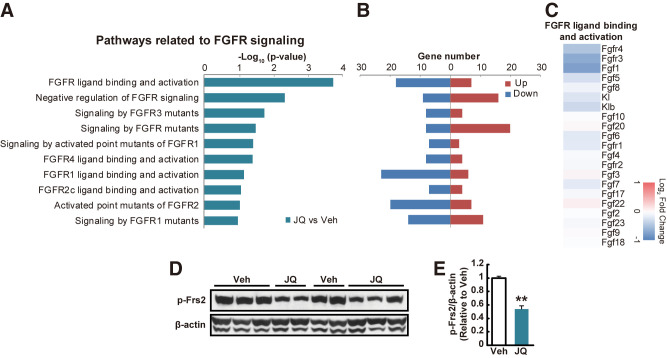
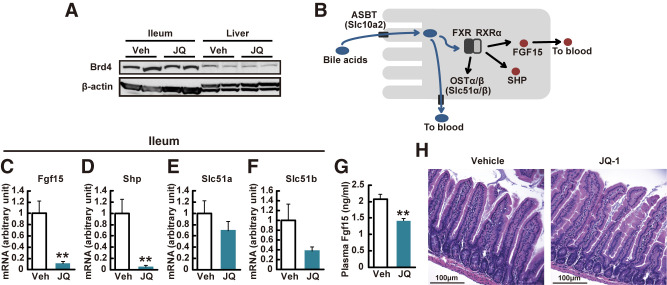
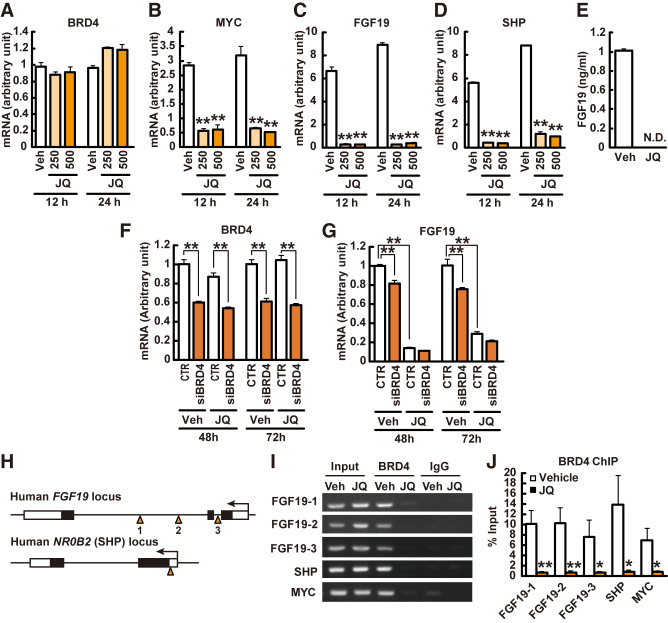
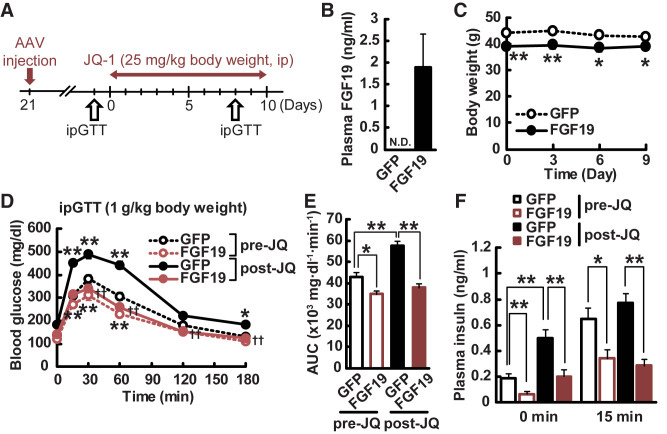
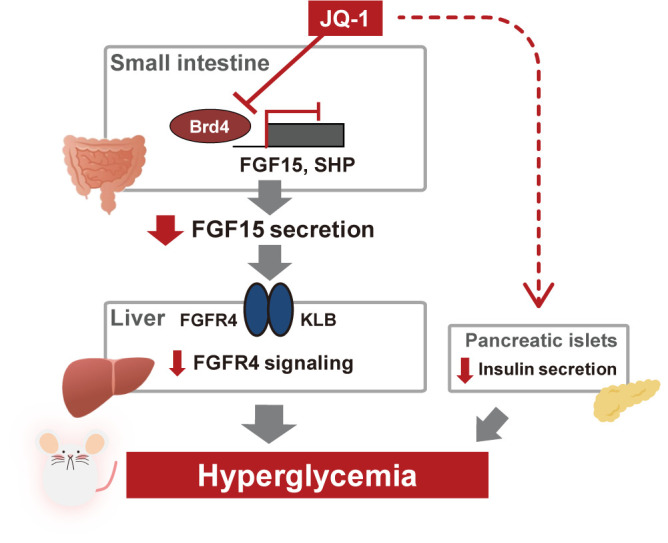
Epigenetic regulation is an important factor in glucose metabolism, but underlying mechanisms remain largely unknown. Here we investigated epigenetic control of systemic metabolism by bromodomain-containing proteins (Brds), which are transcriptional regulators binding to acetylated histone, in both intestinal cells and mice treated with the bromodomain inhibitor JQ-1. In vivo treatment with JQ-1 resulted in hyperglycemia and severe glucose intolerance. Whole-body or tissue-specific insulin sensitivity was not altered by JQ-1; however, JQ-1 treatment reduced insulin secretion during both in vivo glucose tolerance testing and ex vivo incubation of isolated islets. JQ-1 also inhibited expression of fibroblast growth factor (FGF) 15 in the ileum and decreased FGF receptor 4-related signaling in the liver. These adverse metabolic effects of Brd4 inhibition were fully reversed by in vivo overexpression of FGF19, with normalization of hyperglycemia. At a cellular level, we demonstrate Brd4 binds to the promoter region of FGF19 in human intestinal cells; Brd inhibition by JQ-1 reduces FGF19 promoter binding and downregulates FGF19 expression. Thus, we identify Brd4 as a novel transcriptional regulator of intestinal FGF15/19 in ileum and FGF signaling in the liver and a contributor to the gut-liver axis and systemic glucose metabolism.
© 2022 by the American Diabetes Association.
Figures
Similar articles
-
Epigenetic blockade of neoplastic transformation by bromodomain and extra-terminal (BET) domain protein inhibitor JQ-1.Biochem Pharmacol. 2016 Oct 1;117:35-45. doi: 10.1016/j.bcp.2016.08.009. Epub 2016 Aug 9. Biochem Pharmacol. 2016. PMID: 27520485 Free PMC article.
-
Mouse species-specific control of hepatocarcinogenesis and metabolism by FGF19/FGF15.J Hepatol. 2017 Jun;66(6):1182-1192. doi: 10.1016/j.jhep.2017.01.027. Epub 2017 Feb 9. J Hepatol. 2017. PMID: 28189755
-
FXR Primes the Liver for Intestinal FGF15 Signaling by Transient Induction of β-Klotho.Mol Endocrinol. 2016 Jan;30(1):92-103. doi: 10.1210/me.2015-1226. Epub 2015 Oct 27. Mol Endocrinol. 2016. PMID: 26505219 Free PMC article.
-
Role of fibroblast growth factor 19 in the control of glucose homeostasis.Curr Opin Clin Nutr Metab Care. 2012 Jul;15(4):386-91. doi: 10.1097/MCO.0b013e3283547171. Curr Opin Clin Nutr Metab Care. 2012. PMID: 22617565 Review.
-
Metabolic Messengers: fibroblast growth factor 15/19.Nat Metab. 2019 Jun;1(6):588-594. doi: 10.1038/s42255-019-0074-3. Epub 2019 Jun 14. Nat Metab. 2019. PMID: 32694803 Review.
Cited by
-
BRD4 Signaling Maintains the Differentiated State of β Cells.Adv Sci (Weinh). 2025 Sep;12(33):e05659. doi: 10.1002/advs.202505659. Epub 2025 Jun 20. Adv Sci (Weinh). 2025. PMID: 40539402 Free PMC article.
-
Epigenetics in diabetic cardiomyopathy.Clin Epigenetics. 2024 Apr 5;16(1):52. doi: 10.1186/s13148-024-01667-1. Clin Epigenetics. 2024. PMID: 38581056 Free PMC article. Review.
-
Roles of Bromodomain Extra Terminal Proteins in Metabolic Signaling and Diseases.Pharmaceuticals (Basel). 2022 Aug 22;15(8):1032. doi: 10.3390/ph15081032. Pharmaceuticals (Basel). 2022. PMID: 36015180 Free PMC article. Review.
-
Regulation of Carbohydrate-Responsive Metabolic Genes by Histone Acetylation and the Acetylated Histone Reader BRD4 in the Gene Body Region.Front Mol Biosci. 2021 Jul 15;8:682696. doi: 10.3389/fmolb.2021.682696. eCollection 2021. Front Mol Biosci. 2021. PMID: 34336926 Free PMC article. Review.
References
-
- Verdin E, Ott M. 50 years of protein acetylation: from gene regulation to epigenetics, metabolism and beyond. Nat Rev Mol Cell Biol 2015;16:258–264 - PubMed
-
- Yamauchi T, Oike Y, Kamon J, et al. . Increased insulin sensitivity despite lipodystrophy in Crebbp heterozygous mice. Nat Genet 2002;30:221–226 - PubMed
-
- Gaur V, Connor T, Sanigorski A, et al. . Disruption of the class IIa HDAC corepressor complex increases energy expenditure and lipid oxidation. Cell Rep 2016;16:2802–2810 - PubMed
Publication types
MeSH terms
Substances
Associated data
Grants and funding
LinkOut - more resources
Full Text Sources
Medical
Research Materials
