Efficacy of Repair for ACL Injury: A Meta‑analysis of Randomized Controlled Trials
- PMID: 35100655
- PMCID: PMC9713465
- DOI: 10.1055/a-1755-4925
Efficacy of Repair for ACL Injury: A Meta‑analysis of Randomized Controlled Trials
Abstract
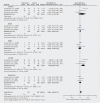
We aim to compare the curative effect of primary repair for anterior cruciate ligament (ACL) injury with reconstruction and provide the reliable evidence for its clinical application. The literatures were searched in PubMed, EMBASE, Springer, and other medical literature databases published between January 1970 and June 2021. Basic characteristics, surgery technique, clinical outcome scores and physical examination results were recorded and evaluated. Seven randomized controlled trials (RCT) were eligible for inclusion. The results showed that there were no statistically significant differences between arthroscopic ACL repair and ACL reconstruction for Tegner, Lysholm, Lachman, KT-1000, range of motion (ROM), functional outcomes and reoperation rate (P>0.05), even the result of IKDC scores showed that arthroscopic repair was better than reconstruction (P=0.04). However, through the subgroup analysis, it was found that the short-term follow-up results of arthroscopic ACL repair were indeed better than those of open ACL repair. Therefore, we can assume that the arthroscopic ACL repair technique is an optional and promising surgical method to treat ACL injury.
The Author(s). This is an open access article published by Thieme under the terms of the Creative Commons Attribution-NonDerivative-NonCommercial-License, permitting copying and reproduction so long as the original work is given appropriate credit. Contents may not be used for commercial purposes, or adapted, remixed, transformed or built upon. (https://creativecommons.org/licenses/by-nc-nd/4.0/).
Conflict of interest statement
The authors declare that they have no conflict of interest.
Figures


Similar articles
-
Arthroscopic anterior cruciate ligament repair for proximal anterior cruciate ligament tears in skeletally immature patients: Surgical technique and preliminary results.Knee. 2017 Jan;24(1):40-48. doi: 10.1016/j.knee.2016.09.017. Epub 2016 Nov 2. Knee. 2017. PMID: 27815015
-
Clinical Outcomes of Arthroscopic Primary Anterior Cruciate Ligament Repair: A Systematic Review from the Scientific Anterior Cruciate Ligament Network International Study Group.Arthroscopy. 2020 Feb;36(2):594-612. doi: 10.1016/j.arthro.2019.09.021. Arthroscopy. 2020. PMID: 32014188
-
[Evaluation of Outcomes after Anterior Cruciate Ligament Reconstruction in Children and Adolescents].Acta Chir Orthop Traumatol Cech. 2015;82(6):398-403. Acta Chir Orthop Traumatol Cech. 2015. PMID: 26787179 Czech.
-
Repair versus reconstruction for proximal anterior cruciate ligament tears: a study protocol for a prospective multicenter randomized controlled trial.BMC Musculoskelet Disord. 2021 Apr 30;22(1):399. doi: 10.1186/s12891-021-04280-y. BMC Musculoskelet Disord. 2021. PMID: 33931067 Free PMC article.
-
Good mid-term outcomes and low rates of residual rotatory laxity, complications and failures after revision anterior cruciate ligament reconstruction (ACL) and lateral extra-articular tenodesis (LET).Knee Surg Sports Traumatol Arthrosc. 2020 Feb;28(2):418-431. doi: 10.1007/s00167-019-05625-w. Epub 2019 Jul 19. Knee Surg Sports Traumatol Arthrosc. 2020. PMID: 31324964
Cited by
-
Repair with suture tape augmentation vs. reconstruction for ACL tears: A systematic review and meta-analysis.J Orthop. 2024 Nov 19;64:130-138. doi: 10.1016/j.jor.2024.11.013. eCollection 2025 Jun. J Orthop. 2024. PMID: 39720464 Review.
-
Comparison of Clinical Outcomes Between Modern Augmented ACL Repair and Autograft ACL Reconstruction: A Systematic Review and Meta-analysis of Studies With Minimum 2-Year Follow-up.Orthop J Sports Med. 2024 Jan 25;12(1):23259671231223743. doi: 10.1177/23259671231223743. eCollection 2024 Jan. Orthop J Sports Med. 2024. PMID: 38282789 Free PMC article. Review.
-
Standardized treatment of infection after anterior cruciate ligament reconstruction.Sci Rep. 2024 Sep 27;14(1):22332. doi: 10.1038/s41598-024-65546-8. Sci Rep. 2024. PMID: 39333207 Free PMC article.
-
A deep learning approach for anterior cruciate ligament rupture localization on knee MR images.Front Bioeng Biotechnol. 2022 Sep 30;10:1024527. doi: 10.3389/fbioe.2022.1024527. eCollection 2022. Front Bioeng Biotechnol. 2022. PMID: 36246358 Free PMC article.
-
Functional outcome of anterior cruciate ligament reconstruction with hamstring tendon autograft in Indian population: A systematic review and meta-analysis.J Clin Orthop Trauma. 2024 Nov 12;59:102805. doi: 10.1016/j.jcot.2024.102805. eCollection 2024 Dec. J Clin Orthop Trauma. 2024. PMID: 39650719 Review.
References
-
- Cabaud H E, Feagin J A, Rodkey W G. Acute anterior cruciate ligament injury and augmented repair. Experimental studies. Am J Sports Med. 1980;8:395–401. - PubMed
-
- Feagin J A, Abbott H G, Rokous J R. Isolated tear of the anterior cruciate ligament: 5-year follow-up study. Am J Sports Med. 1976;4:95–100. - PubMed
-
- Spencer E E, Chissell H R, Spang J T et al.Behavior of sutures used in anterior cruciate ligament reconstructive surgery. Knee Surg Sports Traumatol Arthrosc. 1996;4:84–88. - PubMed
MeSH terms
LinkOut - more resources
Full Text Sources
Medical

