. 2021 Feb 22;13(1):e0375421.
doi: 10.1128/mbio.03754-21. Epub 2022 Feb 1.

Force-Induced Changes of PilY1 Drive Surface Sensing by Pseudomonas aeruginosa

Affiliations

Force-Induced Changes of PilY1 Drive Surface Sensing by Pseudomonas aeruginosa

Shanice S Webster et al. mBio. .

Abstract

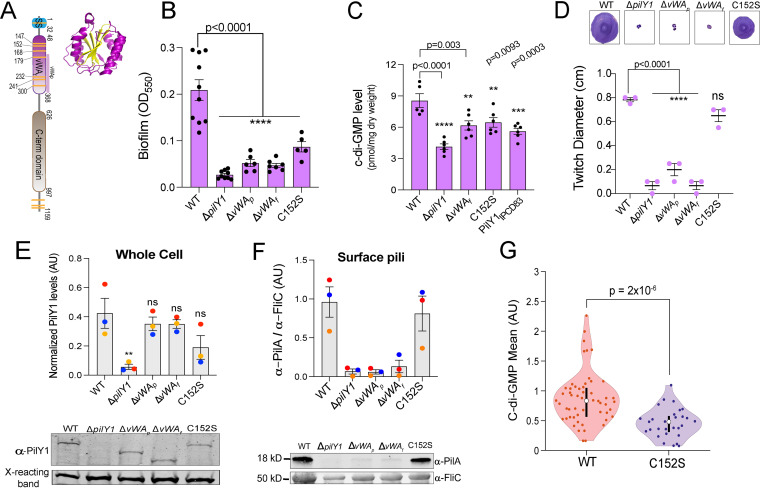
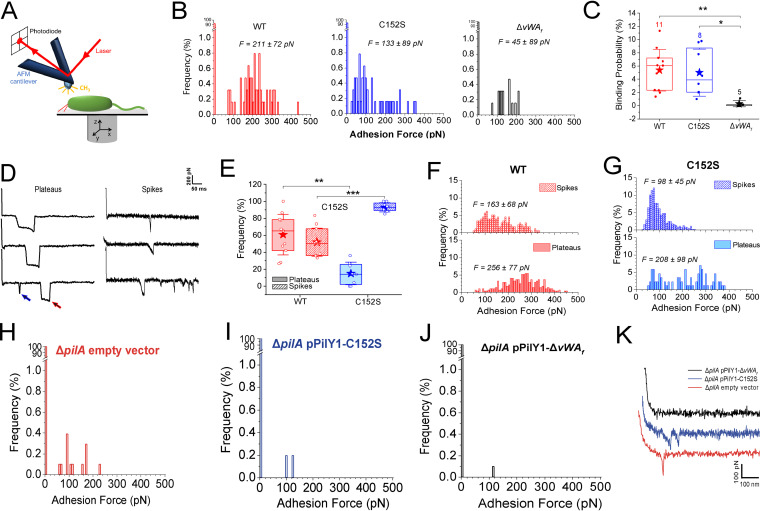
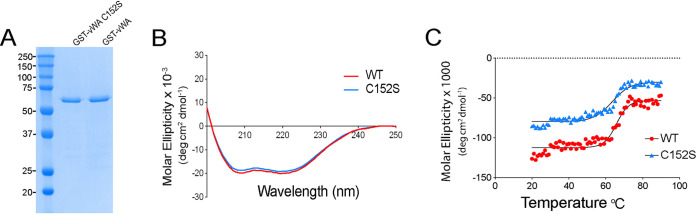
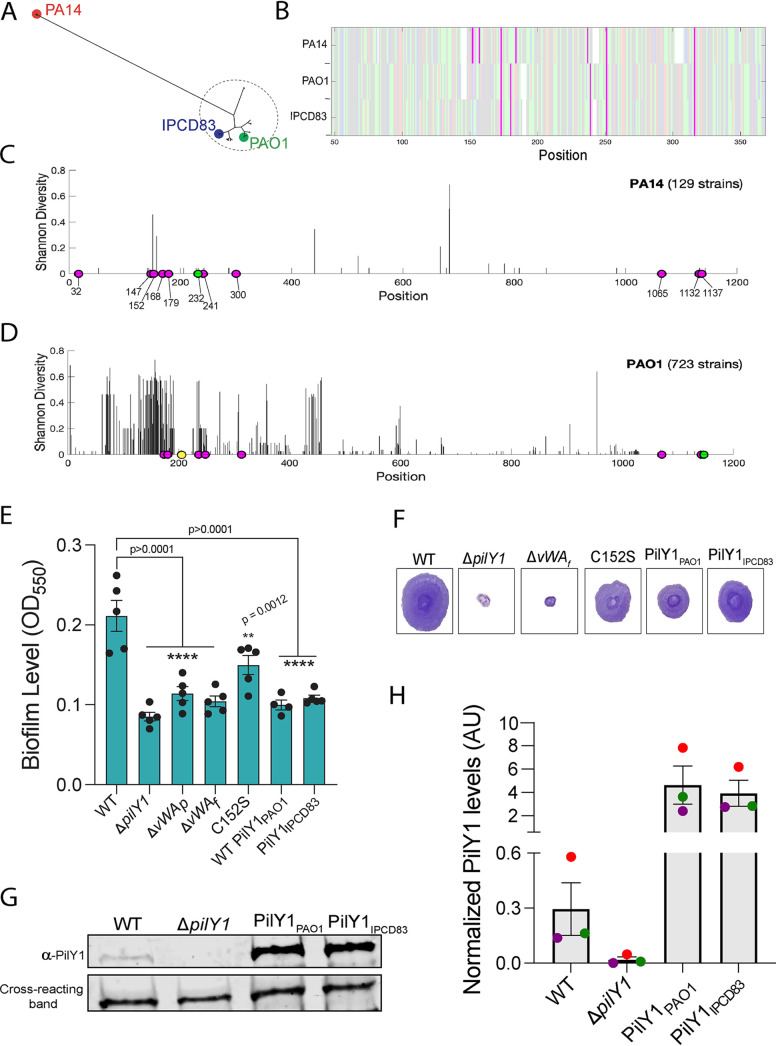
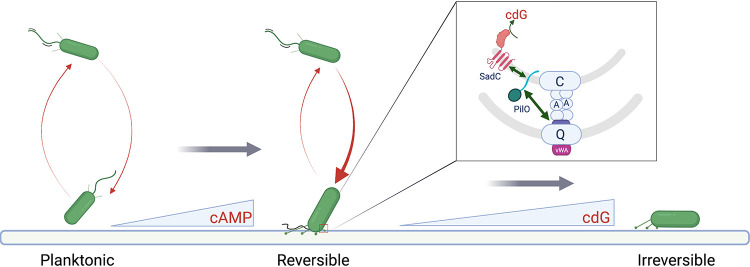
During biofilm formation, the opportunistic pathogen Pseudomonas aeruginosa uses its type IV pili (TFP) to sense a surface, eliciting increased second-messenger production and regulating target pathways required to adapt to a surface lifestyle. The mechanisms whereby TFP detect surface contact are still poorly understood, although mechanosensing is often invoked, with few data supporting this claim. Using a combination of molecular genetics and single-cell analysis, with biophysical, biochemical, and genomics techniques, we show that force-induced changes mediated by the von Willebrand A (vWA) domain-containing, TFP tip-associated protein PilY1 are required for surface sensing. Atomic force microscopy shows that TFP/PilY1 can undergo force-induced, sustained conformational changes akin to those observed for mechanosensitive proteins like titin. We show that mutation of a single cysteine residue in the vWA domain of PilY1 results in modestly lower surface adhesion forces, reduced sustained conformational changes, and increased nanospring-like properties, as well as reduced c-di-GMP signaling and biofilm formation. Mutating this cysteine has allowed us to genetically separate a role for TFP in twitching motility from surface-sensing signaling. The conservation of this Cys residue in all P. aeruginosa PA14 strains and its absence in the ∼720 sequenced strains of P. aeruginosa PAO1 may contribute to explaining the observed differences in surface colonization strategies observed for PA14 versus PAO1. IMPORTANCE Most bacteria live on abiotic and biotic surfaces in surface-attached communities known as biofilms. Surface sensing and increased levels of the second-messenger molecule c-di-GMP are crucial to the transition from planktonic to biofilm growth. The mechanism(s) underlying TFP-mediated surface detection that triggers this c-di-GMP signaling cascade is unclear. Here, we provide key insight into this question; we show that the eukaryote-like vWA domain of the TFP tip-associated protein PilY1 responds to mechanical force, which in turn drives the production of a key second messenger needed to regulate surface behaviors. Our studies highlight a potential mechanism that may account for differing surface colonization strategies.

Keywords: PilY1; c-di-GMP; force; surface sensing; type 4 pili; von Willebrand A domain.


Conflict of interest statement

The authors declare no conflict of interest.

Figures

FIG 1
FIG 1
The von Willebrand A (vWA) domain and Cys152 residue of PilY1 are important for regulating c-di-GMP levels and biofilm formation. (A) Schematic showing domain organization of the PilY1 protein. The signal sequence (SS; blue, amino acids 1 to 32), vWA domain (pink, amino acids 48 to 368), and C-terminal (C-term) domain (brown, amino acids 626 to 997) are highlighted. vWAp (amino acids S178 to S365) denotes a portion of the vWA domain that is deleted from a mutant analyzed in the subsequent panels. Yellow stripes represent the cysteines residues present in the protein. The vWA domain contains 7 of the 11 cysteine residues present in the full-length PilY1 protein, with the SS and the C-terminal region having 1 and 3 cysteine residues, respectively. (Inset) Ribbon diagram showing the vWF A2 domain (PDB accession no. 3GXB). The domain shows a classical Rossmann fold (8), comprised of central β-sheets (yellow) surrounded by α-helices (purple). (B) Biofilm formation measured at an OD550 for the WT, the ΔpilY1 deletion mutant, the vWA domain variants, and the Cys152S mutant in a static 96-well biofilm assay performed in M8 medium salts plus supplements (see Materials and Methods) and incubated at 37°C for 24 h. vWAp (amino acids 178 to 365 [see panel A]) and vWAf indicate a partial and a full (amino acids 48 to 368) deletion of the vWA domain, respectively. Data are from at least five biological replates, each with eight technical replicates. (C) Quantification of global c-di-GMP levels by mass spectrometry for the WT and the indicated mutants, shown in picomoles per milligram (dry weight). Cells were grown on 0.52% agar plates prepared with M8 medium salts plus supplements and then scraped from the plates after incubation for 37°C for 14 to 16 h. Data are from six biological replicates, each with two technical replicates. (D) Twitch diameter (in centimeters) for the WT and the indicated mutants measured after inoculating LB plates from overnight cultures and then incubating the plates for 24 h at 37°C plus for an additional day at room temperature. Representative images of twitch zones are shown above the graph. Data are from three biological replicates. (E) Quantification of normalized PilY1 protein levels in whole cells (in arbitrary units [AU]) for the WT and the indicated mutants. Cells were subcultured from an overnight culture and grown to mid-log phase in M8 medium salts plus supplements and normalized to the same OD600 value. Protein levels in whole-cell extracts are normalized to a cross-reacting band at ∼60 kDa, which is used as an additional loading control. The Cys152S mutant shows a modest but not significant reduction in PilY1 levels in whole-cell extracts. A representative Western blot image for PilY1 and the cross-reacting band is shown below the graph. (F) Quantification of normalized surface pilus levels. PilA (∼18 kDa) protein levels are used as a surrogate for surface pilus levels, which are normalized to levels of the flagellar protein, FliC (∼50 kDa). A representative Western blot is shown below the graph. All Western blot data are from three biological replicates in three independent experiments. Dots with the same color represent the same biological replicate; different colors indicate different biological replicates. *, P ≤ 0.05; ns, not significant. All error bars are standard errors of the means (SEM), and statistical significance was determined by one-way ANOVA and a Dunnett’s post hoc test. ****, P ≤ 0.0001; ***, P ≤ 0.001; **, P ≤ 0.01. (G) Violin plots showing the mean c-di-GMP of the WT strain and a strain expressing the vWA-Cys152S PilY1 variant during early biofilm formation. c-di-GMP level was quantified from GFP intensity, determined on a cell-by-cell basis in a microfluidic chamber for cells carrying the PcdrA-GFP construct, which is a reporter of c-di-GMP levels. Note that the WT data shown here were first reported in a previous publication (23); each strain analysis was done independently, in the same system and medium, with the same microscope at identical settings and processed as reported previously (23). Given that each analysis is independent but performed identically, we can compare data from previous studies. Each data point represents one tracked cell through an entire division cycle. Statistical significance was determined using the Kruskal-Wallis test (P = 2 × 10−6).
FIG 2
FIG 2
Strains expressing the PilY1-Cys152S mutation display less adhesion force and altered mechanical behaviors than strains expressing WT PilY1. (A) For AFM measurements, it is required that probed cells are immobile. To immobilize the cells, we used a hydrophobic polystyrene surface that allowed for sufficient binding of the bacterium to the surface through its cell envelope to immobilize the cell. Force-distance curves were recorded in a square array at a bacterial pole (see Materials and Methods), because the pili are localized to the pole, which involved sequentially approaching the AFM tip toward the cell pole, making contact, and then retracting the tip. Adhesive interactions occurring between the pilus and the AFM tip upon contact allow catching and subsequently stretching the pilus as the AFM tip is retracted, which causes a deflection of the cantilever. This deflection is recorded by a laser beam and photodiode and is directly proportional to tensile force. The tensile force in the stretched pili can be determined from the generated force-distance curves. (B) Adhesion force histograms between the hydrophobic AFM tip and a representative WT strain or strains expressing the Cys152S or ΔvWAf variants of PilY1. For the WT, 211 ± 72 pN (n = 55 adhesive curves); for the vWA-Cys152S, 133 ± 89 pN (n = 47); and for the ΔvWAf, 45 ± 89 pN (n = 16). (C) Box plots comparing the binding probabilities of cells expressing WT PilY1 and of strains expressing the Cys152S or ΔvWAf variant of PilY1 are shown. The numbers of probed cells are indicated. Stars are the mean values, lines the medians, boxes the 25 to 75% quartiles, and whiskers the standard deviations (SD). *, P ≤ 0.05; **, P ≤ 0.01 (Student's t test). (D) Representative retraction force profiles exhibited by the WT or Cys152S mutant cells sorted based on their shape. Plateaus are defined as adhesive events with a “step” behavior, i.e., a constant sustained force over a defined length of time, while spikes are defined as sharp adhesive events with a single minimum. A single retraction profile can feature several plateaus (red arrow) and spikes (blue arrow), and both signatures can occur as marked by the arrows. (E) Box plots comparing the occurrences of plateau (shaded) and spike (striped) signatures for the WT and Cys152S mutant cells. The number of probed cells is as described for panel C. For the WT, plateaus were 60.8% ± 24.0% and spikes were 51.9% ± 16.6% (n = 11), and for Cys152S mutant, plateaus were 14.9% ± 13.3% and spikes were 93.1% ± 5.4% (n = 8). Stars are the mean values, lines the medians, boxes the 25 to 75% quartiles, and whiskers the SD. **, P ≤ 0.01; ***, P ≤ 0.001 (Student's t test). (F and G) Distribution of the adhesion forces exhibited by either the plateaus or the spikes for the WT (F) or the strain carrying the Cys152S mutant of PilY1 (G). The mean values are provided along with the histograms. All data were obtained by recording force-distance curves in medium containing M8 salts with an applied force of 250 pN and a pulling speed of 5 μm/s at room temperature. (H to K) The pilus fiber is required for adhesion to a surface. (H to J) Adhesion force histograms obtained by recording force-distance curves between the hydrophobic cantilever tip and representative ΔpilA/pPilY1 (H), ΔpilA/pPilY1-Cys152S (I), and ΔpilA/pPilY1-ΔvWAf (J) strains. (K) Representative retraction force profiles shown for the same strains.
FIG 3
FIG 3
vWA-C152S mutation does not substantially alter conformation of the vWA domain in solution. (A) Coomassie blue-stained SDS-PAGE of ∼1 μg of purified wild-type GST-vWA domain and GST–vWA-C152S fusion proteins expressed from a pGEX plasmid backbone and purified from E. coli BL21(DE3) cells as detailed in Materials and Methods. The molecular weight markers are indicated. (B) Far-UV circular dichroism (CD) spectra shown in molar ellipticity for the WT GST-vWA domain (red line) and GST–vWA-C152S mutant (blue line) between 195 and 250 nm at 20°C. (C) Curves of ellipticity at a 208-nm wavelength as a function of temperature for the WT and mutant fusion proteins. Spectra were recorded for each sample from 20 to 90°C in 1° increments. Curves were fitted to a Boltzmann sigmoidal equation, and the V50 value (mid-point of the slope) was determined (65.8 versus 63.5°C for the GST-WT vWA domain and GST–vWA-C152S fusion variant, respectively).
FIG 4
FIG 4
Comparative genomic analyses reveal sequence and functional differences between PA14 and PAO1 alleles of PilY1. (A) Phylogenetic tree of PilY1 amino acid sequences obtained from the IPCD database of P. aeruginosa genomes (28) showing two distinct clades of PilY1 sequences corresponding to strains from the previously determined P. aeruginosa PA14 and PAO1 clades. The strain labeled IPCD83 is an isolate within the PAO1 clade. (B) Alignment of the vWA domain (amino acids 48 to 368) of PilY1 proteins found in the PA14, PAO1, and IPCD83 strains, with cysteines highlighted in magenta. Positive, negative, polar, and hydrophobic amino acids are depicted in light pink, blue, green, and gray, respectively. (C) Shannon diversity index along the PilY1 amino acid sequence for the 129 PilY1 proteins belonging to the PA14 clade. Fully conserved cysteines are highlighted in magenta. One strain is missing the cysteine depicted in green. (D) Shannon diversity index along the PilY1 amino acid sequence for the 723 versions of PilY1 proteins belonging to the PAO1 clade. Fully conserved cysteines are highlighted in magenta. One strain is missing the cysteine depicted in green, and one strain has an extra cysteine depicted in yellow. (E) Biofilm formation measured at an OD550 in a static 96-well assay for the indicated strains. Hybrid P. aeruginosa PA14 strains carry the PilY1 protein from PAO1 (PilY1PAO1) or the PilY1 protein from the IPCD83 strain (PilY1IPCD83), replacing the coding region for the P. aeruginosa PA14 PilY1 protein. In all cases, the mutant PilY1 variants are expressed from the native locus of P. aeruginosa PA14. Error bars are SEM, and statistical significance shown was determined by one-way ANOVA and Dunnett’s post hoc test. ****, P ≤ 0.0001; ***, P ≤ 0.001; **, P ≤ 0.01; ns, not significant. (F) Representative images of twitch zones shown for the indicated strains. (G) Representative Western blot image for steady-state PilY1 protein levels in whole cells expressing WT PilY1, the ΔpilY1 mutant, PilY1PAO1, and PilY1IPCD83. (H) Quantification of normalized PilY1 protein levels from whole cells for strains shown in panel G. Protein level is normalized to a cross-reacting band at ∼60 kDa. Data are from three biological replicates in three independent experiments. Dots with the same color represent the same biological replicate; different colors indicate different biological replicates.
FIG 5
FIG 5
Proposed model for mechanical force driven transition from planktonic to irreversible attachment. Planktonic bacteria interact with the surface and increase cAMP levels and surface pilus levels. The proposed PilY1-PilO interaction can in turn drive the documented PilO-SadC signal transduction cascade, which stimulates c-di-GMP (cdG) signaling and increased biofilm formation.

References

    1. Ellison CK, Kan J, Dillard RS, Kysela DT, Ducret A, Berne C, Hampton CM, Ke Z, Wright ER, Biais N, Dalia AB, Brun YV. 2017. Obstruction of pilus retraction stimulates bacterial surface sensing. Science 358:535–538. doi:10.1126/science.aan5706. - DOI - PMC - PubMed
    1. Persat A, Inclan YF, Engel JN, Stone HA, Gitai Z. 2015. Type IV pili mechanochemically regulate virulence factors in Pseudomonas aeruginosa. Proc Natl Acad Sci U S A 112:7563–7568. doi:10.1073/pnas.1502025112. - DOI - PMC - PubMed
    1. Luo Y, Zhao K, Baker AE, Kuchma SL, Coggan KA, Wolfgang MC, Wong GCL, O’Toole GA. 2015. A hierarchical cascade of second messengers regulates Pseudomonas aeruginosa surface behaviors. mBio 6:e02456-14. doi:10.1128/mBio.02456-14. - DOI - PMC - PubMed
    1. Siryaporn A, Kuchma SL, O'Toole GA, Gitai Z. 2014. Surface attachment induces Pseudomonas aeruginosa virulence. Proc Natl Acad Sci U S A 111:16860–16865. doi:10.1073/pnas.1415712111. - DOI - PMC - PubMed
    1. Rodesney CA, Roman B, Dhamani N, Cooley BJ, Katira P, Touhami A, Gordon VD. 2017. Mechanosensing of shear by Pseudomonas aeruginosa leads to increased levels of the cyclic-di-GMP signal initiating biofilm development. Proc Natl Acad Sci U S A 114:5906–5911. doi:10.1073/pnas.1703255114. - DOI - PMC - PubMed

Publication types

MeSH terms

LinkOut - more resources