. 2022 Jan 31;23(1):39.
doi: 10.1186/s13059-022-02610-4.

AGAMEMNON: an Accurate metaGenomics And MEtatranscriptoMics quaNtificatiON analysis suite

Affiliations

AGAMEMNON: an Accurate metaGenomics And MEtatranscriptoMics quaNtificatiON analysis suite

Giorgos Skoufos et al. Genome Biol. .

Abstract

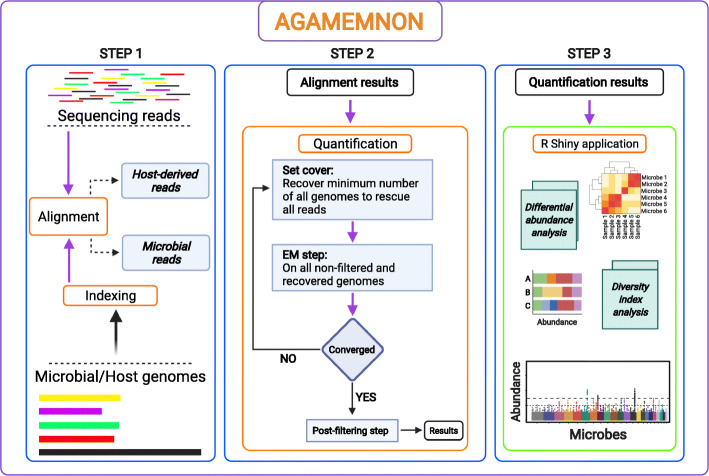
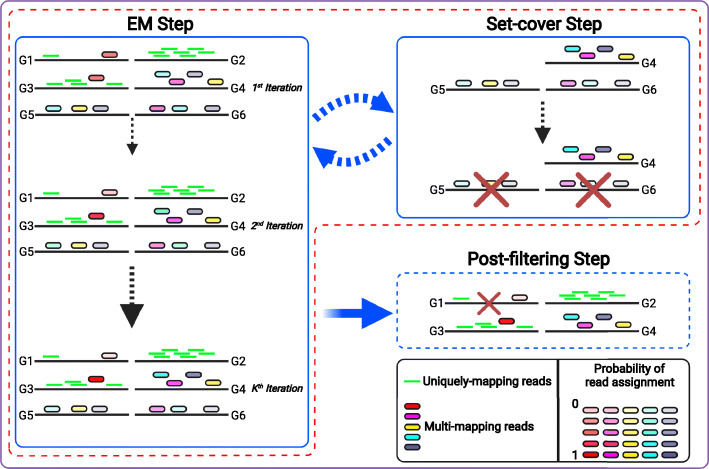
We introduce AGAMEMNON ( https://github.com/ivlachos/agamemnon ) for the acquisition of microbial abundances from shotgun metagenomics and metatranscriptomic samples, single-microbe sequencing experiments, or sequenced host samples. AGAMEMNON delivers accurate abundances at genus, species, and strain resolution. It incorporates a time and space-efficient indexing scheme for fast pattern matching, enabling indexing and analysis of vast datasets with widely available computational resources. Host-specific modules provide exceptional accuracy for microbial abundance quantification from tissue RNA/DNA sequencing, enabling the expansion of experiments lacking metagenomic/metatranscriptomic analyses. AGAMEMNON provides an R-Shiny application, permitting performance of investigations and visualizations from a graphics interface.

Keywords: Computational metagenomics; Identification of contaminants; Microbiome; Quantification of microbial abundances; Time- and space-efficient indexing/alignment.


Conflict of interest statement

RP is a cofounder of Ocean Genomics Inc. The remaining authors declare that they have no competing interests.

Figures

Fig. 1
Fig. 1
Schematic representation of AGAMEMNON. Dataset input is in raw FASTQ format. Paired-end (PE) or Single-end (SE) libraries are supported. For single-cell libraries, AGAMEMNON has helper scripts to enable per-cell analyses. In case of host tissue samples or contaminant quantification activities, the reads are first aligned against the host genome and the contaminant reference index using HISAT2. The host alignment file is saved for downstream applications and the resulting unmapped reads are forwarded to the main metagenomics/metatranscriptomics pipeline. Selective alignment is performed on the microbial reads against the reference index, while microbial abundances are subsequently quantified. A raw quantification table is produced as well as a taxonomic rank table. The results of the analysis can be used as input to AGAMEMNON’s R-Shiny application, which enables diverse analyses and investigations from a graphic user interface, including visualizations, dimensionality reduction, differential abundance, and diversity index analyses
Fig. 2
Fig. 2
Schematic representation of AGAMEMNON’s quantification engine. Each black line indicates a microbial genome. In this example, most reads are unambiguously aligned to a single genome (shown as short green lines), while 6 reads map to multiple genomes (rounded red, turquoise, purple, orange, gray, and yellow boxes). Each EM step consists of K iterations (default k = 10). In the first EM step and first iteration, multi-mapping reads are equally partially assigned to all the genomes that they align against. For example, the turquoise read that maps to three genomes, G2, G3 and G4, is assigned a base coverage/probability of 0.33 in each (shown by the same opacity of color in EM Step, first iteration). During EM, read assignments are resolved through iterations of reassigning the reads based on the abundance of the genomes/strains observed in the previous iteration. In each iteration, the quantification of each strain, as estimated based on the current read assignment, is used as the prior for multi-mapping read assignment in the subsequent iteration. Following each EM step (i.e., K iterations), the set-cover step is also adopted, in order to resolve special multi-mapping cases that are unsolvable by the EM, called “multi-mapping islands.” These are groups of highly similar strains with low abundance for which all reads are multi-mapped making it infeasible for EM to prioritize one strain over another, leading to reporting the whole group of strains with small abundances, while only few of them exist in the sample of interest, introducing false positives. The EM step - set-cover step is a looping process until set-cover is unable to remove any further genomes in which case, EM process iterates until termination. In the last step of the procedure, all the genomes with abundance values lower than a predefined cutoff are removed. In the figure’s example, the process starts with six genomes (G1–G6). Throughout the iterations of the first EM step, the read probabilities change but all six genomes remain in the quantification process. When the first EM step is over, the model continues with the first set-cover step. In the set-cover step, only the genomes in which all reads are multi-mapped will be taken into consideration (i.e., G4, G5, G6). Through the set-cover process, we will keep only genome G4 and remove genomes G5 and G6 aiming for minimum number of strains that explain all multi-mapping reads. In the second EM step (not shown in the figure), only genomes G1–G4 will participate in the process. Subsequently, in this particular example, the set-cover step will never be called again because there are no multi-mapping islands left in the reference. Thus, the EM process will iterate until termination. Finally, after the whole EM process is done, the heuristic removal step will further remove the genomes whose abundance is equal to or less than 2 reads, and thus, in this example, genome G1 will also be removed before reporting the final quantification results
Fig. 3
Fig. 3
A–F The mean squared log error (MSLE) and the number of false positive taxa (FP) between true and estimated read counts at the levels of genus, species, and strain using the Illumina 400 dataset and REF-1. We measured MSLE (a) using unfiltered results (0 x axis tick) and (b) by removing all instances where the true and estimated counts were both zero (1 x axis tick). False positive taxa were counted at all read thresholds between 0 and 10. At the read threshold of 0 reads (unfiltered results), all taxa were counted, even those with just 1 assigned read. At the read threshold of 1 read, we counted the taxa with > 1 assigned read and so on. Bracken and MetaPhlAn 3 produce results up to the species level and thus they were not included in the strain-level comparisons. Smaller MSLE and smaller numbers of false positives denote better performance
Fig. 4
Fig. 4
The mean squared log error (MSLE) and the number of false positive taxa (FP) between true and estimated read counts at the levels of genus, species, and strain using reference 3. We measured MSLE (a) using unfiltered results (0 x axis tick) and (b) by removing all instances where the true and estimated counts were both zero (1 x axis tick). False positive taxa were counted at all read thresholds between 0 and 10. At the read threshold of 0 reads (unfiltered results), all taxa were counted, even those with just 1 assigned read. At the read threshold of 1 read, we counted the taxa with > 1 assigned read and so on. Bracken, MetaPhlAn 3, and Kaiju produce results up to the species level and thus they were not included in the strain-level comparisons. Smaller MSLE and smaller numbers of false positives denote better performance
Fig. 5
Fig. 5
A–F The pairwise Spearman correlation of each method in three human fecal samples at the levels of genus and species. Before calculating Spearman correlation values, we removed all instances of zero-abundant taxa from all methods
Fig. 6
Fig. 6
The mean squared log error (MSLE) and the number of false positive taxa (FP) between true and estimated read counts at the levels of genus, species, and strain using mixed datasets one and two and the human-subset reference. We measured MSLE and False positive taxa at read thresholds between 0 and 300 with a step of 5 reads. At the read threshold of 0 reads (unfiltered results), all taxa were counted, even those with just 1 assigned read. At the read threshold of 5 reads, we counted the taxa with > 5 assigned reads and the taxa that had < 5 reads assigned were not taken into consideration and so on. Smaller MSLE and smaller numbers of false positives denote better performance
Fig. 7
Fig. 7
Screenshots of AGAMEMNON’s Shiny application. (Top row) Visualization of microbial abundances through the use of Manhattan plots and Boxplots. (Middle row) Heatmap visualization and clustering using top N (in terms of abundance) microbes and PCA/MDS analysis. (Bottom row) Diversity index analysis and interactive tables showing the full lineage of microbes identified in the analyzed samples and differential expression analysis module and results
Fig. 8
Fig. 8
Accuracy of AGAMEMNON against a single-cell microbial community in terms of relative abundance. As stated in the Sic-Seq article, the Read Counting values emerged after counting cells under bright-field microscopy, and thus, we consider read counting as the ground truth. Microbial abundance quantification using AGAMEMNON remains highly accurate even in single-cell samples

References

    1. Loman NJ, Pallen MJ. Twenty years of bacterial genome sequencing. Nat Rev Microbiol. 2015;13(12):787–794. doi: 10.1038/nrmicro3565. - DOI - PubMed
    1. The NIHHMPWG. Peterson J, Garges S, Giovanni M, McInnes P, Wang L, Schloss JA, Bonazzi V, McEwen JE, Wetterstrand KA, et al. The NIH Human Microbiome Project. Genome Res. 2009;19(12):2317–2323. doi: 10.1101/gr.096651.109. - DOI - PMC - PubMed
    1. Sampson TR, Debelius JW, Thron T, Janssen S, Shastri GG, Ilhan ZE, et al. Gut microbiota regulate motor deficits and neuroinflammation in a model of Parkinson’s disease. Cell. 167(e1412):1469–80. - PMC - PubMed
    1. Dunlop AL, Mulle JG, Ferranti EP, Edwards S, Dunn AB, Corwin EJ. The maternal microbiome and pregnancy outcomes that impact infant health: a review. Adv Neonatal Care Off J Natl Assoc Neonatal Nurses. 2015;15(6):377–385. doi: 10.1097/ANC.0000000000000218. - DOI - PMC - PubMed
    1. Skoufos G, Kardaras FS, Alexiou A, Kavakiotis I, Lambropoulou A, Kotsira V, Tastsoglou S, Hatzigeorgiou Artemis G. Peryton: a manual collection of experimentally supported microbe-disease associations. Nucleic Acids Res. 2020;49(D1):D1328–D1333. doi: 10.1093/nar/gkaa902. - DOI - PMC - PubMed

Publication types

LinkOut - more resources