

Charting brain growth and aging at high spatial precision
- PMID: 35101172
- PMCID: PMC8828052
- DOI: 10.7554/eLife.72904
Charting brain growth and aging at high spatial precision
Abstract
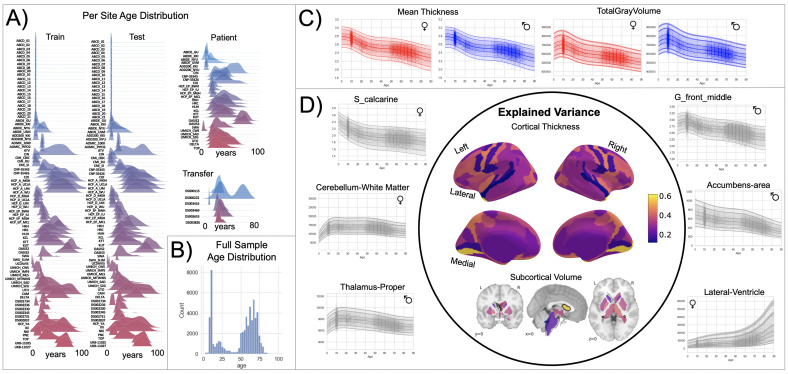
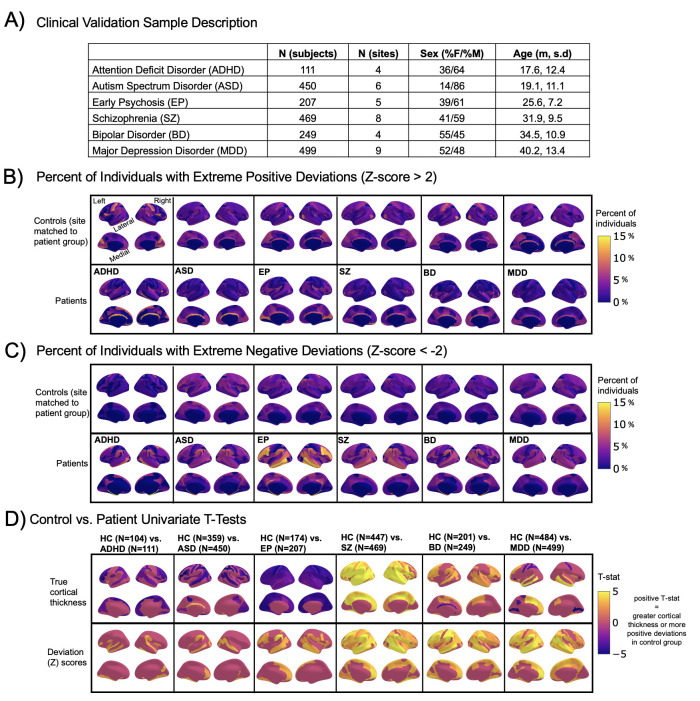
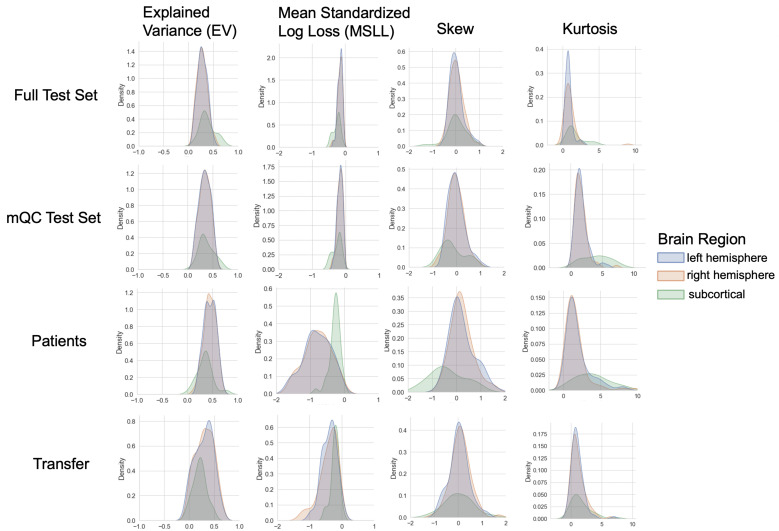
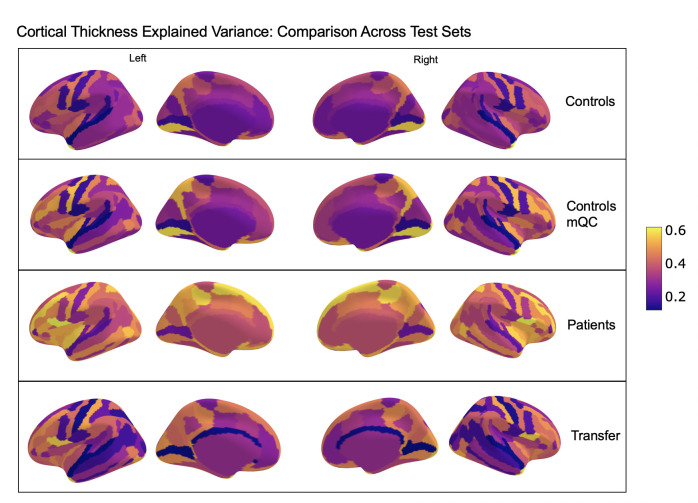
Defining reference models for population variation, and the ability to study individual deviations is essential for understanding inter-individual variability and its relation to the onset and progression of medical conditions. In this work, we assembled a reference cohort of neuroimaging data from 82 sites (N=58,836; ages 2-100) and used normative modeling to characterize lifespan trajectories of cortical thickness and subcortical volume. Models are validated against a manually quality checked subset (N=24,354) and we provide an interface for transferring to new data sources. We showcase the clinical value by applying the models to a transdiagnostic psychiatric sample (N=1985), showing they can be used to quantify variability underlying multiple disorders whilst also refining case-control inferences. These models will be augmented with additional samples and imaging modalities as they become available. This provides a common reference platform to bind results from different studies and ultimately paves the way for personalized clinical decision-making.
Keywords: big data; brain chart; growth chart; human; individual prediction; lifespan; neuroscience; normative model.
© 2022, Rutherford et al.
Conflict of interest statement
SR, CF, RD, SK, TW, MZ, PB, AW, SV, DA, LH, JB, PD, PM, RM, AS, CS, IT, ED, SC, BP, MH, SB, LH, DA, CW, LW, RZ, AM No competing interests declared, OA is a consultant for HealthLytix and received speaker's honorarium from Lundbeck and Sunovion, HR received speaker's honorarium from Lundbeck and Janssen, CB is director and shareholder of SBGNeuro Ltd
Figures
References
-
- Alfaro-Almagro F, Jenkinson M, Bangerter NK, Andersson JLR, Griffanti L, Douaud G, Sotiropoulos SN, Jbabdi S, Hernandez-Fernandez M, Vallee E, Vidaurre D, Webster M, McCarthy P, Rorden C, Daducci A, Alexander DC, Zhang H, Dragonu I, Matthews PM, Miller KL, Smith SM. Image processing and Quality Control for the first 10,000 brain imaging datasets from UK Biobank. NeuroImage. 2018;166:400–424. doi: 10.1016/j.neuroimage.2017.10.034. - DOI - PMC - PubMed
-
- Bethlehem R, Seidlitz J, White SR, Vogel JW, Anderson KM, Adamson C, Adler S, Alexopoulos GS, Anagnostou E, Areces-Gonzalez A, Astle DE, Auyeung B, Ayub M, Ball G, Baron-Cohen S, Beare R, Bedford SA, Benegal V, Beyer F, Alexander-Bloch AF. Brain Charts for the Human Lifespan. bioRxiv. 2021 doi: 10.1101/2021.06.08.447489. - DOI - PMC - PubMed
Publication types
MeSH terms
Grants and funding
- U01 DA041120/DA/NIDA NIH HHS/United States
- 101001118/ERC_/European Research Council/International
- 215698/Z/19/Z/WT_/Wellcome Trust/United Kingdom
- C0439/MRF_/MRF_/United Kingdom
- U24 DA041123/DA/NIDA NIH HHS/United States
- 098369/Z/12/Z/WT_/Wellcome Trust/United Kingdom
- U01 DA041156/DA/NIDA NIH HHS/United States
- UG3 MH114249/MH/NIMH NIH HHS/United States
- R01 DC011277/DC/NIDCD NIH HHS/United States
- U01 DA041106/DA/NIDA NIH HHS/United States
- U01 DA041117/DA/NIDA NIH HHS/United States
- R01 MH103371/MH/NIMH NIH HHS/United States
- MR/S003444/1/MRC_/Medical Research Council/United Kingdom
- MR/T017538/1/MRC_/Medical Research Council/United Kingdom
- U01 DA041174/DA/NIDA NIH HHS/United States
- R01 MH122491/MH/NIMH NIH HHS/United States
- U24 DA041147/DA/NIDA NIH HHS/United States
- K23 MH108823/MH/NIMH NIH HHS/United States
- R01 MH107741/MH/NIMH NIH HHS/United States
- P50 HD093079/HD/NICHD NIH HHS/United States
- U01 DA041134/DA/NIDA NIH HHS/United States
- U01 DA041022/DA/NIDA NIH HHS/United States
- R01 MH104438/MH/NIMH NIH HHS/United States
- G0902304/MRC_/Medical Research Council/United Kingdom
- U01 DA041089/DA/NIDA NIH HHS/United States
- 215698/WT_/Wellcome Trust/United Kingdom
- U01 DA041028/DA/NIDA NIH HHS/United States
- U01 DA041048/DA/NIDA NIH HHS/United States
- UL1 TR002240/TR/NCATS NIH HHS/United States
- R01 HD093334/HD/NICHD NIH HHS/United States
- U01 DA041148/DA/NIDA NIH HHS/United States
- 91716415/ZONMW_/ZonMw/Netherlands
