. 2022 Mar;63(3):100174.
doi: 10.1016/j.jlr.2022.100174. Epub 2022 Jan 29.

Comparison between genetic and pharmaceutical disruption of Ldlr expression for the development of atherosclerosis

Affiliations

Comparison between genetic and pharmaceutical disruption of Ldlr expression for the development of atherosclerosis

Diego Gomes et al. J Lipid Res. 2022 Mar.

Abstract

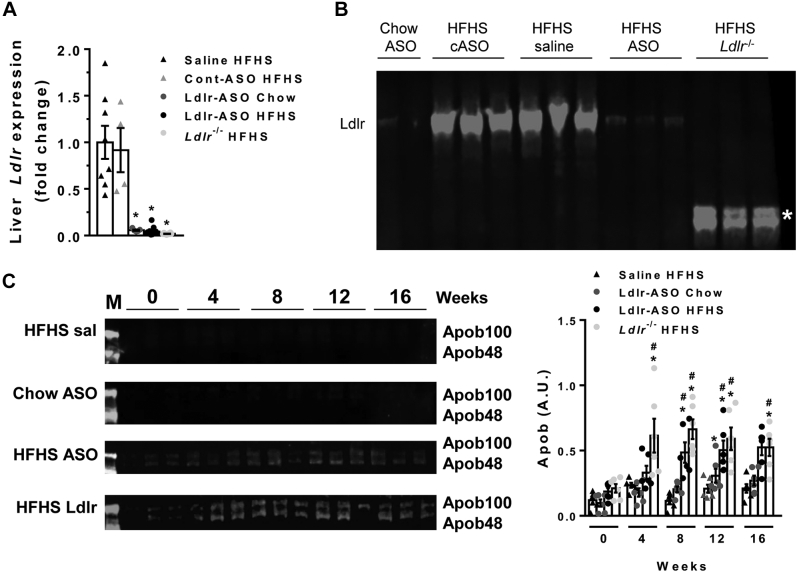
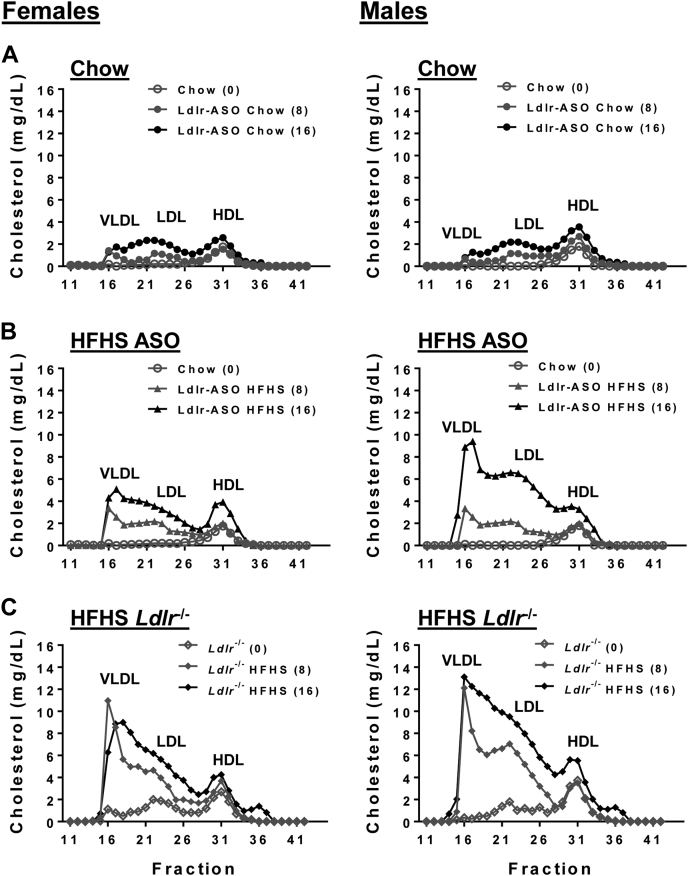
Antisense oligonucleotides (ASOs) against Ldl receptor (Ldlr-ASO) represent a promising strategy to promote hypercholesterolemic atherosclerosis in animal models without the need for complex breeding strategies. Here, we sought to characterize and contrast atherosclerosis in mice given Ldlr-ASO with those bearing genetic Ldlr deficiency. To promote atherosclerosis, male and female C57Bl6/J mice were either given weekly injections of Ldlr-ASO (5 mg/kg once per week) or genetically deficient in Ldlr (Ldlr-/-). Mice consumed either standard rodent chow or a diet high in saturated fat and sucrose with 0.15% added cholesterol for 16 weeks. While both models of Ldlr deficiency promoted hypercholesterolemia, Ldlr-/- mice exhibited nearly 2-fold higher cholesterol levels than Ldlr-ASO mice, reflected by increased VLDL and LDL levels. Consistent with this, the en face atherosclerotic lesion area was 3-fold and 3.6-fold greater in male and female mice with genetic Ldlr deficiency, respectively, as compared with the modest atherosclerosis observed following Ldlr-ASO treatment. Aortic sinus lesion sizes, fibrosis, smooth muscle actin, and necrotic core areas were also larger in Ldlr-/- mice, suggesting a more advanced phenotype. Despite a more modest effect on hypercholesterolemia, Ldlr-ASO induced greater hepatic inflammatory gene expression, macrophage accumulation, and histological lobular inflammation than was observed in Ldlr-/- mice. We conclude Ldlr-ASO is a promising tool for the generation of complex rodent models with which to study atherosclerosis but does not promote comparable levels of hypercholesterolemia or atherosclerosis as Ldlr-/- mice and increases hepatic inflammation. Thus, genetic Ldlr deficiency may be a superior model, depending on the proposed use.

Keywords: animal models; antisense oligonucleotides; fast-phase liquid chromatography; hepatic inflammation; hyperlipidemia; inflammation; liver; receptors/lipoprotein; serum amyloid A.


Conflict of interest statement

Conflict of interest The authors declare that they have no conflicts of interest with the contents of this article.

Figures

Fig. 1
Fig. 1
Mouse study design. Two models were utilized to promote atherosclerosis in C57Bl/6J mice. In the pharmacological strategy, male and female mice (10 weeks of age) were fed either a normal chow diet or placed on an HFHS diet for 16 weeks. Mice were given weekly intraperitoneal injections of either saline, control-ASO, or Ldlr-ASO. In the genetic strategy, male and female Ldlr−/− mice were fed an HFHS diet for 16 weeks.
Fig. 2
Fig. 2
Mouse model validation. A, B: Liver Ldlr gene (A, n = 4–16 mice/group) and protein (B, n = 2–3 mice/group) expression levels in the indicated male mice after 16 weeks of chow or HFHS feeding. In (B), the mice genetically deficient in Ldlr show an Ldlr truncation fragment that is not functional (asterisk). C: Apob48 and Apob100 levels in plasma from male mice given once weekly Ldlr-ASO or saline injections for the indicated times (n = 3 mice/group in duplicate) (M = marker). Densitometry for total Apob, normalized to albumin. ∗P < 0.05 from saline; #P < 0.0 from time 0; and $P < 0.05 from HFHS ASO.
Fig. 3
Fig. 3
Plasma cholesterol triglyceride and Saa. Plasma was collected from C57Bl6/J male and female mice fed a chow or HFHS diet for 0, 4, 8, 12, and 16 weeks (n = 5–15 mice/group). Mice received weekly saline, control-ASO, or Ldlr-ASO injections or were crossed onto an Ldlr−/− background. A: Plasma cholesterol levels. B: Plasma triglyceride (TG) levels. C: Plasma Saa levels. ∗P < 0.05 from baseline (time 0), #P < 0.05 from saline HFHS, and $P < 0.05 from LDLR-ASO.
Fig. 4
Fig. 4
FPLC plasma cholesterol pools over time. Plasma was collected from C57Bl6/J male and female mice fed a chow or HFHS diet for 0, 8, or 16 weeks. Mice received weekly Ldlr-ASO injections or were crossed onto an Ldlr−/− background. Plasma from mice was pooled for each treatment group, fractionated using FPLC, and total cholesterol quantified from each fraction. Chow ASO groups (A): n = 5 pooled; HFHS ASO groups (B): n = 9 pooled; and HFHS Ldlr−/− groups (C): n = 13.
Fig. 5
Fig. 5
Liver inflammatory gene expression, triglyceride, and cholesterol. Livers were removed from male and female mice that had been injected once weekly with either saline, Ldlr-ASO, or nothing, with or without Ldlr deficiency. A: Expression of inflammatory genes Il6, Lgals3, Cd68, Saa1, Saa2, and Saa3 was assessed. B: Representative immunoblot for Mac2 protein, quantified and normalized to β-actin levels (representative of n = 5–6 mice) (M = marker; top band = 55 kD; and bottom band = 35 kD). C, D: Liver histology from Mac2-stained (C) and H&E-stained sections (D), with Mac2 quantification and assessment of lobular inflammation. The scale bar represents 100 μm. E: Hepatic triglycerides and cholesterol were extracted and quantified. F: Plasma Il6 was measured by ELISA. Data are presented as mean ± SEM, n = 5–15 mice/group. ∗P < 0.05 from saline; #P < 0.05 from Ldlr-ASO.
Fig. 6
Fig. 6
Quantification of atherosclerosis. Aortas and hearts were collected after 16 weeks of the indicated diets and treatments. A, B: Representative images of aortas prepared en face and stained with Sudan IV for females (A) and males (B). The scale bar represents 500 μm. Atherosclerotic area was calculated using ImageJ software and presented as a percentage of the total aortic area. C–F: Representative images of aortic sinuses stained with a Mac-2 antibody from females (C) and males (D) (the scale bar represents 100 μm), Movat’s pentachrome stain for visualization of histology (males, E), and smooth muscle α-actin (males, F) (the scale bar represents 100 μm). Lesion scoring (0–5) was performed as described in the Materials and methods section. Atherosclerotic area, Mac2 staining, necrotic core size, and smooth muscle actin staining were calculated using Image Pro Plus and ImageJ software and presented as a percentage of total lesion size, mean ± SEM. ∗P < 0.05 from saline HFHS.

References

    1. Ishibashi S., Brown M.S., Goldstein J.L., Gerard R.D., Hammer R.E., Herz J. Hypercholesterolemia in low density lipoprotein receptor knockout mice and its reversal by adenovirus-mediated gene delivery. J. Clin. Invest. 1993;92:883–893. - PMC - PubMed
    1. Zhang S.H., Reddick R.L., Piedrahita J.A., Maeda N. Spontaneous hypercholesterolemia and arterial lesions in mice lacking apolipoprotein E. Science. 1992;258:468–471. - PubMed
    1. Bennett C.F., Swayze E.E. RNA targeting therapeutics: molecular mechanisms of antisense oligonucleotides as a therapeutic platform. Annu. Rev. Pharmacol. Toxicol. 2010;50:259–293. - PubMed
    1. Tromp T.R., Stroes E.S.G., Hovingh G.K. Gene-based therapy in lipid management: the winding road from promise to practice. Expert Opin. Investig. Drugs. 2020;29:483–493. - PubMed
    1. Kastelein J.J., Wedel M.K., Baker B.F., Su J., Bradley J.D., Yu R.Z., Chuang E., Graham M.J., Crooke R.M. Potent reduction of apolipoprotein B and low-density lipoprotein cholesterol by short-term administration of an antisense inhibitor of apolipoprotein B. Circulation. 2006;114:1729–1735. - PubMed

Publication types