. 2022 Feb 1;119(5):e2115708119.
doi: 10.1073/pnas.2115708119.

Atomic force microscopy reveals distinct protofilament-scale structural dynamics in depolymerizing microtubule arrays

Affiliations

Atomic force microscopy reveals distinct protofilament-scale structural dynamics in depolymerizing microtubule arrays

Sithara S Wijeratne et al. Proc Natl Acad Sci U S A. .

Abstract

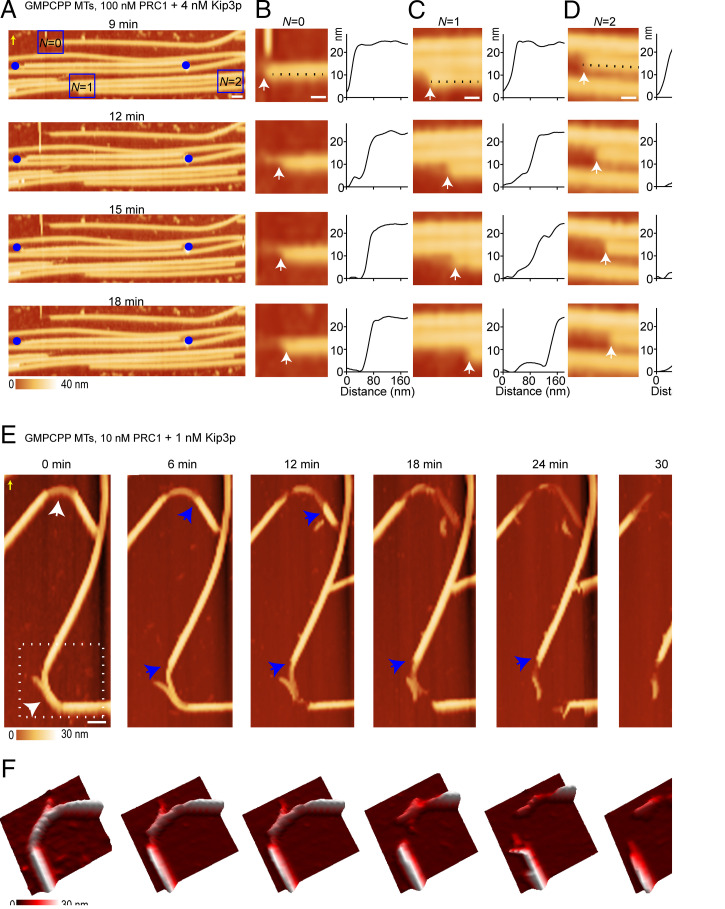
The dynamic reorganization of microtubule-based cellular structures, such as the spindle and the axoneme, fundamentally depends on the dynamics of individual polymers within multimicrotubule arrays. A major class of enzymes implicated in both the complete demolition and fine size control of microtubule-based arrays are depolymerizing kinesins. How different depolymerases differently remodel microtubule arrays is poorly understood. A major technical challenge in addressing this question is that existing optical or electron-microscopy methods lack the spatial-temporal resolution to observe the dynamics of individual microtubules within larger arrays. Here, we use atomic force microscopy (AFM) to image depolymerizing arrays at single-microtubule and protofilament resolution. We discover previously unseen modes of microtubule array destabilization by conserved depolymerases. We find that the kinesin-13 MCAK mediates asynchronous protofilament depolymerization and lattice-defect propagation, whereas the kinesin-8 Kip3p promotes synchronous protofilament depolymerization. Unexpectedly, MCAK can depolymerize the highly stable axonemal doublets, but Kip3p cannot. We propose that distinct protofilament-level activities underlie the functional dichotomy of depolymerases, resulting in either large-scale destabilization or length regulation of microtubule arrays. Our work establishes AFM as a powerful strategy to visualize microtubule dynamics within arrays and reveals how nanometer-scale substrate specificity leads to differential remodeling of micron-scale cytoskeletal structures.

Keywords: atomic force microscopy; axoneme; cytoskeleton; kinesin; microtubule arrays.


Conflict of interest statement

The authors declare no competing interest.

Figures

Fig. 1.
Fig. 1.
MCAK depolymerizes microtubule protofilaments asynchronously. (A) Schematic of an antiparallel microtubule array cross-linked by PRC1 (dotted lines). (B) AFM image of a microtubule bundle cross-linked by 100 nM PRC1. Each microtubule within the flat 2D array can be clearly distinguished. (x-y scale bar, 70 nm.) The z-scale is 0 to 40 nm (dark to light brown). The AFM image is colored according to height from the surface. (C) The 3D rendition of a zoomed-in region from B. (D) The corresponding height profile from dotted line in B. (E) Successive AFM images show depolymerization of individual microtubules within a PRC1-cross-linked bundle by MCAK. The image at 0 min represents the first frame taken after adding MCAK (GMPCPP + taxol microtubules; PRC1: 100 nM; MCAK: 70 nM). (x-y scale bar, 100 nm.) The z-scale is 0 to 40 nm (dark to light brown). (F–K) Two examples of depolymerization from the experiment in E showing stripe-like appearance of depolymerizing protofilaments (boxes 1 and 2). (F and I) The height and (G and J) the corresponding 3D rendition of the AFM time-lapse images. (H and K) Corresponding height profiles from the black dotted line in F and I show that the stripiness in the images corresponds to protofilaments at different heights relative to the surface. (L) Schematic of a microtubule undergoing asynchronous protofilament depolymerization. The scanning rate is 4 min/frame in B and ∼3 min/frame in E with 256 × 256 pixels. The arrow in B and E indicates the scanning direction in the fast axis (SI Appendix, Figs. S1–S3).
Fig. 2.
Fig. 2.
MCAK propagates defects within cross-linked bundles. (A) Successive AFM images showing depolymerization of individual microtubules within a microtubule bundle by MCAK at the indicated times. The image at 0 min represents the first frame taken after adding MCAK (GMPCPP + taxol microtubules; PRC1: 100 nM; MCAK: 70 nM). (x-y scale bar, 50 nm.) (B) Successive time-lapse montages of a zoomed-in region of a section of microtubule from the experiment in A (box 1) showing defect propagation on three microtubules within the array at the indicated times (arrows). “S” indicates the edge with slow depolymerization, and “F” indicates the edge with fast depolymerization. (x-y scale bar, 30 nm.) (C) The corresponding average height profiles along the length of the microtubule from the dotted line in B. (D). Box plots of the depolymerization rates of “slow (S)” and “fast (F)” events from defect propagation along microtubule length (median: PRC1: 100 nM; MCAK: 70 nM; GMPCPP + taxol microtubules: slow = 1 nm/min, n = 19; fast = 2 nm/min, n = 17; GMPCPP microtubules: slow = 3 nm/min, n = 18; fast = 6 nm/min, n = 18). (E) Box plots of the depolymerization rates from defect propagation events, in “diameter (D)” and “length (L)” directions (median: PRC1: 100 nM; MCAK: 70 nM; GMPCPP + taxol microtubules: diameter = 0.6 nm/min, n = 20; length = 3 nm/min, n = 20; GMPCPP microtubules: diameter = 2 nm/min, n = 22; length = 10 nm/min, n = 22). The scanning rate is ∼3 min/frame with 256 × 256 pixels. The arrow in A indicates the scanning direction in the fast axis. For D and E, the box plots show the median, the inner quartiles, and maximum and minimum values. Statistical calculations used an unpaired t test with Kolmogorov–Smirnov correction for non-Gaussian distribution. * indicates a P value of <0.05. **** indicates a P value of <0.0001 (SI Appendix, Fig. S2).
Fig. 3.
Fig. 3.
Structural dynamics of microtubule depolymerization by Kip3p are distinct from those of MCAK. (A) Successive AFM time-lapse images of a PRC1-cross-linked microtubule bundle in the presence of Kip3p at the indicated times (GMPCPP microtubules, PRC1: 100 nM; Kip3p: 4 nM). The blue circles are fiduciary marks, which show that the microtubules are depolymerizing and not gliding on the surface. (x-y scale bar, 100 nm.) (BD) Zoomed-in regions from the experiment in A (boxes), showing bluntness at the depolymerizing microtubule end with number of neighbors N = 0 (B), N = 1 (C), and N = 2 (D). The height profiles corresponding to the dotted lines show that protofilaments at the ends of the microtubules are lost synchronously (white arrows). (x-y scale bar, 40 nm.) For AD, the z-scale is 0 to 40 nm (dark to light brown). (E) Successive AFM time-lapse images show the destabilization of two highly curved regions (white arrows at 0 min) at the indicated times. Over time, the microtubule starts to depolymerize faster from one end with synchronous loss of protofilaments (blue arrows) (GMPCPP microtubules, PRC1: 10 nM; Kip3p: 1 nM). (x-y scale bar, 100 nm.) The z-scale is 0 to 30 nm (dark to light brown). (F) The 3D rendition shows a magnified view of this depolymerization activity (dotted box at 0 min in E). The scanning rate is ∼3 min/frame with 256 × 256 pixels. The yellow arrows in A and E indicate the scanning direction in the fast axis (SI Appendix, Figs. S4–S6).
Fig. 4.
Fig. 4.
Visualizing the activity of MCAK and Kip3p on doublet-microtubules using AFM. (A) Schematic of the axoneme structure. Axonemes consists of nine outer microtubule doublets (MTD). Each doublet contains an A tubule and a B tubule. Outer dynein arms (ODA), present on the A tubule, form a repeating pattern. (B) AFM height image of an MTD. The A and the B tubules in a MTD were distinguished by the height of the tubules in the joined doublet (25 and 35 nm) and by the periodic striations, which are separated by 30 nm (arrows). (x-y scale bar, 50 nm.) (C) The 3D representation of B and the corresponding height profile of the dotted line in B. (D) Successive AFM images show a 2D MTD sheet with MCAK at the indicated times. The zoomed-in region (boxed region) shows the depolymerization activity of alternate tubules in an array (blue arrows) and corresponding height profiles over time (dotted line). The height profiles show the deepening of the minima and changing of the asymmetric peak into a single sharp peak (dotted line, arrow) (-TED sample, MCAK: 7 nM). (x-y scale bars of the zoomed-out and zoomed-in images, 80 nm and 40 nm, respectively.) The z-scale is 0 to 40 nm (dark to light brown). (E) Successive AFM height and amplitude images show a microtubule doublet (D) and a singlet (S) in the presence Kip3p at the indicated times. The corresponding height profiles from dotted line show that the height of the doublet doesn’t change over time, but the height of the singlet reduces with time (dotted lines) (-TED sample, Kip3p: 5 nM). (x-y scale bar, 100 nm.) The z-scale is 0 to 50 nm (dark to light brown). (F) Box plots of the depolymerization rates of A and B tubules in the -TED sample with MCAK and Kip3p. MCAK: A rate = 2 nm/min, n = 12; B rate = 23 nm/min, n = 10; Kip3p: A rate = 0.2 nm/min, n = 22; B rate = 3 nm/min, n = 22. Data were pooled from experiments with protein concentrations less than 10 nM. Statistical calculations used an unpaired t test with Kolmogorov–Smirnov correction for non-Gaussian distribution. * indicates a P value of <0.05. The scanning rate is ∼4 min/frame in B and ∼3 min/frame in DE with 256 × 256 pixels. The yellow arrows in B, D, and E indicate the scanning direction in the fast axis. For F, the box plot shows the median, the inner quartiles, and maximum and minimum values (SI Appendix, Figs. S7 and S8).
Fig. 5.
Fig. 5.
Destabilization of axonemal structures by depolymerases. (AC) AFM height (A), amplitude (B), and 3D (C) images of an intact axoneme from L. pictus sea urchin sperm. The AFM amplitude (B) and the 3D (C) images show longitudinal striations, likely from the nine outer doublets, which are ∼20 to 30 nm apart. (x-y scale bar, 300 nm.) The z-scale is 0 to 200 nm (dark to light brown). (D) The height profile of the selected dotted line from height image in A shows a maximum height of ∼200 nm. (E) Successive AFM images of an axoneme with 1 mM ATP at the indicated times. With ATP alone, no significant change was observed in the axoneme structure. (x-y scale bar, 300 nm.) The z-scale is 0 to 300 nm (dark to light brown). (F) Successive AFM images of an axoneme in the presence of MCAK (1 nM) at the indicated times. At t = 0, the axoneme has been partially frayed. (x-y scale bar, 500 nm.) The z-scale is 0 to 60 nm (dark to light brown). (G) Schematic of proposed intermediate that results in unfurling of the axoneme with MCAK. The scanning rate is ∼4 min/frame in A–C and ∼3 min/frame in EF with 256 × 256 pixels. The yellow arrows in A, E, and F indicate the scanning direction in the fast axis (SI Appendix, Fig. S9).
Fig. 6.
Fig. 6.
Summary. The schematic illustrates the distinct structural dynamics and intermediates during microtubule depolymerization with different enzymes and its impact on microtubule arrays. In the context of an individual microtubule, 1) the loss of protofilaments is asynchronous with MCAK and synchronous with Kip3p, and 2) MCAK propagates lattice defects, whereas Kip3p does not. In the context of microtubule arrays, 1) cross-linking by PRC1 protects microtubules against depolymerization by MCAK and does not significantly influence the depolymerization by Kip3p, and 2) MCAK depolymerizes doublet microtubules and results in the destabilization of axonemal arrays. This arises from fast depolymerization of one tubule, which compromises the stability of the cylindrical doublet array.

References

    1. Gudimchuk N. B., McIntosh J. R., Regulation of microtubule dynamics, mechanics and function through the growing tip. Nat. Rev. Mol. Cell Biol. 22, 777–795 (2021). - PubMed
    1. Kodera N., Yamamoto D., Ishikawa R., Ando T., Video imaging of walking myosin V by high-speed atomic force microscopy. Nature 468, 72–76 (2010). - PubMed
    1. Ando T., et al. , A high-speed atomic force microscope for studying biological macromolecules. Proc. Natl. Acad. Sci. U.S.A. 98, 12468–12472 (2001). - PMC - PubMed
    1. Schaap I. A., Carrasco C., de Pablo P. J., Schmidt C. F., Kinesin walks the line: Single motors observed by atomic force microscopy. Biophys. J. 100, 2450–2456 (2011). - PMC - PubMed
    1. Vinckier A., et al. , Immobilizing and imaging microtubules by atomic force microscopy. Ultramicroscopy 57, 337–343 (1995). - PubMed

Publication types

MeSH terms