. 2022 Jan;10(1):e003087.
doi: 10.1136/jitc-2021-003087.

Tumor mutation burden for predicting immune checkpoint blockade response: the more, the better

Affiliations

Tumor mutation burden for predicting immune checkpoint blockade response: the more, the better

Ming Zheng. J Immunother Cancer. 2022 Jan.

Abstract

Background: Recently, the US Food and Drug Administration (FDA) has approved immune checkpoint blockade (ICB) for treating cancer patients with tumor mutation burden (TMB) >10 mutations/megabase (mut/Mb). However, high TMB (TMB-H) defined by >10 mut/Mb fails to predict ICB response across different cancer types, which has raised serious concerns on the current FDA approval. Thus, to better implement TMB as a robust biomarker of ICB response, an optimal and generalizable TMB cut-off within and across cancer types must be addressed as soon as possible.

Methods: Using Morris's and Kurzrock's cohorts (n=1662 and 102), we exhaustively tested all possible TMB cut-offs for predicting ICB treatment outcomes in 10 cancer types. The bootstrap method was applied to generate 10,000 randomly resampled cohorts using original cohorts to measure the reproducibility of TMB cut-off. ICB treatment outcomes were analyzed by overall survival, progression-free survival and objective response rate.

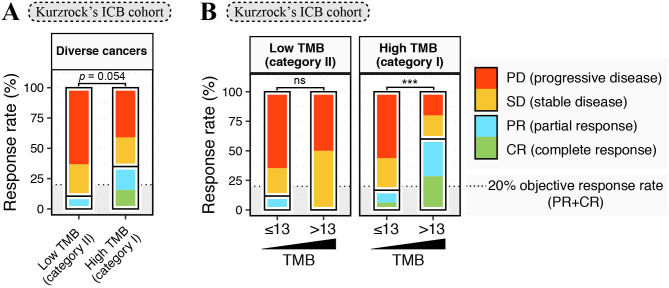
Results: No universally valid TMB cut-off was available for all cancer types. Only in cancer types with higher TMB (category I), such as melanoma, colorectal cancer, bladder cancer, and non-small cell lung cancer, the associations between TMB-H and ICB treatment outcomes were less affected by TMB cut-off selection. Moreover, high TMB (category I) cancer types shared a wide range of TMB cut-offs and a universally optimal TMB cut-off of 13 mut/Mb for predicting favorable ICB outcomes. In contrast, low TMB (category II) cancer types, for which the prognostic associations were sensitive to TMB cut-off selection, showed markedly limited and distinct ranges of significantly favorable TMB cut-offs. Equivalent results were obtained in the analyses of pooled tumors.

Conclusions: Our finding-the correlation that TMB-H is more robustly associated with favorable ICB treatment outcomes in cancer types with higher TMBs-can be used to predict whether TMB could be a robust predictive biomarker in cancer types for which TMB data are available, but ICB treatment has not been investigated. This theory was tested in cancer of unknown primary successfully. Additionally, the universal TMB cut-off of 13 mut/Mb might reveal a general requirement to trigger the sequential cascade from somatic mutations to an effective antitumor immunity.

Keywords: immunotherapy.


Conflict of interest statement

Competing interests: None declared.

Figures

Figure 1
Figure 1
High tumor mutation burden (TMB-H) is more robustly associated with improved overall survival (OS) following immune checkpoint blockade (ICB) treatment in cancer types with higher TMB. (A) Diagram of exhaustive survival analysis. Using all the possible TMB cut-offs, patients were separated into high TMB (TMB-H) and low TMB (TMB-L) groups to compare OS following ICB treatment (TMB-H vs TMB-L). The robustness of prognostic relevance was measured by the percentages of significantly favorable and unfavorable TMB cut-offs. Prognostic values were calculated by the HRs of all significant cut-offs. In this analysis, the bootstrap resampling method was applied to generate 10,000 randomly resampled cohorts using the original cohort, which were used to estimate the reproducibility of the prognostic association. (B) The relationships between TMB and OS across different cancer types in the Morris’s ICB cohort. Both univariate and multivariate Cox proportional hazards regression analyses were conducted to evaluate the OS of ICB-treated patients. Multivariate analysis was performed with covariates of sex, age, drug class, and year of ICB start. Bar plots show the percentages of favorable and unfavorable TMB cut-offs, with error bars representing the SE calculated by 10,000 bootstrap replicates (left plot). Dot plots show the average HR calculated using all significant TMB cut-offs, with error bars representing the mean±95% CI calculated by 10,000 bootstrap replicates (right plot). The negative log2-HR represents a better prognosis in patients with TMB-H tumors. Different colors correspond to favorable and unfavorable associations, with the color gradient showing the prognostic significance. (C–D) TMB-H is associated with favorable OS following ICB treatment in cancer types with higher TMB. (C) The correlation between the median TMB values and the percentages of significantly favorable TMB cut-offs in different cancer types. Colors correspond to cancer types. Spearman’s rho coefficient with p value and the linear regression line with 95% CI (dashed line and shade) are indicated in each graph. (D) The percentages of significantly favorable TMB cut-offs in two categories of cancer types defined by TMB levels. High TMB (category I) cancer types: melanoma, colorectal cancer, bladder cancer, and non-small cell lung cancer; low TMB (category II) cancer types: oesophagogastric cancer, head and neck cancer, glioma, breast cancer, and renal cell carcinoma. Error bars show the mean±SE. The results were considered statistically significant when p<0.05 (*), p<0.01 (**), p<0.001 (***), and p<0.0001 (****) and insignificant when p≥0.05 (ns) using Student’s t-test. (E–F) TMB-H is not associated with unfavorable OS following ICB treatment. (E) The correlation between the median TMB values and the percentages of significantly unfavorable TMB cut-offs in different cancer types. (F) The percentages of significantly unfavorable TMB cut-offs in high TMB (category I) and low TMB (category II) cancer types. (G–H) TMB-H is associated with improved ICB treatment outcome. (G) The correlation between the median TMB values and the average HRs of significant TMB cut-offs in different cancer types. (H) The average HRs of significant TMB cut-offs in high TMB (category I) and low TMB (category II) cancer types.
Figure 2
Figure 2
TMB-H is associated with improved progression-free survival (PFS) following ICB treatment in high TMB (category I) cancer types. (A) The prognostic relevance of TMB in melanoma and non-small cell lung cancer (NSCLC) from Kurzrock’s ICB cohort. Univariate Cox proportional hazards regression analyses were conducted to evaluate the PFS of ICB-treated patients. Bar plots show the percentages of favorable and unfavorable TMB cut-offs, with error bars representing the SE calculated by 10,000 bootstrap replicates (upper plot). Dot plots show the average HR of significant TMB cut-offs, with error bars representing the mean±95% CI calculated by 10,000 bootstrap replicates (lower plot). Different colors correspond to the significance of favorable and unfavorable associations, with the color gradient showing the prognostic significance. (B) The prognostic values of TMB in melanoma and NSCLC from Morris’s and Kurzrock’s ICB cohorts. Dot colors correspond to the significance of favorable and unfavorable associations. Dot shapes represent cancer types. Spearman’s rho coefficient with p value and the linear regression line with 95% CI (gray dashed line and shade) are indicated in the graph. ICB, immune checkpoint blockade; TMB, tumor mutation burden; TMB-H, high TMB.
Figure 3
Figure 3
Remarkable shifts in the distributions of significant TMB cut-offs for predicting favorable ICB treatment outcomes across different cancer types and the universal TMB cut-off in high TMB (category I) cancer types. (A–B) The shift in the distributions of significant TMB cut-offs for predicting favorable ICB treatment outcomes across different cancer types. Density plots show the distributions of significantly favorable TMB cut-offs calculated by 10,000 bootstrap replicates. Different colors represent cancer types in both Morris’s (A) and Kurzrock’s (B) cohorts. The black dashed line indicates the universal TMB cut-off of 13 mut/Mb in high TMB (category I) cancer types. (C) The percentages of different cancer types with high TMB (category I) and low TMB (category II) in Morris’s and Kurzrock’s cohorts, with color coding according to cancer types as in figure 3A. (D–E) Kaplan-Meier curves show the survival of ICB-treated patients in Morris’s (D) and Kurzrock’s (E) cohorts. Patients were divided into two subsets of high TMB (category I; left plot) and low TMB (category II; right plot) tumors. The log-rank p value and HR show the comparison between patients with TMB (mut/Mb) ≤13 and >13. The bottom panel shows the number of patients at risk every year. ICB, immune checkpoint blockade; mut/Mb, mutations/megabase; TMB, tumor mutation burden.
Figure 4
Figure 4
The difference in the significant TMB cut-offs for predicting favorable ICB treatment outcomes between pooled patients with high TMB (category I) and low TMB (category II) cancer types. (A–B) The prognostic relevance of TMB in pooled patients with high TMB (category I) and low TMB (category II) cancer types. Cox proportional hazards regression analyses were conducted to evaluate the OS in Morris’s ICB cohort (A) and PFS in Kurzrock’s ICB cohort (B). Multivariate analysis was performed with covariates of sex, age, drug class, and year of ICB start if applicable. Bar plots show the percentages of favorable and unfavorable TMB cut-offs, with error bars representing the SE calculated by 10,000 bootstrap replicates (upper plot). Dot plots show the average HR of significant TMB cut-offs, with error bars representing the mean±95% CI calculated by 10,000 bootstrap replicates (lower plot). Different colors correspond to favorable and unfavorable associations, with the color gradient showing prognostic significance. (C–D) The shift in the distributions of significant TMB cut-offs for predicting favorable ICB treatment outcomes in pooled patients with high TMB (category I) and low TMB (category II) cancer types. Density plots show the distributions of significantly favorable TMB cut-offs calculated by 10,000 bootstrap replicates from the Morris’s (C) and Kurzrock’s (D) ICB cohorts. The red dashed line indicates the TMB cut-off of 13 mut/Mb. ICB, immune checkpoint blockade; mut/Mb, mutations/megabase; OS, overall survival; PFS, progression-free survival; TMB, tumor mutation burden.
Figure 5
Figure 5
TMB-H (>13 mut/Mb) predicts a better ICB response in high TMB (category I) cancer types but not in low TMB (category II) cancer types. (A) ICB responses in high TMB (category I) and low TMB (category II) cancer types from Kurzrock’s cohort. The stacked bar graph shows the percentage of different ICB responses, with color coding according to different ICB responses. (B) TMB for predicting ICB responses in high TMB (category I) and low TMB (category II) tumors. Patients were separated into subsets of tumors with TMB (mut/Mb) ≤13 and >13. The results were considered statistically significant when p<0.05 (*), p<0.01 (**), p<0.001 (***), and p<0.0001 (****) and insignificant when p≥0.05 (ns) using the χ2 test with 10,000 replicates by Monte Carlo simulation. The black dashed line indicates a 20% objective response rate (ORR). ICB, immune checkpoint blockade; mut/Mb, mutations/megabase; CR, complete response; PD, progressive disease; PR, partial response; SD, stable disease; TMB, tumor mutation burden; TMB-H, high tumor mutation burden.
Figure 6
Figure 6
TMB-H is associated with improved OS following ICB treatment in cancer of unknown primary (CUP) with a better-than-anticipated prognostic value. (A) The prognostic relevance of TMB in CUP tumors from Morris’s ICB cohort. Both univariate and multivariate Cox proportional hazards regression analyses were conducted to evaluate the OS of ICB-treated patients. Multivariate analysis was performed with covariates of sex, age, drug class, and year of ICB start. Bar plots show the percentages of favorable and unfavorable TMB cut-offs, with error bars representing the SE calculated by 10,000 bootstrap replicates (upper plot). Dot plots show the average HR of significant TMB cut-offs, with error bars representing the mean±95% CI calculated by 10,000 bootstrap replicates (lower plot). Different colors correspond to favorable and unfavorable associations, with the color gradient showing the prognostic significance. (B) The distributions of significant TMB cut-offs for predicting the favorable ICB treatment outcomes of CUP tumors. Density plots show the distributions of significantly favorable TMB cut-offs calculated by 10,000 bootstrap replicates from Morris’s ICB cohort. The red dashed line indicates the TMB cut-off of 12 mut/Mb. (C) The Kaplan-Meier curves show the overall survival following ICB treatment in CUP patients with TMB-H and TMB-L tumors. The log-rank p value and HR show the comparison between patients with TMB-L (≤12 mut/Mb) and TMB-H (>12 mut/Mb). The bottom panel shows the number of patients at risk every half year. (D–F) The relationship of the median TMB values with the percentages of significantly favorable and unfavorable TMB cut-offs (D–E) and the average HRs of significant TMB cut-offs (F) in CUP, high TMB (category I), and low TMB (category II) cancer types. Dot shapes correspond to cancer types. The linear regression line with 95% CI was fitted using the data of high TMB (category I) and low TMB (category II) cancer types except for CUP. The dashed arrow shows the position of CUP. ICB, immune checkpoint blockade; mut/Mb, mutations/megabase; OS, overall survival; TMB, tumor mutation burden; TMB-H, high tumor mutation burden; TMB-L, low tumor mutation burden.

References

    1. Postow MA, Callahan MK, Wolchok JD. Immune checkpoint blockade in cancer therapy. JCO 2015;33:1974–82. 10.1200/JCO.2014.59.4358 - DOI - PMC - PubMed
    1. Topalian SL, Taube JM, Anders RA, et al. . Mechanism-driven biomarkers to guide immune checkpoint blockade in cancer therapy. Nat Rev Cancer 2016;16:275–87. 10.1038/nrc.2016.36 - DOI - PMC - PubMed
    1. Chan TA, Yarchoan M, Jaffee E, et al. . Development of tumor mutation burden as an immunotherapy biomarker: utility for the oncology clinic. Ann Oncol 2019;30:44–56. 10.1093/annonc/mdy495 - DOI - PMC - PubMed
    1. Goodman AM, Kato S, Bazhenova L, et al. . Tumor mutational burden as an independent predictor of response to immunotherapy in diverse cancers. Mol Cancer Ther 2017;16:2598–608. 10.1158/1535-7163.MCT-17-0386 - DOI - PMC - PubMed
    1. Samstein RM, Lee C-H, Shoushtari AN, et al. . Tumor mutational load predicts survival after immunotherapy across multiple cancer types. Nat Genet 2019;51:202–6. 10.1038/s41588-018-0312-8 - DOI - PMC - PubMed

Publication types

Substances