

doi: 10.1038/s41598-022-05509-z.
Laser induced breakdown spectroscopy for the rapid detection of SARS-CoV-2 immune response in plasma
Affiliations
- PMID: 35102204
- PMCID: PMC8803875
- DOI: 10.1038/s41598-022-05509-z
Item in Clipboard
Laser induced breakdown spectroscopy for the rapid detection of SARS-CoV-2 immune response in plasma
Sci Rep.
.
Abstract
As the SARS-CoV-2 pandemic persists, methods that can quickly and reliably confirm infection and immune status is extremely urgently and critically needed. In this contribution we show that combining laser induced breakdown spectroscopy (LIBS) with machine learning can distinguish plasma of donors who previously tested positive for SARS-CoV-2 by RT-PCR from those who did not, with up to 95% accuracy. The samples were also analyzed by LIBS-ICP-MS in tandem mode, implicating a depletion of Zn and Ba in samples of SARS-CoV-2 positive subjects that inversely correlate with CN lines in the LIBS spectra.
© 2022. The Author(s).
Conflict of interest statement
The authors declare no competing interests.
Figures
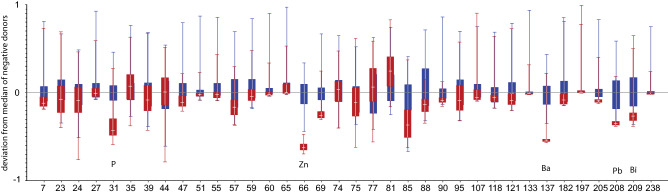
Variance in ICP-MS data between positive (red) and negative (blue) samples. A median mass spectrum of the negative samples has been subtracted from all spectra. All data was scaled to the 5–95 percentile range for each element. Error bars denote the interquartile range.

LIBS spectra from LIBS 1, LIBS 2 and UMass. Cumulative and averaged (UMass) spectra of 100 shots. Red are positive samples; blue are negative samples. LIBS 1 and LIBS 2 were deposited on PDVF filters (grey), UMass samples were deposited on Si wafers. All spectra are normalised to total intensity.
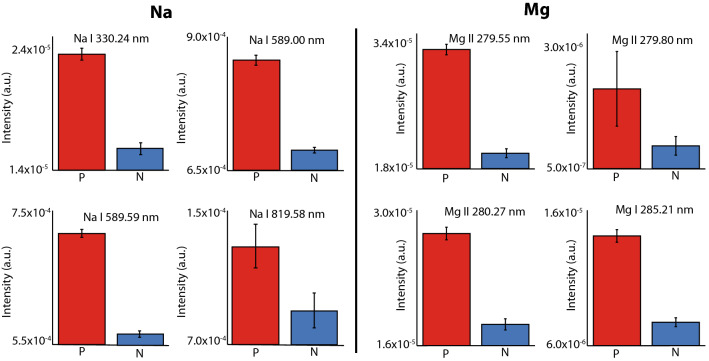
Comparison of the emission intensity of Na I and Mg I–II transitions in positive (red), and negative treated (blue) samples. The error bars represent the fitting error of the average spectra of positive (P) and negative (N).Transitions based on Refs.,.
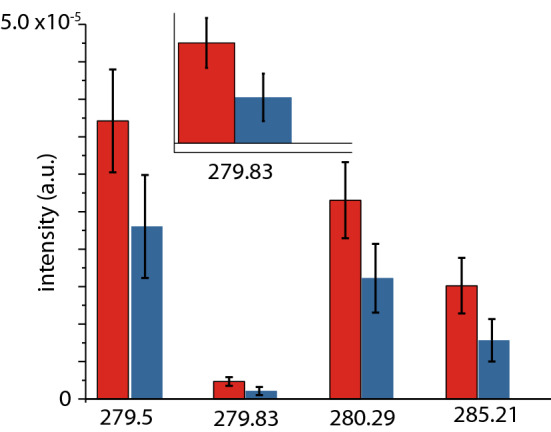
Comparison of the emission intensity of Mg I–II transitions in positive (red), and negative treated (blue) samples. Bars display the average between the fitted emission intensity of LIBS spectra of each individual sample, and the error bar is the standard deviation of the mean.

PCA of fused data of all 97 samples. Only PC 3 and 5 are shown here as they distinguish samples from positive and negative donors on the score plot. The loading plot shows some of the elements in all three sub datasets (LIBS 1, LIBS 2, ICP-MS), that distinguish the two clusters. Note Ba, Zn, P, Pb, Sr, Mg are correlated, and are anti-correlated to 385–384, 386, 358 and 330 nm.

Cumulative probabilities of positive versus negative result in test set of 19 samples.
References
-
- Nationwide Commercial Laboratory Seroprevalence Survey, Centers for Disease Control and Prevention. https://covid.cdc.gov/covid-data-tracker/#national-lab (Accessed May 2021).
-
- SeroTracker by the SeroTracker Collaboration. https://serotracker.com/en/Analyze (Accessed May 2021).
-
- Cremers DA, Radziemski LJ. Handbook of Laser-Induced Breakdown Spectroscopy. Wiley; 2013. p. 407.
Publication types
MeSH terms
Substances
Grants and funding
LinkOut - more resources
Full Text Sources
Medical
Research Materials
Miscellaneous
