. 2022 May;40(5):692-702.
doi: 10.1038/s41587-021-01145-6. Epub 2022 Jan 31.

A knowledge graph to interpret clinical proteomics data

Affiliations

A knowledge graph to interpret clinical proteomics data

Alberto Santos et al. Nat Biotechnol. 2022 May.

Abstract

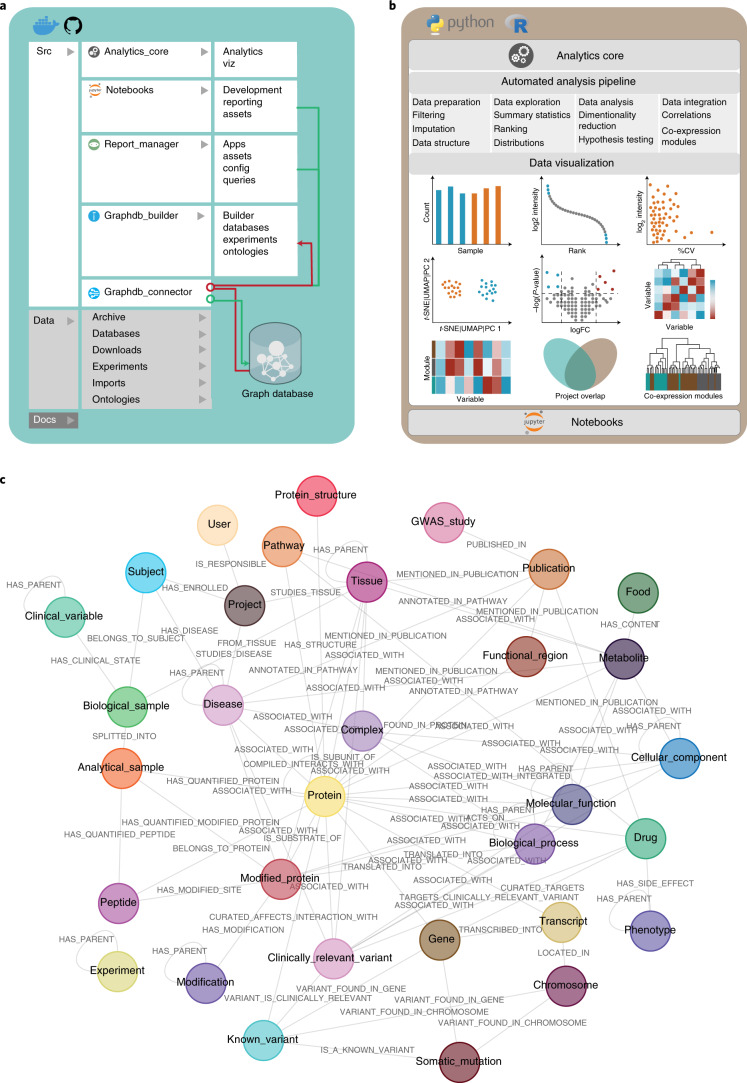
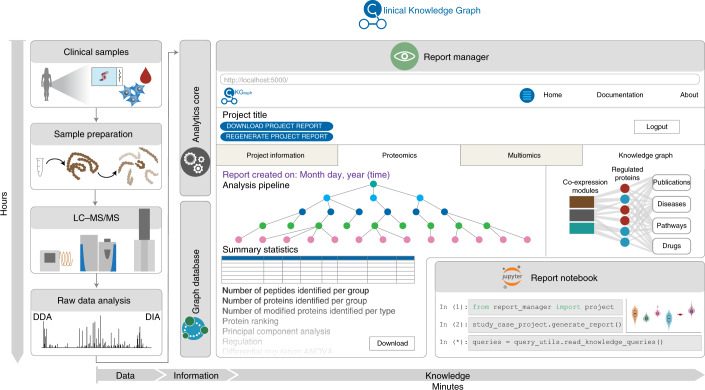
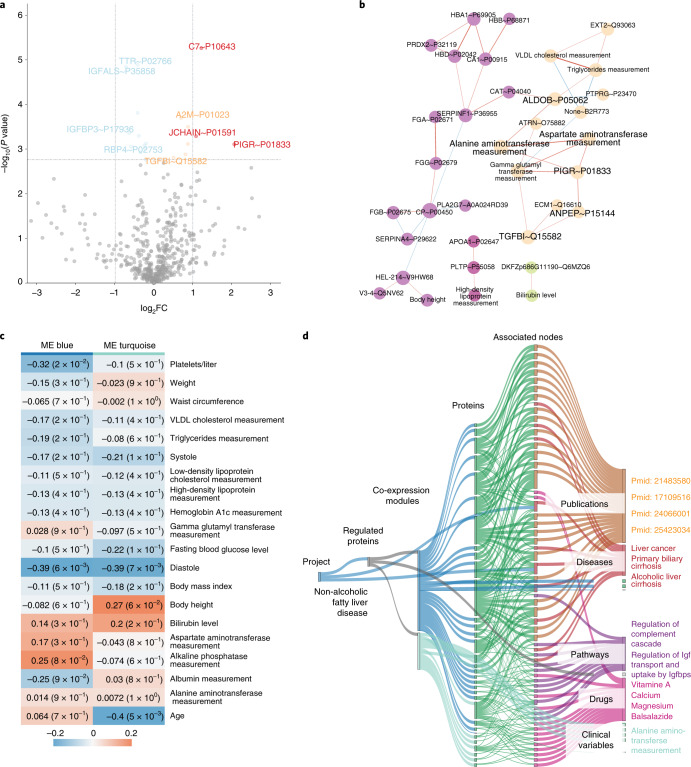
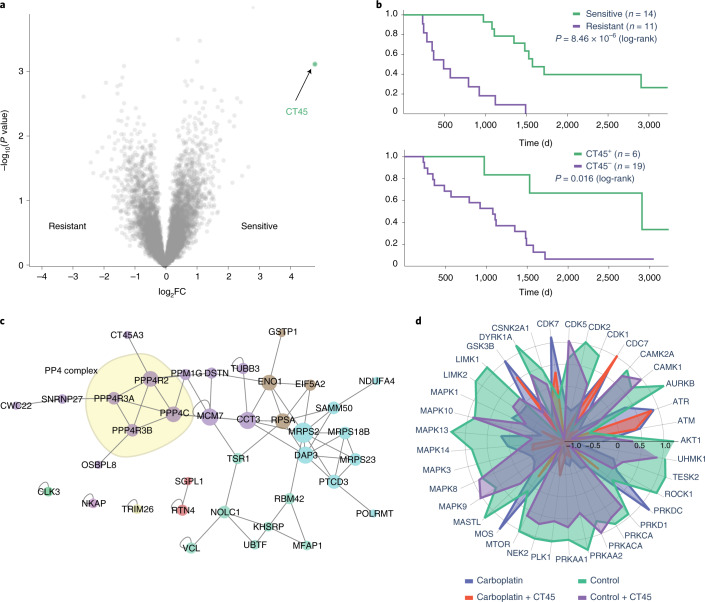
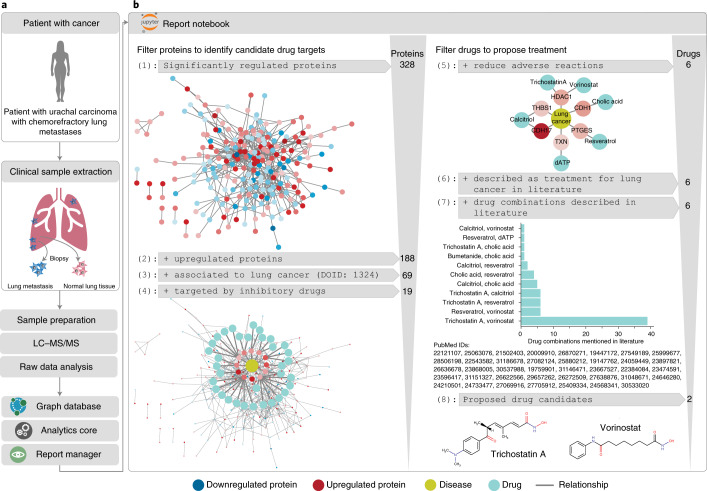
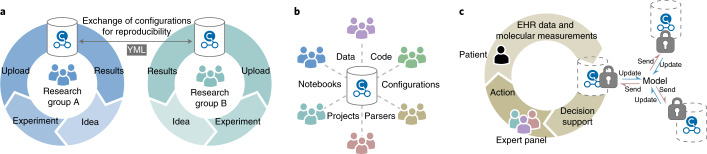
Implementing precision medicine hinges on the integration of omics data, such as proteomics, into the clinical decision-making process, but the quantity and diversity of biomedical data, and the spread of clinically relevant knowledge across multiple biomedical databases and publications, pose a challenge to data integration. Here we present the Clinical Knowledge Graph (CKG), an open-source platform currently comprising close to 20 million nodes and 220 million relationships that represent relevant experimental data, public databases and literature. The graph structure provides a flexible data model that is easily extendable to new nodes and relationships as new databases become available. The CKG incorporates statistical and machine learning algorithms that accelerate the analysis and interpretation of typical proteomics workflows. Using a set of proof-of-concept biomarker studies, we show how the CKG might augment and enrich proteomics data and help inform clinical decision-making.


Conflict of interest statement

The authors declare no competing interests.

Figures

Fig. 1
Fig. 1. The clinical knowledge graph architecture.
a, The CKG architecture is implemented in Python and contains several independent modules responsible for connecting to the graph database (graphdb_connector), building the graph (graphdb_builder), analyzing and visualizing experimental data (analytics_core), displaying and launching multiple applications (report_manager); it also contains a repository of Jupyter notebooks with analysis examples (notebooks). The code is accessible at https://github.com/MannLabs/CKG or as a complete Docker container. b, The CKG analytics core implements multiple up-to-date data science algorithms for statistical analysis and visualization of proteomics data: data preparation, exploration, analysis and visualization. This library can also be used directly within Jupyter notebooks, independently of the other CKG modules, and to analyze other omics types. c, The CKG graph database data model was designed to integrate multi-level clinical proteomics experiments and to annotate them with biomedical data. It defines different nodes (for example, Protein, Metabolite and Disease) and the types of relationship connecting them (for example, HAS_PARENT and HAS_QUANTIFIED_PROTEIN). FC, fold change; Src, source code.
Fig. 2
Fig. 2. Automated statistical reports.
The report_manager module includes a collection of dashboard applications that interface with the database and display statistics, create and upload new projects and report results from automated analysis pipelines. These reports include multiple tabs, one for each data type analyzed; a multiomics tab when multiple data types are analyzed together; and a knowledge graph that summarizes the results obtained in the previous tabs. This report can be viewed in the browser or accessed through a Jupyter notebook (Methods). LC–MS/MS, liquid chromatography with tandem mass spectrometry. DDA, data dependent acquisition; DIA, data independent acquisition.
Fig. 3
Fig. 3. Default analysis of the nonalcoholic fatty liver disease study.
The CKG’s automated analysis pipeline reproduced previous results (Niu et al.). Visualizations were generated automatically by the report manager and downloaded from the dashboard app. a, Differential regulation. The volcano plot is part of the analysis performed on the proteomics data (Proteomics tab) and shows the dysregulation of proteins involved in immune system regulation and inflammation (for example, C7, JCHAIN, PIGR and A2M) (two-sided t-test comparison of cirrhosis versus healthy—BH FDR < 0.05) (upregulated: orange/red (fold change (FC) > 2); downregulated: light blue/blue (FC > 2)). b, Global clinical proteomics correlation analysis. The network finds correlations between proteins and quantitative clinical variables (Spearman correlation) and shows that clinical liver enzyme values cluster together with HbA1c, PIGR, TGFBI, ANPEP, C7 and other candidate biomarkers of liver fibrosis and cirrhosis (nodes colored by cluster—Louvain clustering). c, WGCNA. This analysis generates a heat map showing the association of co-expression modules with clinical variables (correlation and P value). This plot shows a higher positive correlation between the co-expression blue module and clinically measured liver enzyme levels in the plasma. d, Knowledge summary. This Sankey plot shows a summary of all the results obtained connecting co-expression modules to proteins, clinical variables, related diseases and pathways, drugs and publications. Betweenness centrality prioritizes the nodes to be visualized among all the associations found in the knowledge graph (top 15 central nodes for each node type). VLDL, very-low-density lipoprotein. ME, module eigengenes.
Fig. 4
Fig. 4. CKG analysis of multi-level clinical proteomics.
a, The CKG highlights CT45 as the only protein significantly regulated when comparing ovarian tumor tissue from chemo-resistant and chemo-sensitive patients (n = 25; SAMR s0 = 2; BH FDR < 0.05) (data from Coscia et al.). b, The CKG’s analysis pipeline estimates the survival function for the clinical groups sensitive and resistant (two-sided log-rank test) with corresponding high (top 25%) and low (remaining 75%) CT45 expression and confirms the significantly longer disease-free survival of the high-CT45-expression group. c, Interaction proteomics revealed subunits of the PP4 phosphatase complex as direct interactors of CT45, shown by the CKG as clusters in the PPI network, confirming known interactors and highlighting potential novel ones (nodes colored by cluster). d, Phosphoproteomic analysis in the CKG identified significantly regulated sites and linked them to upstream kinase regulators. Among these kinase regulators, CDK7, CDC7, ATR and ATM are highly affected by the action of carboplatin. FC, fold change.
Fig. 5
Fig. 5. CKG helps to prioritize alternative treatments.
a, Re-analysis of Doll et al. resulted in more than 300 significantly regulated proteins differentially expressed in uracal carcinoma, and the analysis was then extended to prioritize candidate drug targets and treatments. b, Simplified representation of the major steps included in the extended downstream analysis. The pipeline mined the CKG database to identify upregulated proteins known to be linked to the studied disease, found inhibitory drugs for these proteins, retrieved reported side effects and ultimately identified possible combinations of the prioritized drugs based on co-mentioning in scientific literature. A Jupyter notebook with the complete analysis pipeline to prioritize candidate treatments can be found in notebooks/reporting, with the name Urachal Carcinoma Case Study.ipynb. LC–MS/MS, liquid chromatography with tandem mass spectrometry.
Fig. 6
Fig. 6. Vision of CKG’s deployment.
a, Reports and notebooks in local graphs can readily be shared to replicate analyses, thereby contributing to reproducible science. b, Aggregating data and knowledge of multiple projects from different groups within a community would allow direct and deep project comparison and lead to increasingly more robust and powerful analysis and knowledge generation. c, To protect the sensitive nature of healthcare data and still allow researchers to train models and learn from the data, the CKG could be implemented as a protected graph using federated learning. EHR, electronic health record.

References

    1. Leopold JA, Loscalzo J. Emerging role of precision medicine in cardiovascular disease. Circ. Res. 2018;122:1302–1315. doi: 10.1161/CIRCRESAHA.117.310782. - DOI - PMC - PubMed
    1. Doll S, et al. Rapid proteomic analysis for solid tumors reveals LSD1 as a drug target in an end-stage cancer patient. Mol. Oncol. 2018;12:1296–1307. doi: 10.1002/1878-0261.12326. - DOI - PMC - PubMed
    1. Coscia F, et al. Multi-level proteomics identifies CT45 as a chemosensitivity mediator and immunotherapy target in ovarian cancer. Cell. 2018;175:159–170. doi: 10.1016/j.cell.2018.08.065. - DOI - PMC - PubMed
    1. Doll S, Gnad F, Mann M. The case for proteomics and phospho‐proteomics in personalized cancer medicine. Proteomics Clin. Appl. 2019;13:1800113. doi: 10.1002/prca.201800113. - DOI - PMC - PubMed
    1. Lee JSH, Kibbe WA, Grossman RL. Data harmonization for a molecularly driven health system. Cell. 2018;174:1045–1048. doi: 10.1016/j.cell.2018.08.012. - DOI - PubMed

Publication types

MeSH terms