. 2022 Feb;7(2):312-326.
doi: 10.1038/s41564-021-01049-w. Epub 2022 Jan 31.

Histone acetylome-wide associations in immune cells from individuals with active Mycobacterium tuberculosis infection

Affiliations

Histone acetylome-wide associations in immune cells from individuals with active Mycobacterium tuberculosis infection

Ricardo C H Del Rosario et al. Nat Microbiol. 2022 Feb.

Erratum in

Abstract

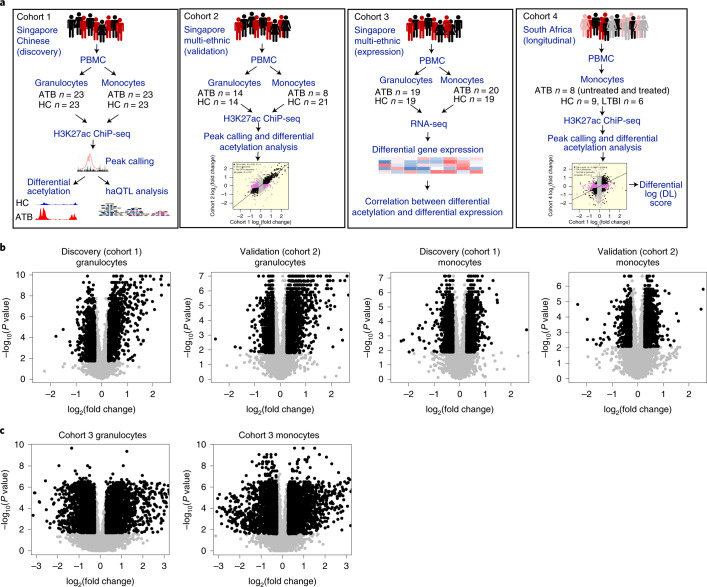
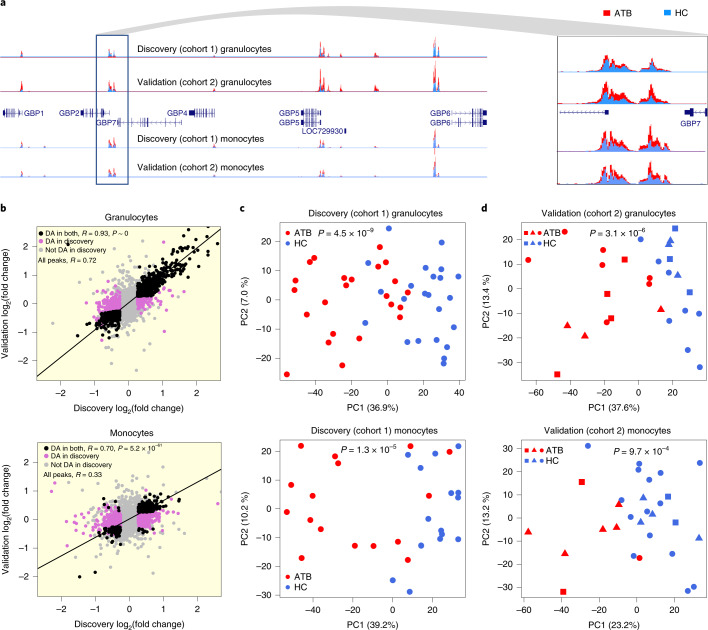
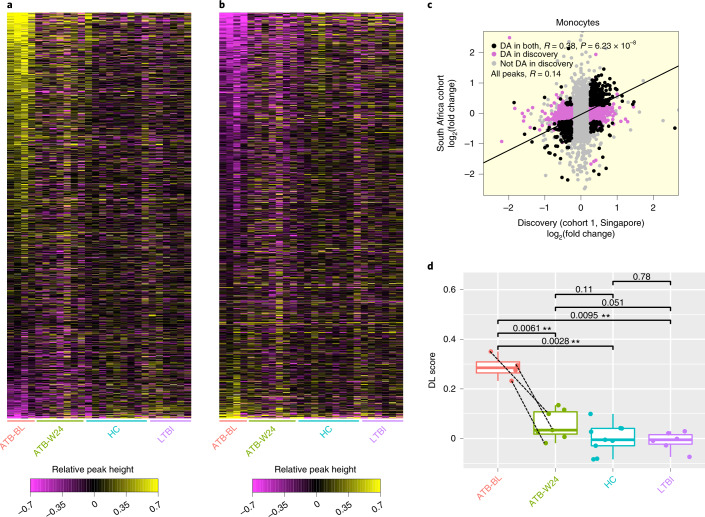
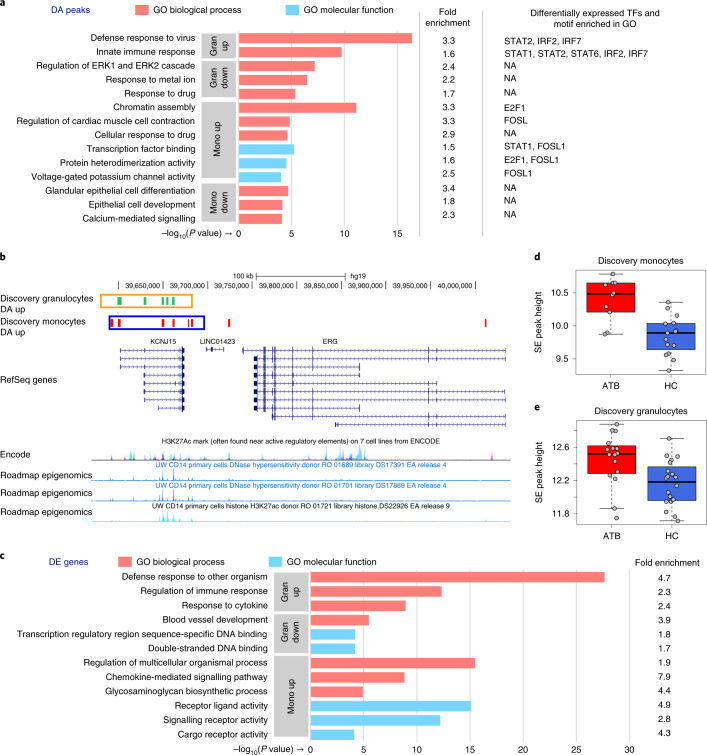
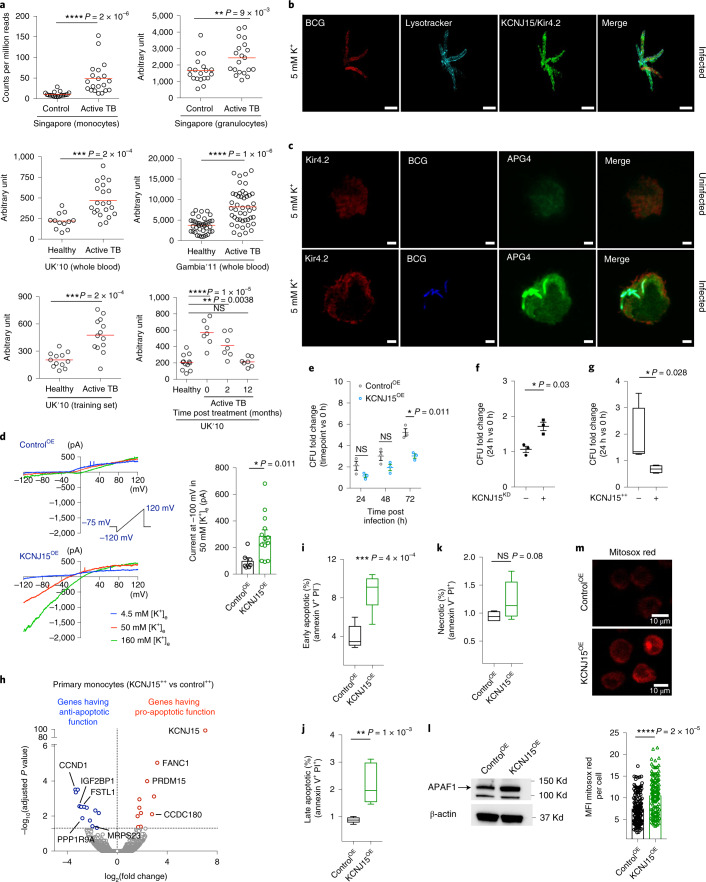
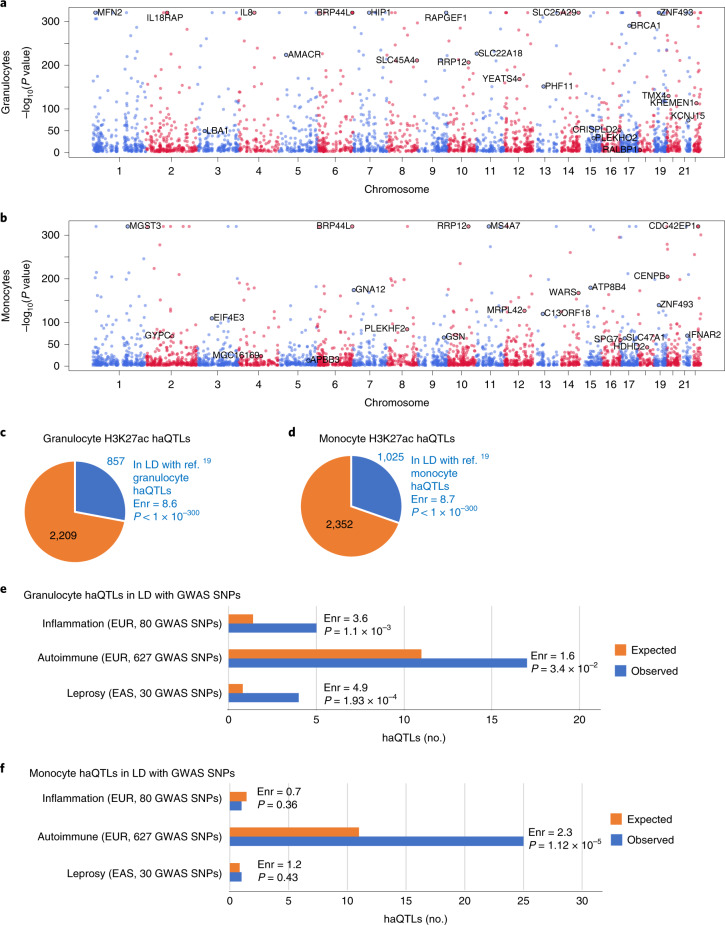
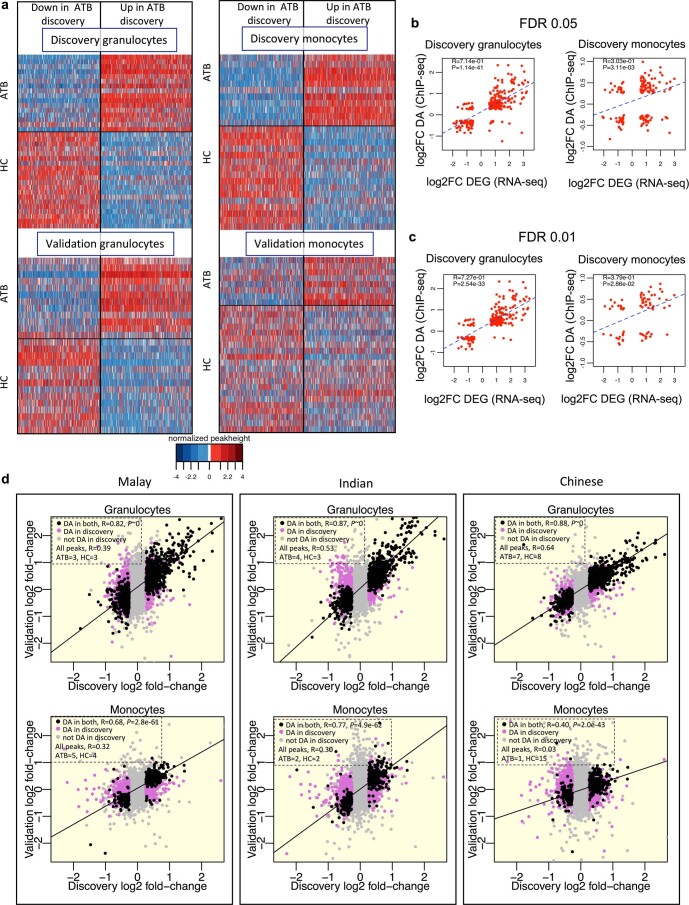
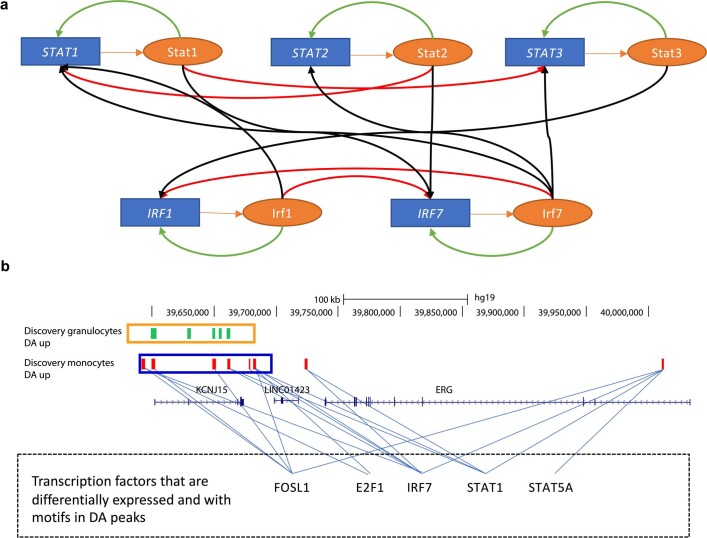
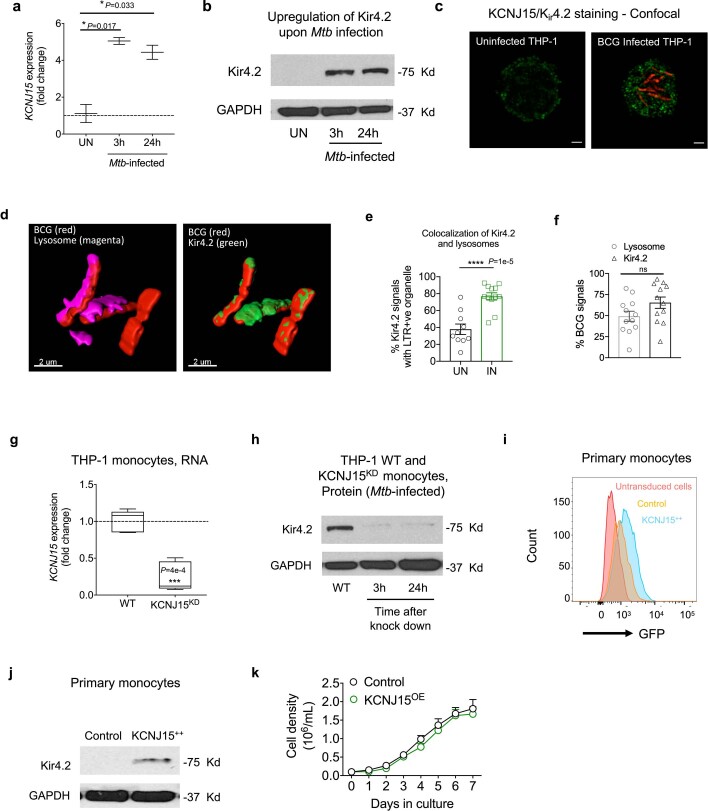
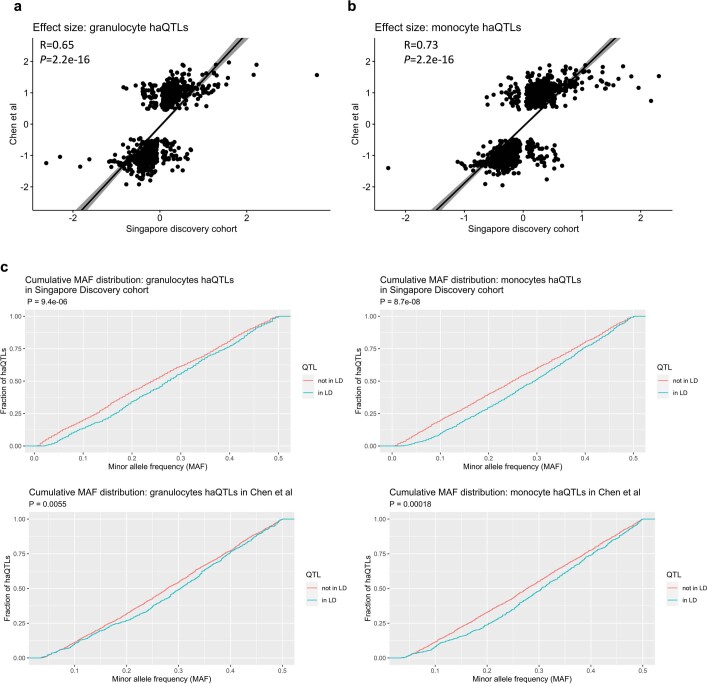
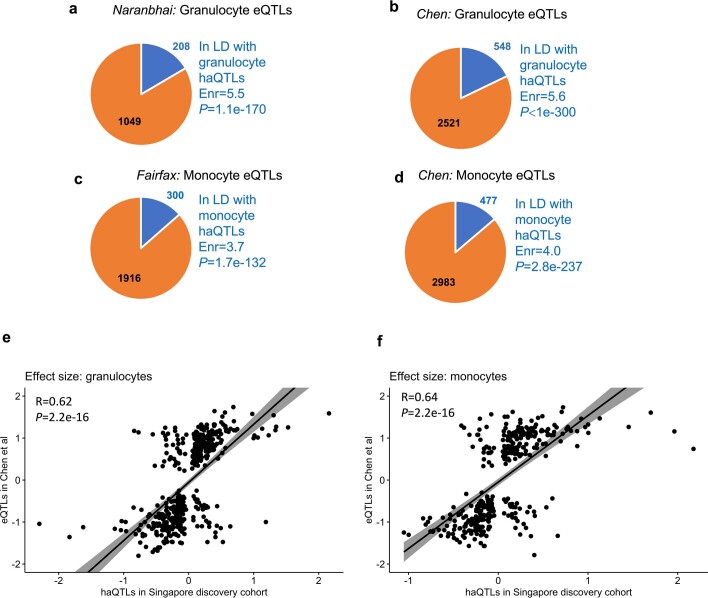
Host cell chromatin changes are thought to play an important role in the pathogenesis of infectious diseases. Here we describe a histone acetylome-wide association study (HAWAS) of an infectious disease, on the basis of genome-wide H3K27 acetylation profiling of peripheral blood granulocytes and monocytes from persons with active Mycobacterium tuberculosis (Mtb) infection and healthy controls. We detected >2,000 differentially acetylated loci in either cell type in a Singapore Chinese discovery cohort (n = 46), which were validated in a subsequent multi-ethnic Singapore cohort (n = 29), as well as a longitudinal cohort from South Africa (n = 26), thus demonstrating that HAWAS can be independently corroborated. Acetylation changes were correlated with differential gene expression. Differential acetylation was enriched near potassium channel genes, including KCNJ15, which modulates apoptosis and promotes Mtb clearance in vitro. We performed histone acetylation quantitative trait locus (haQTL) analysis on the dataset and identified 69 candidate causal variants for immune phenotypes among granulocyte haQTLs and 83 among monocyte haQTLs. Our study provides proof-of-principle for HAWAS to infer mechanisms of host response to pathogens.


Conflict of interest statement

The authors declare no competing interests.

Figures

Fig. 1
Fig. 1. Histone acetylome-wide association study of TB.
a, Overview of data generation and analysis. b, Volcano plots showing log2(fold change) and P value for consensus ChIP-seq peaks (black dots, DA peaks; see Methods). P value for each peak was calculated using a 2-sample two-sided Wilcoxon test and fold change was computed from the median of the peak heights. c, Volcano plots showing log2(fold change) and P value for expressed genes (black dots, DE genes, grey dots, non-DE genes; see Methods). P value for each gene was calculated using a 2-sample two-sided Wilcoxon test and fold change was computed from the median of the gene expression. Source data
Fig. 2
Fig. 2. Differentially acetylated (DA) peaks between ATB and HC.
a, Histone acetylation profiles showing consistent differences between ATB (red) and HC (blue) in the GBP locus. b, Scatterplot of ATB-vs-HC fold change in Singapore discovery and validation cohorts. R indicates Pearson correlation coefficient of log2(fold change) between discovery and validation. P value of concordance in fold-change direction for shared DA peaks was calculated using two-sided Fisher’s exact test. Black dots are DA both in discovery and validation cohorts. Pink dots are DA only in the discovery cohort. Grey dots are not DA in discovery cohort. c, Discovery cohort (exclusively Chinese). PCA of granulocyte and monocyte peak heights. d, Validation cohort (multi-ethnic). PCA of granulocyte and monocyte peak heights. In c and d, PCA was based on the discovery DA peak set and P values are from two-sided t-test of ATB-vs-HC PC1 values. Squares, Indian; circles, Chinese; triangles, Malay. Source data
Fig. 3
Fig. 3. Reproducibility of differential H3K27 acetylation in monocytes.
a, Each row represents an H3K27ac peak that showed increased acetylation in ATB relative to HC in the Singapore discovery cohort (‘Up’ DA peaks). Each column represents a sample in the longitudinal South African cohort (Cohort 4). The heat map is coloured on the basis of relative peak height, calculated as: log2(peak height in sample) – average(log2(peak height in HC)). ATB-BL, ATB at baseline (untreated); ATB-W24, ATB after 24 weeks of treatment. b, Same as a, but for peaks with decreased acetylation in ATB relative to HC in the Singapore discovery cohort (‘Down’ DA peaks). c, Scatterplot of ATB-vs-HC peak height fold change in the Singapore discovery cohort and the South African cohort. d, The differential log(peak height) values shown in b were averaged across all Up DA peaks to calculate a differential log (DL) score for each sample. Dashed lines indicate samples from the same individual. Two-sided t-test, **P < 0.01. ATB-BL n = 4, ATB-W24 n = 7, HC n = 9, LTBI n = 6. The box shows the 25th and 75th percentiles, the median is indicated by a thick horizontal line, and the ends of the whiskers (segments) indicate 1.5 times the interquartile range. Source data
Fig. 4
Fig. 4. Functional-enrichment analysis of DA peaks, KCNJ15 UCSC browser view and SE peak heights.
a, Discovery cohort. Gene ontology enrichment analysis of granulocyte and monocyte DA peaks relative to all peaks. The top three non-redundant gene ontology terms (by P value) are shown. For each term, the fold enrichment of DA peaks is shown, as well as enriched TF motifs and corresponding differentially expressed TFs (if any). N/A, not applicable. b, KCNJ15 locus. Green and red ticks indicate DA peaks upregulated in response to infection in granulocytes and monocytes, respectively. Orange and blue boxes indicate the corresponding super-enhancer (SE) regions. For reference, H3K27ac ChIP-seq and DNaseI hypersensitivity data from CD14 primary cells (Roadmap Epigenomics) are shown below, along with layered H3K27ac from 7 cell types (ENCODE). c, Gene ontology enrichment analysis of DE genes, similar to a. d, SE peak heights of monocyte discovery samples at the KCNJ15 locus. The peak heights were calculated from reads that mapped into the monocyte SE region displayed in b, and covariates were regressed using the same method used for the RNA-seq data (Methods). The boxplot shows that the SE is activated in response to TB infection (unpaired two-sided Wilcoxon test P = 8.99 × 10−4; fold change, 1.5; ATB n = 10, HC n = 15). The box shows the 25th and 75th percentiles, the median is indicated by a thick horizontal line, and the ends of the whiskers (segments) indicate 1.5 times the interquartile range. e, Similar to d, granulocyte samples (Wilcoxon test P = 3.48 × 10−3; fold change, 1.3; ATB n = 16, HC n = 20). Source data
Fig. 5
Fig. 5. Functional characterization of KCNJ15/Kir4.2.
a, KCNJ15 mRNA expression in ATB and HC individuals from multiple cohorts (Supplementary Table 36). Singapore: RNA-seq, this study; UK 2010, Gambia 2011: microarray. Red line, median. P value: two-tailed Mann–Whitney U test (case-control) and paired Wilcoxon signed-rank test (time course). b, 3D projection of a THP-1 monocyte infected with mcherry-BCG (red), stained for lysosomes (cyan) and KCNJ15/Kir4.2 (green). The images were acquired 24 h post infection by 3D-SIM. Scale bar, 2 µm. c, Confocal images of uninfected and mcherry-BCG-infected (blue pseudocolor) THP-1 monocytes stained for intracellular K+ (APG-4, green) and Kir4.2 (red), 24 h post infection. Scale bar, 2 µm. Data from 3 independent experiments. d, Left: patch-clamp recordings of THP-1 ControlOE and KCNJ15OE cells using a ramp protocol from −120 mV to 120 mV in 200 ms showing currents elicited at 4.5, 50 and 160 mM [K+]e. Right: average current amplitude recorded at −100 mV in 50 mM [K+]e is shown as a scatterplot, n = 7 and 13 cells for ControlOE and KCNJ15OE, respectively. Data from 2 independent experiments. e, Mycobacterial (BCG) growth in THP-1 monocytes; compiled data of n = 3 independent experiments, each in triplicate. f, Mtb growth after 24 h in scrambled control (–) and KCNJ15KD ( + ) THP-1 monocytes; compiled data of n = 3 independent experiments, each in triplicate. g, Mtb growth in KCNJ15-overexpressing (KCNJ15++) and control (empty vector) primary monocytes; n = 4 donors, 24 h post infection. CFU, colony-forming units. n = 2 independent experiments. h, Volcano plot of differential gene expression between KCNJ15++ and control cells. Apoptotic genes have been highlighted. P values from two-sided Wald test in DESeq2 package, FDR < 0.05. i–k, Flow cytometry data of ControlOE and KCNJ15OE THP-1 monocytes stained with Annexin V and PI. Data from 2 independent experiments, n = 6. l, Immunoblot of protein lysate of ControlOE and KCNJ15OE THP-1 cells with APAF1 and β-actin. Data from 2 independent experiments. m, ControlOE and KCNJ15OE THP-1 cells stained for mROS using Mitosox red. Mean fluorescence intensity (MFI) data from n = 150 cells of either type. Top panel-representative images. Bottom panel-compiled data. P values in d, e and ik were calculated using two-sided unpaired t-test, two-sided paired t-test in f, and two-sided Mann–Whitney U test in g and m. In df, mean ± s.e.m. Data in g and ik are shown as box and whiskers, minimum to maximum. *P < = 0.05, **P < = 0.01, ***P < = 0.001, ****P < = 0.0001; NS, not statistically significant. Source data
Fig. 6
Fig. 6. Landscape of haQTLs in granulocytes and monocytes.
a,b, Manhattan plots of haQTL distribution in granulocytes and monocytes. Gene names are indicated next to haQTLs that are in LD with eQTLs in the same cell type. Granulocyte eQTLs were obtained from Naranbhai et al. and monocyte eQTLs from Fairfax et al.. The alternating red and blue colours of the dots are used to delineate chromosomes. P values are from the G-SCI test (details in Supplementary Methods, ‘Histone Acetylation QTLs’). c,d, Pie charts of granulocyte and monocyte haQTLs identified in this study that are in LD with haQTLs from a previous study. Fold enrichment (Enr) and P value of haQTL overlap relative to randomly chosen SNPs in peaks are indicated (details in Supplementary Methods, ‘Overlap with published haQTL datasets’). e,f, Number of non-redundant granulocyte and monocyte haQTLs in LD with genome-wide significant GWAS SNPs. Orange bars, expected number of haQTLs adjusted for minor allelic frequency distribution and distance to the nearest transcription start site; blue bars, observed; P values, Z-score test (details in Methods, ‘Statistical significance of LD between haQTLs and GWAS SNPs’); EUR, European; EAS, East Asian. Source data
Extended Data Fig. 1
Extended Data Fig. 1. Regression of confounding variables in H3K27ac ChIP-seq data.
(a) Method for selecting covariates to be regressed in discovery samples. The covariate that explained the most variance at each iteration of the method was plotted. (b) MA plot of peak heights for the discovery and validation cohorts. Only consistent samples were used. Source data
Extended Data Fig. 2
Extended Data Fig. 2. ChIP-seq peak height z-scores, fold change correlation of ChIP-seq and RNA-seq data, and ethnicity-specific fold-change correlation for ChIP-seq data.
(a) DA peak height z-scores for the four ATB vs. HC Singapore (discovery and validation) datasets from samples from the core set. Each row represents a single individual, and each column a DA peak ascertained from the discovery cohort. The peaks in the top and bottom panels are arranged in the same order. Only consistent samples are displayed (granulocytes discovery: ATB = 16, HC = 20; monocytes discovery: ATB = 11, HC = 16; granulocytes validation: ATB = 12, HC = 14; monocytes validation: ATB = 8, HC = 21). (b,c) Correlation between differential acetylation and differential gene expression (related to Supplementary Table 18). DE and DA gene sets were defined using the default FDR threshold of 0.05 (b) as well as a more stringent FDR threshold of 0.01 (c). DA peaks were associated with DE genes using the GREAT tool and the Pearson correlation of log-fold change was calculated. P-values indicate concordance of the fold-change direction, calculated using a one-sided hypergeometric test. (d) Ethnicity-specific fold-change correlation between discovery and validation cohorts. Black dots are DA both in discovery and validation cohorts. Pink dots are DA only in the discovery cohort. R indicates Pearson correlation coefficient of log2(fold-change) between discovery and validation. P-value of concordance in fold-change direction for shared DA peaks was calculated using two-sided Fisher’s exact test. Source data
Extended Data Fig. 3
Extended Data Fig. 3. Transcription factors and super enhancers in the KCNJ15 locus.
(a) Predicted gene regulatory interactions in granulocytes between differentially expressed TFs associated with DA peaks belonging to enriched GO terms in Fig. 5a. Blue boxes: genes. Orange ovals: proteins. Orange arrows: translation. Green arrows: autoregulatory loops. Red arrows: cross-regulation of paralogous TFs. Black arrows: cross-regulation of other TFs. (b) KCNJ15 locus: green and red ticks indicate DA peaks up-regulated in response to infection in granulocytes and monocytes respectively. Orange and blue boxes indicate the corresponding super-enhancer regions. Blue lines: predicted transcription factor binding sites for master transcription factors in DA peaks. Source data
Extended Data Fig. 4
Extended Data Fig. 4. Role of KCNJ15/Kir4.2 during Mycobacterial infection.
(a) KCNJ15 mRNA was assessed by qRT-PCR in Mtb-infected primary monocytes. KCNJ15 expression normalized to GAPDH, relative to uninfected (UN) cells, is shown. P-values from two-sided, unpaired t-test. Data from 2 independent experiments. (b) Western blot analysis of Kir4.2 and GAPDH in Mtb-infected primary monocytes as in a. Data from 2 independent experiments. (c) Immunostaining (confocal microscopy) of Kir4.2 in THP-1 cells, which was increased upon M. bovis BCG infection. Green: Kir4.2; red: mCherry- BCG. Scale-bars: 2μm. Data from 3 independent experiments. (d) Uninfected or mcherry-BCG infected THP-1 monocytes stained for endo-lysosomes with Lysotracker (LTR) and KCNJ15/Kir4.2, 24 h post-infection. Images from BCG-infected cells are shown. Scale bar 2 µm. Data from 2 independent experiments. (e) Compiled data of Kir4.2 co-localization with LTR in uninfected (UN) and BCG-infected (IN) cells, as shown in d. n = 10-12 cells; P-value from two-sided, unpaired t-test. (f) Percentage of BCG co-localized with either endo-lysosomes only or Kir4.2 only, from d. n = 10-12 cells. (g) siRNA-mediated knockdown of KCNJ15 in THP-1 cells (KCNJ15KD), RT-PCR of KCNJ15 gene. Data from 5 independent experiments P-value from two-tailed, unpaired t-test. (h) Western blot for Kir4.2 protein in KCNJ15KD THP-1 cells. Data from 2 independent experiments. (i) CD14+ primary monocytes were transduced with either lentiviral plasmid carrying human KCNJ15 cDNA or the control plasmid. Transduction efficiency was determined by FACS using GFP which is constitutively expressed. Pink: un-transduced cells; orange: cells transduced with empty control vector; blue: cells transduced with KCNJ15 plasmid. Data from 3 independent experiments. (j) Transduction efficiency of primary monocytes in (i) was determined by Western blotting. Data from 2 independent experiments. (k) Growth curve of KCNJ15OE and Control cells (ControlOE) in vitro in RPMI medium, indicating no defect in the growth of KCNJ15OE cells. Cells were seeded at 105 cells/ml. Data from 2 independent experiments. Data in a and g: box and whiskers, minimum to maximum. Data in e,f,k: mean±SEM. Statistically significant P-values: * P < = 0.05, ** P < = 0.01, ***P < = 0.001, **** P < = 0.0001. Source data
Extended Data Fig. 5
Extended Data Fig. 5. Comparison of haQTLs from different studies.
Comparison of granulocyte (a) and monocyte (b) haQTL effect size between the Singapore discovery cohort (Chinese) and the European cohort. Each dot represents an haQTL in the Singapore discovery cohort (x-axis) and a corresponding European haQTL in LD with the former. Effect size is defined as the regression coefficient beta relating ChIP-seq peak height to genotype. R: Pearson correlation. P-value: two-sided Pearson correlation P-value. (c) Cumulative minor allele frequency distributions for granulocyte and monocyte haQTLs in the Singapore discovery cohort (Chinese) and the European dataset. Blue curves: shared haQTLs. Red curves: cohort-specific haQTLs. The statistical significance (Kolmogorov-Smirnov test, two-sample, two-sided) of the shift in allele frequency between shared and non-shared haQTLs is indicated in each panel. Source data
Extended Data Fig. 6
Extended Data Fig. 6. Comparison of haQTLs with eQTLs.
(a) – (d) Pie charts of granulocyte and monocyte eQTLs from previous studies that are in LD with corresponding haQTLs from this study. Enr: fold-enrichment; P-value: Z-score test (details are in Methods section on “Statistical significance of LD between haQTLs and eQTLs”). (e,f) Comparison of effect size between haQTLs in Singapore discovery cohort and eQTLs in the European dataset for (e) granulocytes and (f) monocytes. Each dot represents an haQTL in the Singapore discovery cohort (x-axis) and a corresponding eQTL in the European dataset that is in LD with the former. Effect size is defined as the regression coefficient beta relating ChIP-seq peak height to genotype. R: Pearson correlation. P-value: two-sided Pearson correlation P-value. Source data

Comment in

References

    1. WHO World Health Statistics 2016: Monitoring Health for the SDGshttp://www.who.int/gho/publications/world_health_statistics/2016/en/ (2016).
    1. Behar SM, Divangahi M, Remold HG. Evasion of innate immunity by Mycobacterium tuberculosis: is death an exit strategy? Nat. Rev. Microbiol. 2010;8:668–674. doi: 10.1038/nrmicro2387. - DOI - PMC - PubMed
    1. Kumar D, et al. Genome-wide analysis of the host intracellular network that regulates survival of Mycobacterium tuberculosis. Cell. 2010;140:731–743. doi: 10.1016/j.cell.2010.02.012. - DOI - PubMed
    1. Berry MPR, et al. An interferon-inducible neutrophil-driven blood transcriptional signature in human tuberculosis. Nature. 2010;466:973–977. doi: 10.1038/nature09247. - DOI - PMC - PubMed
    1. Blankley S, et al. A 380-gene meta-signature of active tuberculosis compared with healthy controls. Eur. Respir. J. 2016;47:1873–1876. doi: 10.1183/13993003.02121-2015. - DOI - PMC - PubMed

Publication types

MeSH terms