Review
. 2022 Jun;23(6):355-368.
doi: 10.1038/s41576-021-00444-7. Epub 2022 Jan 31.

Temporal modelling using single-cell transcriptomics

Affiliations
Review

Temporal modelling using single-cell transcriptomics

Jun Ding et al. Nat Rev Genet. 2022 Jun.

Abstract

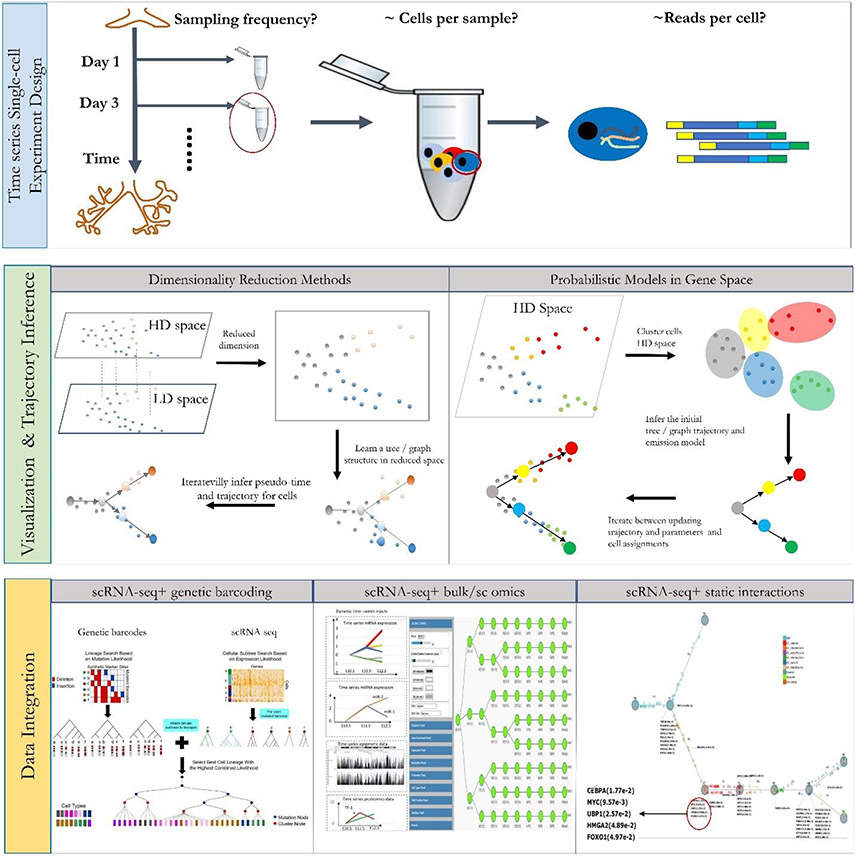
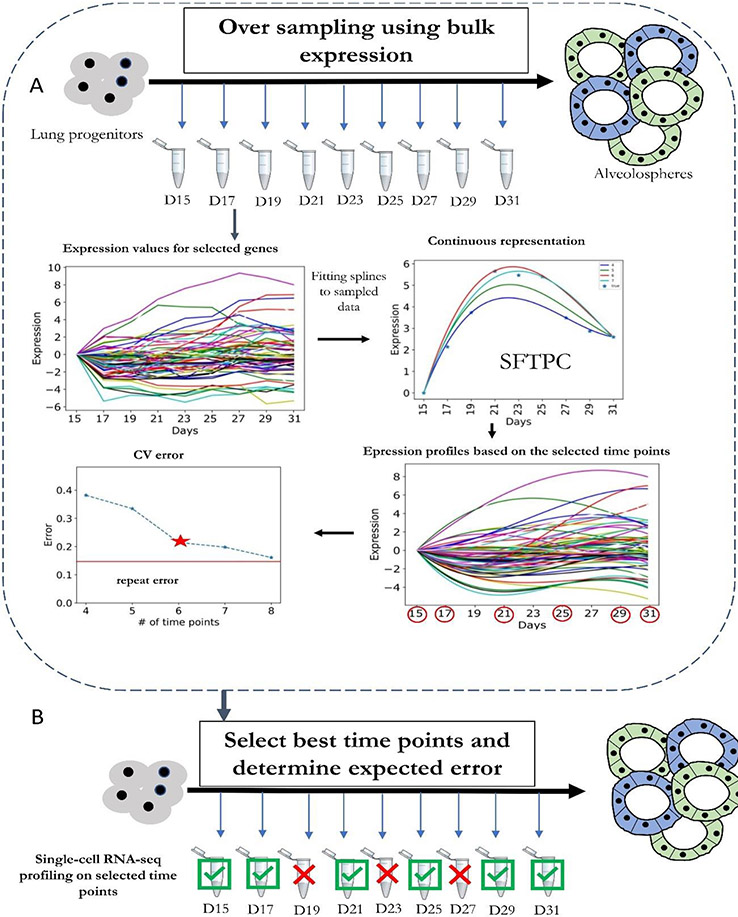
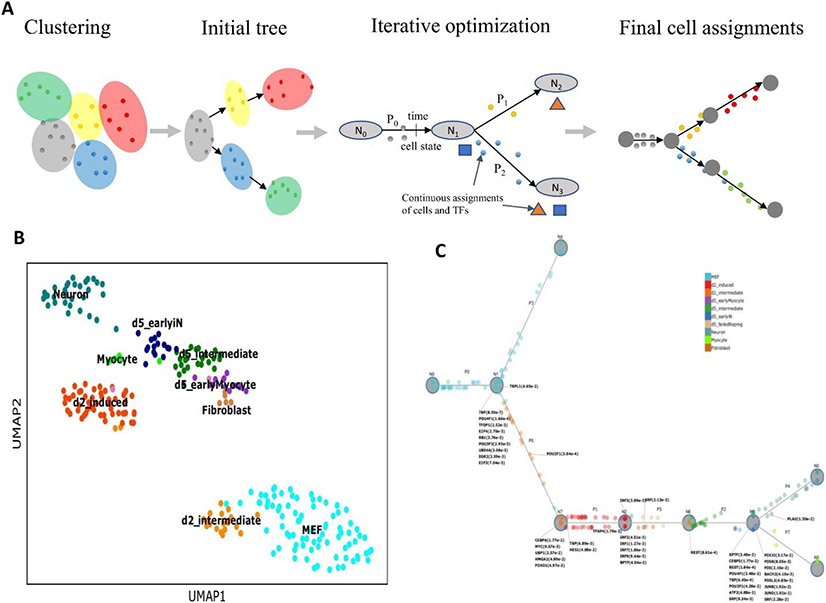
Methods for profiling genes at the single-cell level have revolutionized our ability to study several biological processes and systems including development, differentiation, response programmes and disease progression. In many of these studies, cells are profiled over time in order to infer dynamic changes in cell states and types, sets of expressed genes, active pathways and key regulators. However, time-series single-cell RNA sequencing (scRNA-seq) also raises several new analysis and modelling issues. These issues range from determining when and how deep to profile cells, linking cells within and between time points, learning continuous trajectories, and integrating bulk and single-cell data for reconstructing models of dynamic networks. In this Review, we discuss several approaches for the analysis and modelling of time-series scRNA-seq, highlighting their steps, key assumptions, and the types of data and biological questions they are most appropriate for.


Figures

Figure 1.
Figure 1.. Overview of time-series single-cell RNA-seq data analysis.
Top: Experimental design of time-series single-cell studies. Although many of the issues involved in designing time-series single-cell RNA sequencing (scRNA-seq) studies are similar to issues involved in designing single-timepoint (snapshot) scRNA-seq studies, additional consideration should be given to the sampling rates and the number of cells per sample (Box 1). The optimal sampling rate is impacted by the expected change in cell states and cell types, whereas the number of cells per sample is dependent on the distribution of cell types. Middle: Visualization and initial analysis of time-series data. Most methods for the analysis of time-series scRNA-seq data attempt to visualize the trajectory and pseudotime order of cells, both within each time point and between time points. Many different methods have been developed for this and these differ in the way they use the data, in the type of models they reconstruct and in how they assign the pseudotime. Bottom: Data integration. Several methods have been developed to complement time-series scRNA-seq by integrating it with other types of omics and interaction data. Examples include genetic barcoding methods (left), time-series bulk data (middle) and protein–DNA interaction data (right).
Figure 2.
Figure 2.. Selecting time points to sample in single-cell RNA-seq experiments.
a ∣ Oversampling of bulk RNA sequencing (RNA-seq) data. The bulk data are then used to determine the expected error for each potential subset of time points used. A heuristic search is then performed to select the optimal set of time points given cost or error constraints. b ∣ Selected time points are then used to profile single-cell RNA sequencing (scRNA-seq) data. Errors computed in (a) for this subset of time points can be used to bound the expected difference between reconstructed and underlying expression levels. CV, coefficient of variation; D, days; SFTPC, pulmonary surfactant-associated protein C (a marker of AT2 alveolar stem cells).
Figure 3.
Figure 3.. Dynamic regulatory network inference using CSHMM.
a ∣ A scheme for continuous-state hidden Markov model (CSHMM) and cell assignment learning. The method is initialized using clustering in gene space. Relationships between clusters are analyzed to obtain an initial branching model. Next the method iterates between cell assignment along the branches of the branching model and learning model parameters including structure and emission probabilities. Cell assignment is also determined based on predicted transcription factors (TFs) for each branching point and their targets allowing the method to infer key TFs and their activation time. b ∣ A Standard uniform manifold approximation and projection (UMAP) plot of cells profiled to study neuron differentiation. c ∣ CSHMM reconstructed trajectory for the same cells. Cells are assigned to different locations along the branches based on their inferred pseudotime. The model also includes parameters for the expected expression levels for all genes at each time. Key TFs and their p-values are associated with each of the branching points in the model.

References

    1. Gasch AP et al. Single-cell RNA sequencing reveals intrinsic and extrinsic regulatory heterogeneity in yeast responding to stress. PLoS biology 15, e2004050 (2017). - PMC - PubMed
    1. Zou Z. et al. A single-cell transcriptomic atlas of human skin aging. Developmental cell 56, 383–397. e388 (2021). - PubMed
    1. Stuart T & Satija R Integrative single-cell analysis. Nature Reviews Genetics 20, 257–272 (2019). - PubMed
    1. Alavi A, Ruffalo M, Parvangada A, Huang Z & Bar-Joseph Z A web server for comparative analysis of single-cell RNA-seq data. Nature communications 9, 1–11 (2018). - PMC - PubMed
    1. Dumitrascu B, Villar S, Mixon DG & Engelhardt BE Optimal marker gene selection for cell type discrimination in single cell analyses. Nature communications 12, 1–8 (2021). - PMC - PubMed

Publication types

MeSH terms