. 2022 Mar;603(7901):488-492.
doi: 10.1038/s41586-022-04460-3. Epub 2022 Jan 31.

T cell responses to SARS-CoV-2 spike cross-recognize Omicron

Affiliations

T cell responses to SARS-CoV-2 spike cross-recognize Omicron

Roanne Keeton et al. Nature. 2022 Mar.

Erratum in

  • Author Correction: T cell responses to SARS-CoV-2 spike cross-recognize Omicron.
    Keeton R, Tincho MB, Ngomti A, Baguma R, Benede N, Suzuki A, Khan K, Cele S, Bernstein M, Karim F, Madzorera SV, Moyo-Gwete T, Mennen M, Skelem S, Adriaanse M, Mutithu D, Aremu O, Stek C, du Bruyn E, Van Der Mescht MA, de Beer Z, de Villiers TR, Bodenstein A, van den Berg G, Mendes A, Strydom A, Venter M, Giandhari J, Naidoo Y, Pillay S, Tegally H, Grifoni A, Weiskopf D, Sette A, Wilkinson RJ, de Oliveira T, Bekker LG, Gray G, Ueckermann V, Rossouw T, Boswell MT, Bhiman JN, Moore PL, Sigal A, Ntusi NAB, Burgers WA, Riou C. Keeton R, et al. Nature. 2022 Apr;604(7907):E25. doi: 10.1038/s41586-022-04708-y. Nature. 2022. PMID: 35396582 Free PMC article. No abstract available.

Abstract

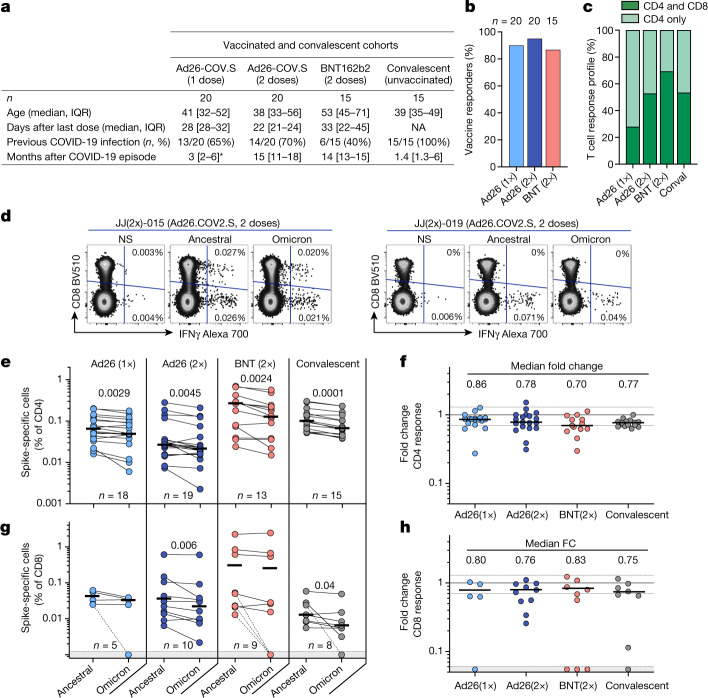
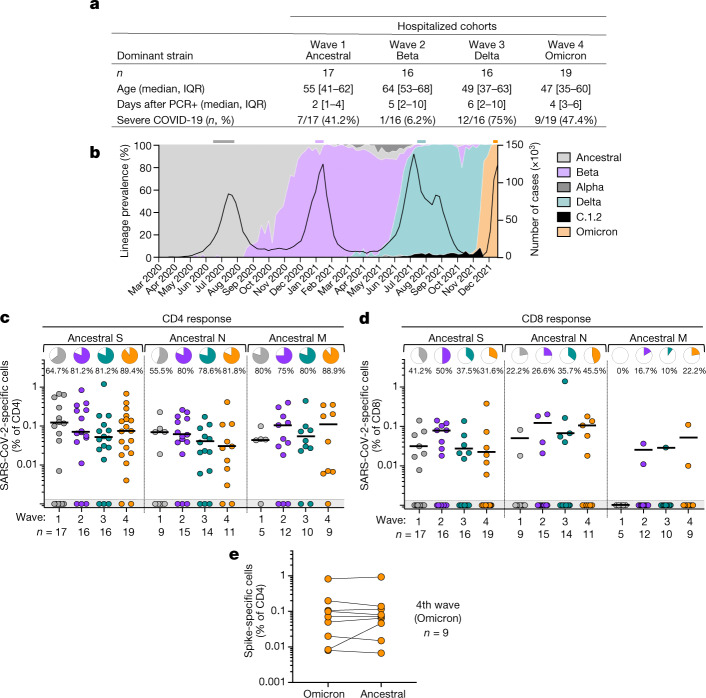
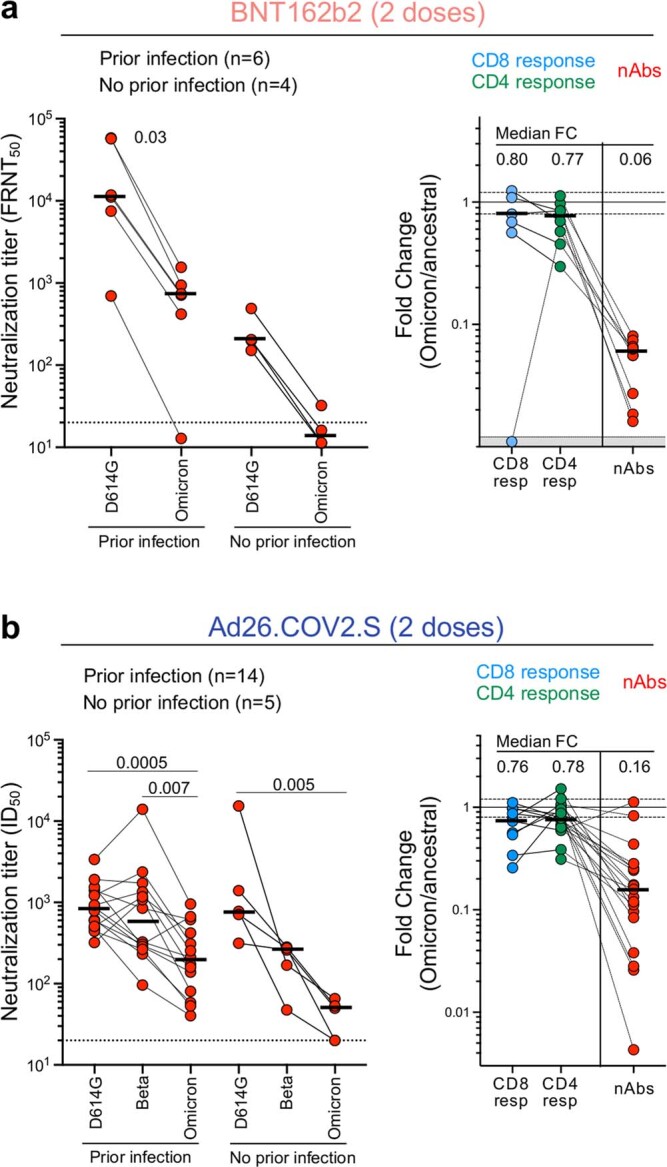
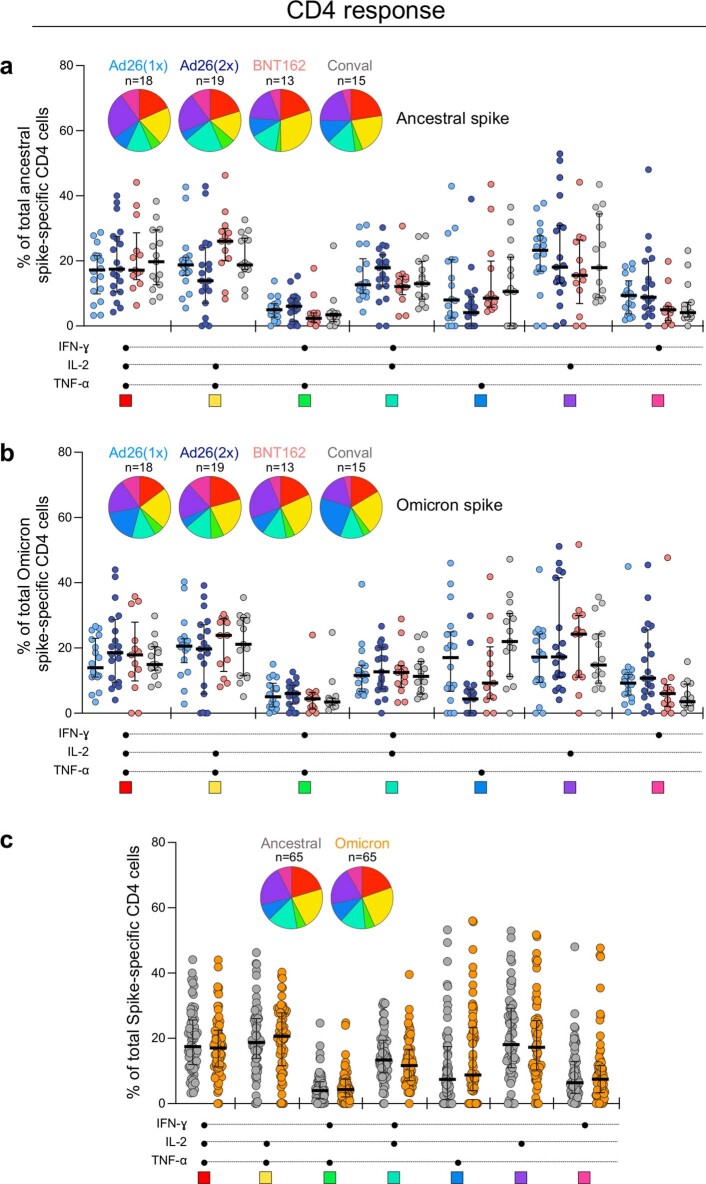
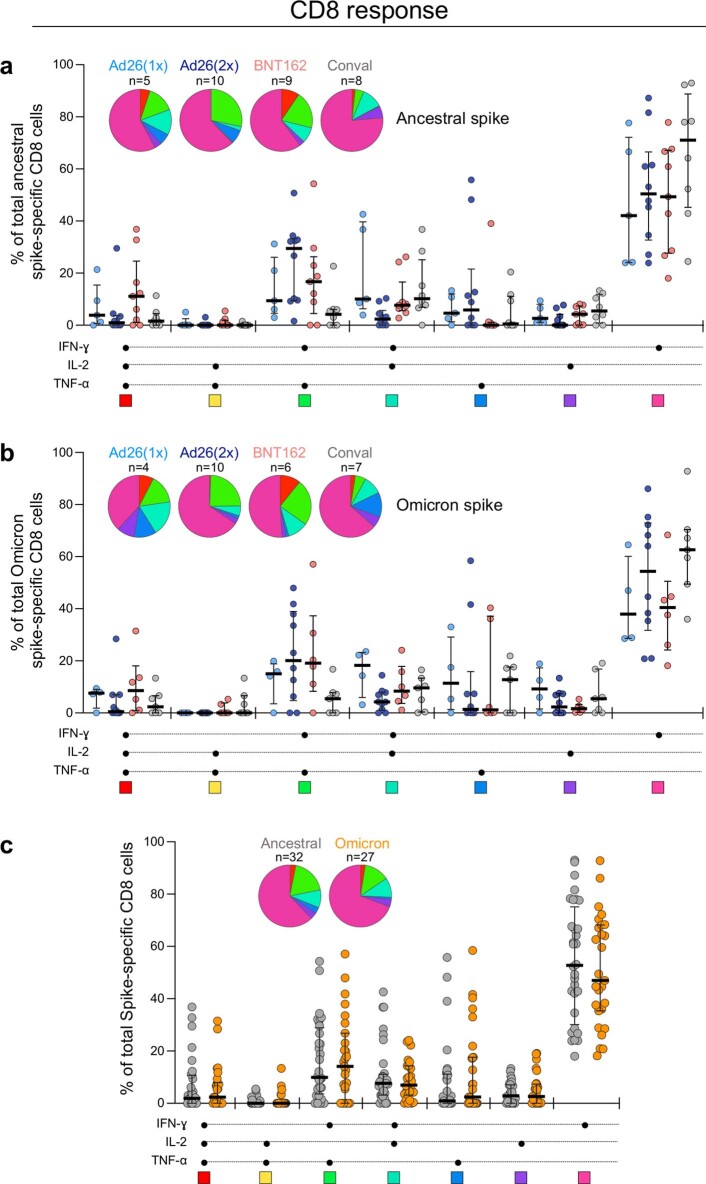
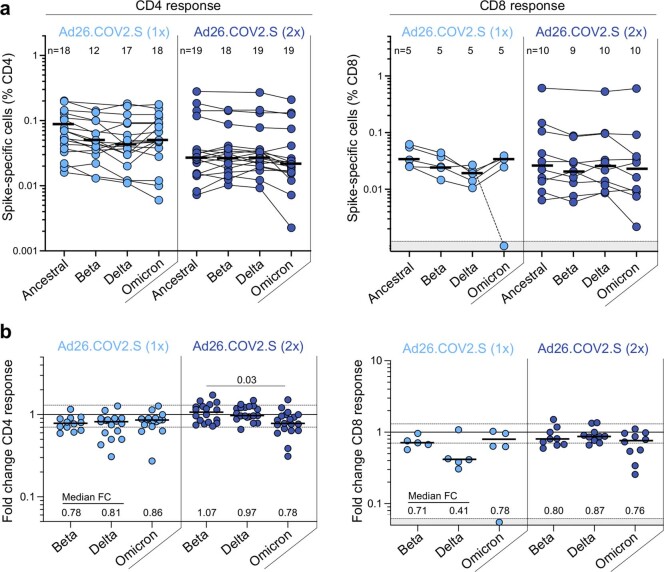
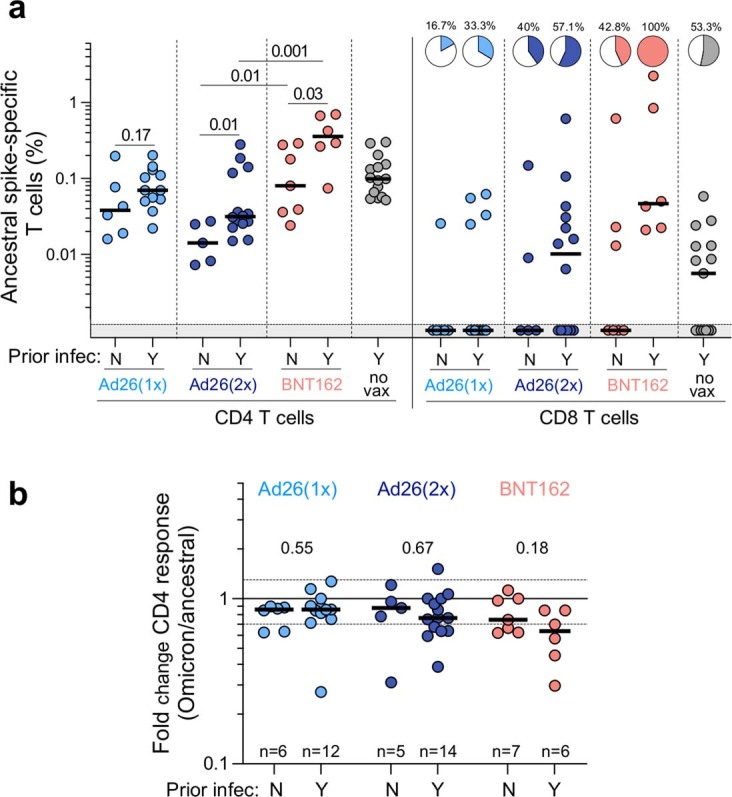
The SARS-CoV-2 Omicron variant (B.1.1.529) has multiple spike protein mutations1,2 that contribute to viral escape from antibody neutralization3-6 and reduce vaccine protection from infection7,8. The extent to which other components of the adaptive response such as T cells may still target Omicron and contribute to protection from severe outcomes is unknown. Here we assessed the ability of T cells to react to Omicron spike protein in participants who were vaccinated with Ad26.CoV2.S or BNT162b2, or unvaccinated convalescent COVID-19 patients (n = 70). Between 70% and 80% of the CD4+ and CD8+ T cell response to spike was maintained across study groups. Moreover, the magnitude of Omicron cross-reactive T cells was similar for Beta (B.1.351) and Delta (B.1.617.2) variants, despite Omicron harbouring considerably more mutations. In patients who were hospitalized with Omicron infections (n = 19), there were comparable T cell responses to ancestral spike, nucleocapsid and membrane proteins to those in patients hospitalized in previous waves dominated by the ancestral, Beta or Delta variants (n = 49). Thus, despite extensive mutations and reduced susceptibility to neutralizing antibodies of Omicron, the majority of T cell responses induced by vaccination or infection cross-recognize the variant. It remains to be determined whether well-preserved T cell immunity to Omicron contributes to protection from severe COVID-19 and is linked to early clinical observations from South Africa and elsewhere9-12.


Conflict of interest statement

A. Sette is a consultant for Gritstone Bio, Flow Pharma, Arcturus Therapeutics, ImmunoScape, CellCarta, Avalia, Moderna, Fortress and Repertoire. All of the other authors declare no competing interests. La Jolla Institute for Immunology has filed a patent for protection for various aspects of vaccine design and identification of specific epitopes.

Figures

Fig. 1
Fig. 1. T cell response to the ancestral and Omicron SARS-CoV-2 spike after vaccination and in unvaccinated COVID-19 convalescent patients.
a, Clinical characteristics of the study groups. *Data from after Covid-19 infection were available for only 6 out of the 13 participants who received one dose of Ad26.COV2.S. b, The proportion of participants exhibiting an ancestral spike-specific CD4+ T cell response after vaccination with one or two doses of Ad26.COV2.S or two doses of BNT162b2. c, The profile of the ancestral spike-specific T cell response in vaccinees and convalescent (conval) individuals. d, Representative examples of IFN-γ production in response to ancestral and Omicron spike in two individuals who received two doses of Ad26.COV2.S. e, g, Frequency of spike-specific CD4+ (e) and CD8+ T cells (g) producing any of the measured cytokines (IFN-γ, IL-2 or TNF) in response to peptide pools representing ancestral and Omicron spike protein. Bars represent the median of responders. Differences between SARS-CoV-2 variants were calculated using a two-tailed Wilcoxon paired test. f, h, Fold change in the frequency of spike-specific CD4+ (f) and CD8+ T cells (h) between ancestral and Omicron spike responses. Bars represent medians. No significant differences were observed between groups using a Kruskal–Wallis test with Dunn´s multiple comparisons post test. The number of participants included in each analysis is indicated on the graphs. Source Data
Fig. 2
Fig. 2. T cell response to ancestral SARS-CoV-2 in unvaccinated hospitalized patients with COVID-19 who were infected with the ancestral, Beta, Delta or Omicron SARS-CoV-2 variants.
a, Clinical characteristics of the study groups. Severe disease was defined on the basis of oxygen therapy requirement according to the WHO ordinal scale scoring system (≥5; O2 via high flow to extracorporeal membrane oxygenation). b, SARS-CoV-2 epidemiological dynamics in South Africa showing the prevalence of different SARS-CoV-2 strains (based on 24,762 sequences; left axis) and the number of COVID-19 cases (right axis). The bars on the top of the graph indicate the periods when samples were collected for each epidemic wave. c, d, Frequency of SARS-CoV-2-specific CD4+ (c) and CD8+ T cells (d) producing any of the measured cytokines (IFN-γ, IL-2 or TNF) in response to ancestral SARS-CoV-2 spike (S), nucleocapsid (N) and membrane (M) peptide pools. Pies depict the proportion of participants exhibiting a detectable T cell response to each protein. e, Comparison of T cell response to ancestral or Omicron spike in Omicron-infected patients. Bars represent medians of responders. No significant differences were observed between antigens amongst responders using a Kruskal–Wallis test with Dunn’s multiple comparisons post test. The number of participants included in each analysis is indicated on the graphs. Source Data
Extended Data Fig. 1
Extended Data Fig. 1. Gating strategy and examples of flow cytometry plots.
a, Gating strategy and representative examples of SARS-CoV-2 spike-specific IFN-γ, IL-2 and TNF-α production. b, Spike-specific expression of IFN-γ in the T cell compartment of the three BNT162b2-vaccinated participants where Omicron-specific CD8+ T cells were undetectable.
Extended Data Fig. 2
Extended Data Fig. 2. Neutralization of Omicron compared to the ancestral SARS-CoV-2 (D614G) by plasma from participants vaccinated with two doses of BNT162b2 or Ad26.COV2.S.
a, Neutralization by BNT162b2 plasma (n = 10), 6 with prior COVID-19 infection and 4 without) was performed using a live virus neutralization assay. The reciprocal plasma dilution (FRNT50) resulting in 50% reduction in the number of infection foci is reported. The threshold of detection was set at a FRNT50 of 20. A two-tailed paired Wilcoxon test was used to compare ancestral and Omicron titers. Comparison of the fold change in SARS-CoV-2-specific CD8+ and CD4+ T cell responses and neutralization titers (Omicron/ancestral) is depicted in the right panel. Bars represent medians. b, Neutralization against ancestral, Beta and Omicron variants by plasma from Ad26.COV2.S vaccinees (two doses; n = 19), including 14 with prior COVID-19 infection and 5 without, was performed using a SARS-CoV-2 pseudovirus-based neutralization assay. The threshold of detection was a 50% inhibitory dilution (ID50) of 20. A Friedman test with Dunn´s multiple comparisons post-test was used to compare the titers of the three variants tested. Comparison of the fold change in SARS-CoV-2-specific CD8+ and CD4+ T cell response and neutralization titers (Omicron/ancestral) is depicted in the right panel. Bars represent medians. Source Data
Extended Data Fig. 3
Extended Data Fig. 3. Polyfunctional profiles of SARS-CoV-2-specific CD4+ T cells after vaccination and in unvaccinated convalescent volunteers.
a, b, Comparison of the polyfunctional profile of ancestral (a) and Omicron (b) spike-specific CD4+ T cells between the four groups (Ad26.COV2.S-one dose, Ad26.COV.S-two doses, BNT162b2-two doses and unvaccinated convalescent volunteers). c, Comparison of the polyfunctional profile between ancestral and Omicron spike-specific CD4+ T cells including all CD4+ T cell responding participants, irrespective of their clinical grouping. The medians and IQR are shown. Each response pattern (i.e., any possible combination of IFN-γ, IL-2 or TNF-α expression) is color‐coded, and data are summarized in the pie charts. No significant differences were observed between pies using a permutation test. The number of participants included in each analysis is indicated on the graphs. Source Data
Extended Data Fig. 4
Extended Data Fig. 4. Polyfunctional profiles of SARS-CoV-2-specific CD8+ T cells after vaccination and in unvaccinated convalescent volunteers.
a, b, Comparison of the polyfunctional profile of ancestral (a) and Omicron (b) spike-specific CD8+ T cells between the four groups (Ad26.COV2.S-one dose, Ad26.COV2.S-two doses, BNT162b2-two doses and unvaccinated convalescent COVID-19 volunteers). c, Comparison of the polyfunctional profile between ancestral spike and Omicron spike-specific CD8+ T cells including all CD8+ T cell responding participants, irrespective of their clinical grouping. The medians and IQR are shown. Each response pattern (i.e., any possible combination of IFN-γ, IL-2 or TNF-α expression) is color‐coded, and data are summarized in the pie charts. No significant differences were observed between pies using a permutation test. The number of participants included in each analysis is indicated on the graphs. Source Data
Extended Data Fig. 5
Extended Data Fig. 5. T cell responses to the ancestral, Beta, Delta and Omicron SARS-CoV-2 spike in participants who received Ad26.COV2.S (one or two doses).
a, Frequency of spike-specific CD4+ (left panel) and CD8+ T cells (right panel) producing any of the measured cytokines (IFN-γ, IL-2 or TNF-α) in response to ancestral, Beta, Delta and Omicron spike peptide pools. Bars represent median of responders. No significant differences were observed between variants using a Kruskal-Wallis test with Dunn´s multiple comparisons post-test. b, Fold change in the frequency of spike-specific CD4+ (left panel) and CD8+ T cells (right panel) between ancestral and Omicron spike responses. Bars represent medians. Differences between SARS-CoV-2 variants were calculated using a Kruskal-Wallis test with Dunn´s multiple comparisons post-test. Median fold changes are indicated at the bottom of each graph. The number of participants included in each analysis is indicated on the graphs. Source Data
Extended Data Fig. 6
Extended Data Fig. 6. Impact of prior COVID-19 infection on T cell responses to the ancestral and Omicron SARS-CoV-2 spike in vaccinated participants.
a, Comparison of the frequency of ancestral spike-specific T cell responses in vaccinated participants who had (Y) or did not have (N) prior SARS-CoV-2 infection. Pies depict the proportion of participants exhibiting a detectable CD8+ T cell response. Bars represent medians. Statistical differences were calculated using a two-tailed Mann-Whitney test. b, Fold change in the frequency of spike-specific CD4+ T cells between ancestral and Omicron spike responses in the three vaccine groups. Bars represent medians. Statistical differences were calculated using a two-tailed Mann-Whitney test. The number of participants included in each analysis is indicated on the graphs. Source Data
Extended Data Fig. 7
Extended Data Fig. 7. Distribution of spike SARS-CoV-2 epitopes targeted by CD4+ and CD8+ T cells.
a, Schematic of SARS-CoV-2 spike protein primary structure colored by domain. NTD: N-terminal domain, RBD: receptor binding domain, SD1: Sub-domain 1, SD2: Sub-domain 2. b, Distribution and frequency of recognition of confirmed CD4+ (top) and CD8+ T cell epitopes (bottom) across the entire spike protein. Data represent experimentally confirmed epitopes from the Immune Epitope Database and Analysis Resource (www.iedb.org). Red lines depict the position of Omicron mutations that recorded a frequency of recognition > 10% and blue lines < 10%. The position of variable epitopes associated with specific HLA-class I (see Extended Data Table 2) is indicated by a triangle. Mutations with a detrimental or neutral impact for HLA binding are depicted in orange and green, respectively. Source Data

References

    1. WHO. Classification of Omicron (B.1.1.529): SARS-CoV-2 variant of concern. https://www.who.int/news/item/26-11-2021-classification-of-omicron-(b.1.... (accessed 22 December 2021).
    1. Viana, R. et al. Rapid epidemic expansion of the SARS-CoV-2 Omicron variant in southern Africa. Nature10.1038/s41586-022-04411-y (2022). - PMC - PubMed
    1. Cameroni, E. et al. Broadly neutralizing antibodies overcome SARS-CoV-2 Omicron antigenic shift. Nature10.1038/s41586-021-04386-2 (2021). - PMC - PubMed
    1. Cao, Y. et al. Omicron escapes the majority of existing SARS-CoV-2 neutralizing antibodies. Nature10.1038/s41586-021-04385-3 (2021). - PMC - PubMed
    1. Cele, S. et al. Omicron extensively but incompletely escapes Pfizer BNT162b2 neutralization. Nature10.1038/s41586-021-04387-1 (2021). - PMC - PubMed

Publication types

Substances

Supplementary concepts