. 2022 Feb;23(2):251-261.
doi: 10.1038/s41590-021-01110-0. Epub 2022 Jan 31.

Group 3 innate lymphoid cells produce the growth factor HB-EGF to protect the intestine from TNF-mediated inflammation

Affiliations

Group 3 innate lymphoid cells produce the growth factor HB-EGF to protect the intestine from TNF-mediated inflammation

Lei Zhou et al. Nat Immunol. 2022 Feb.

Abstract

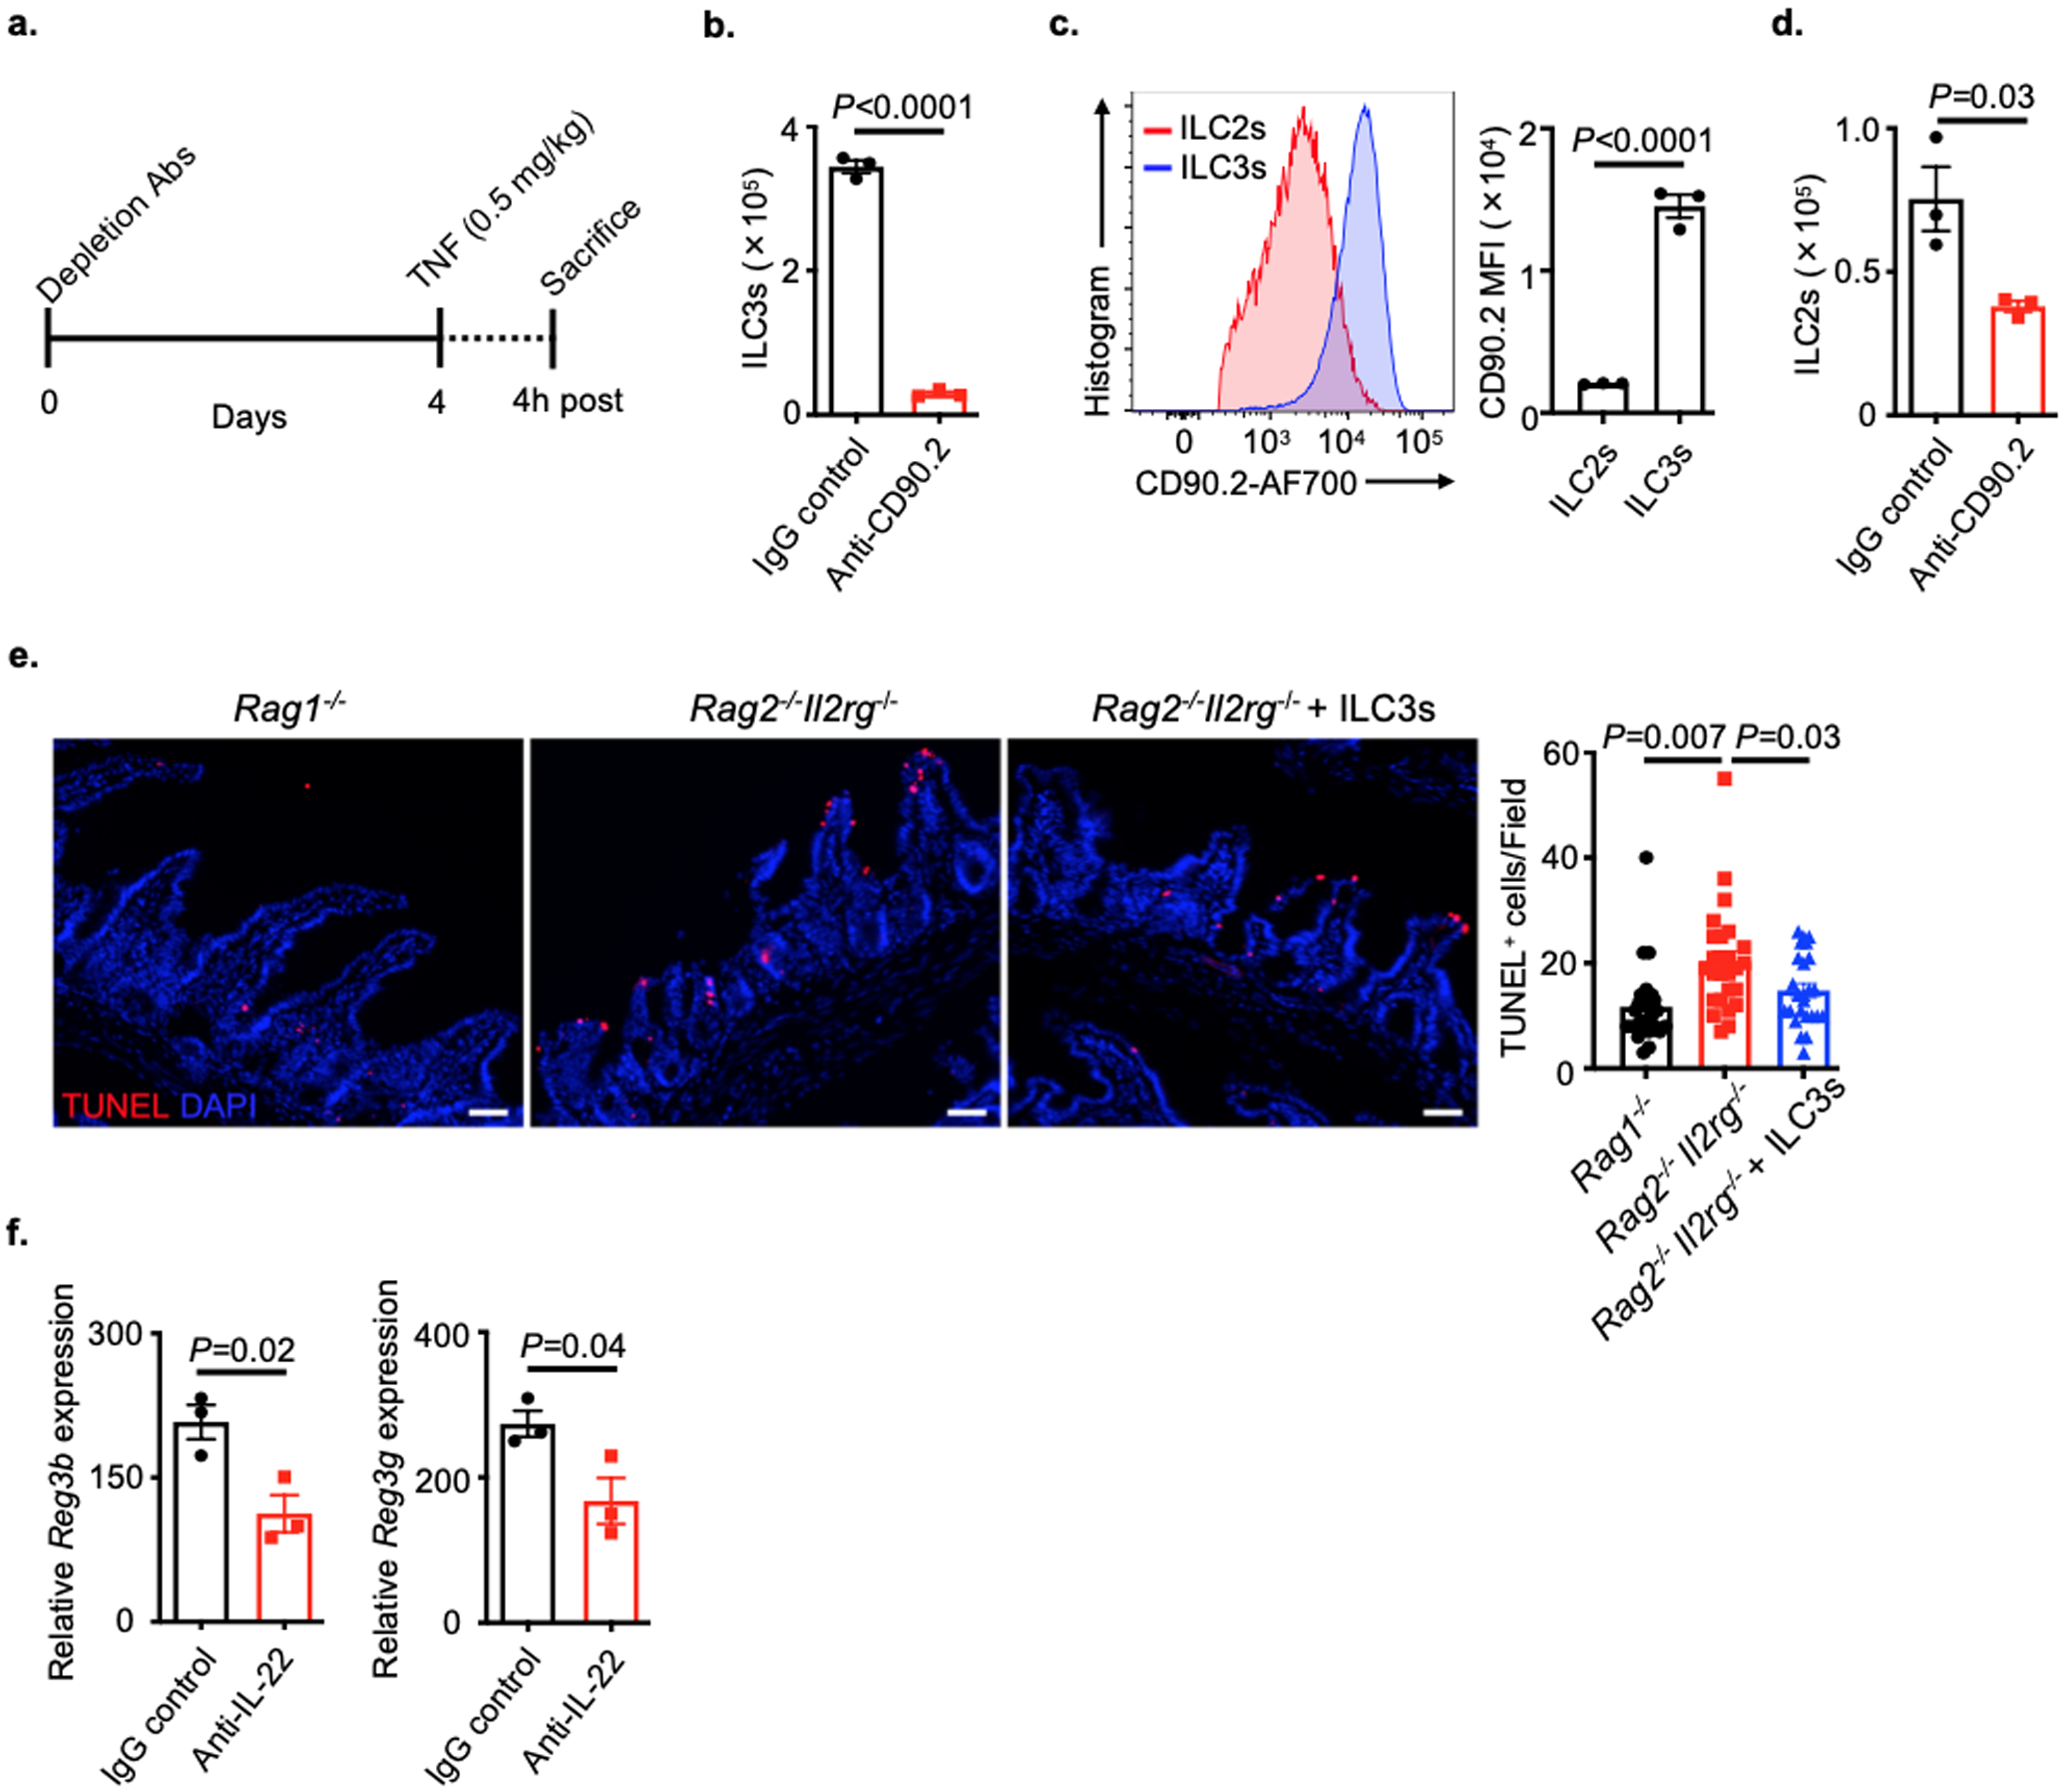
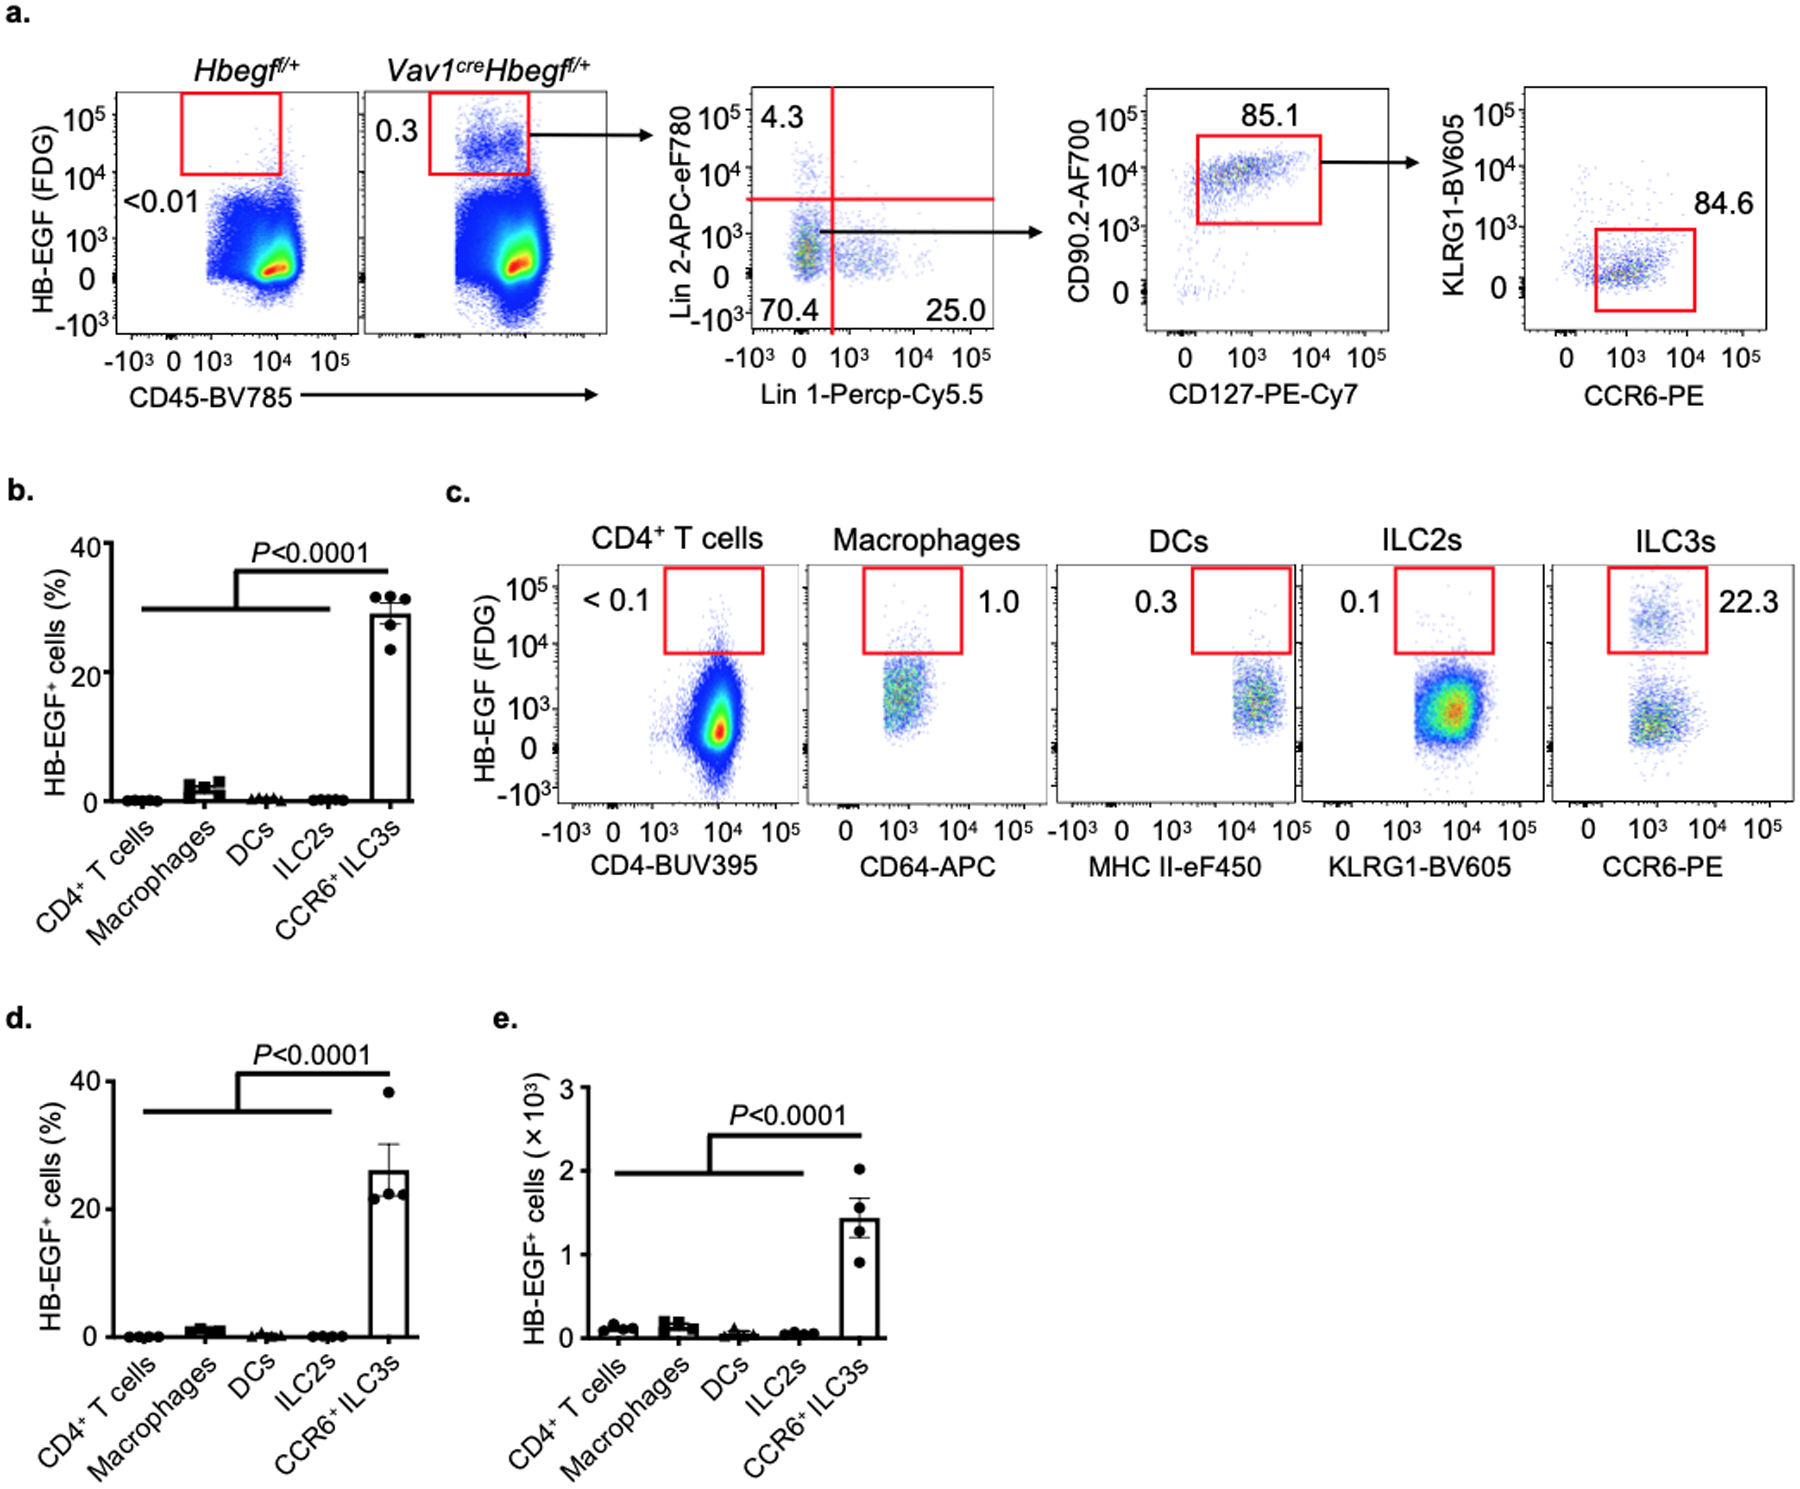
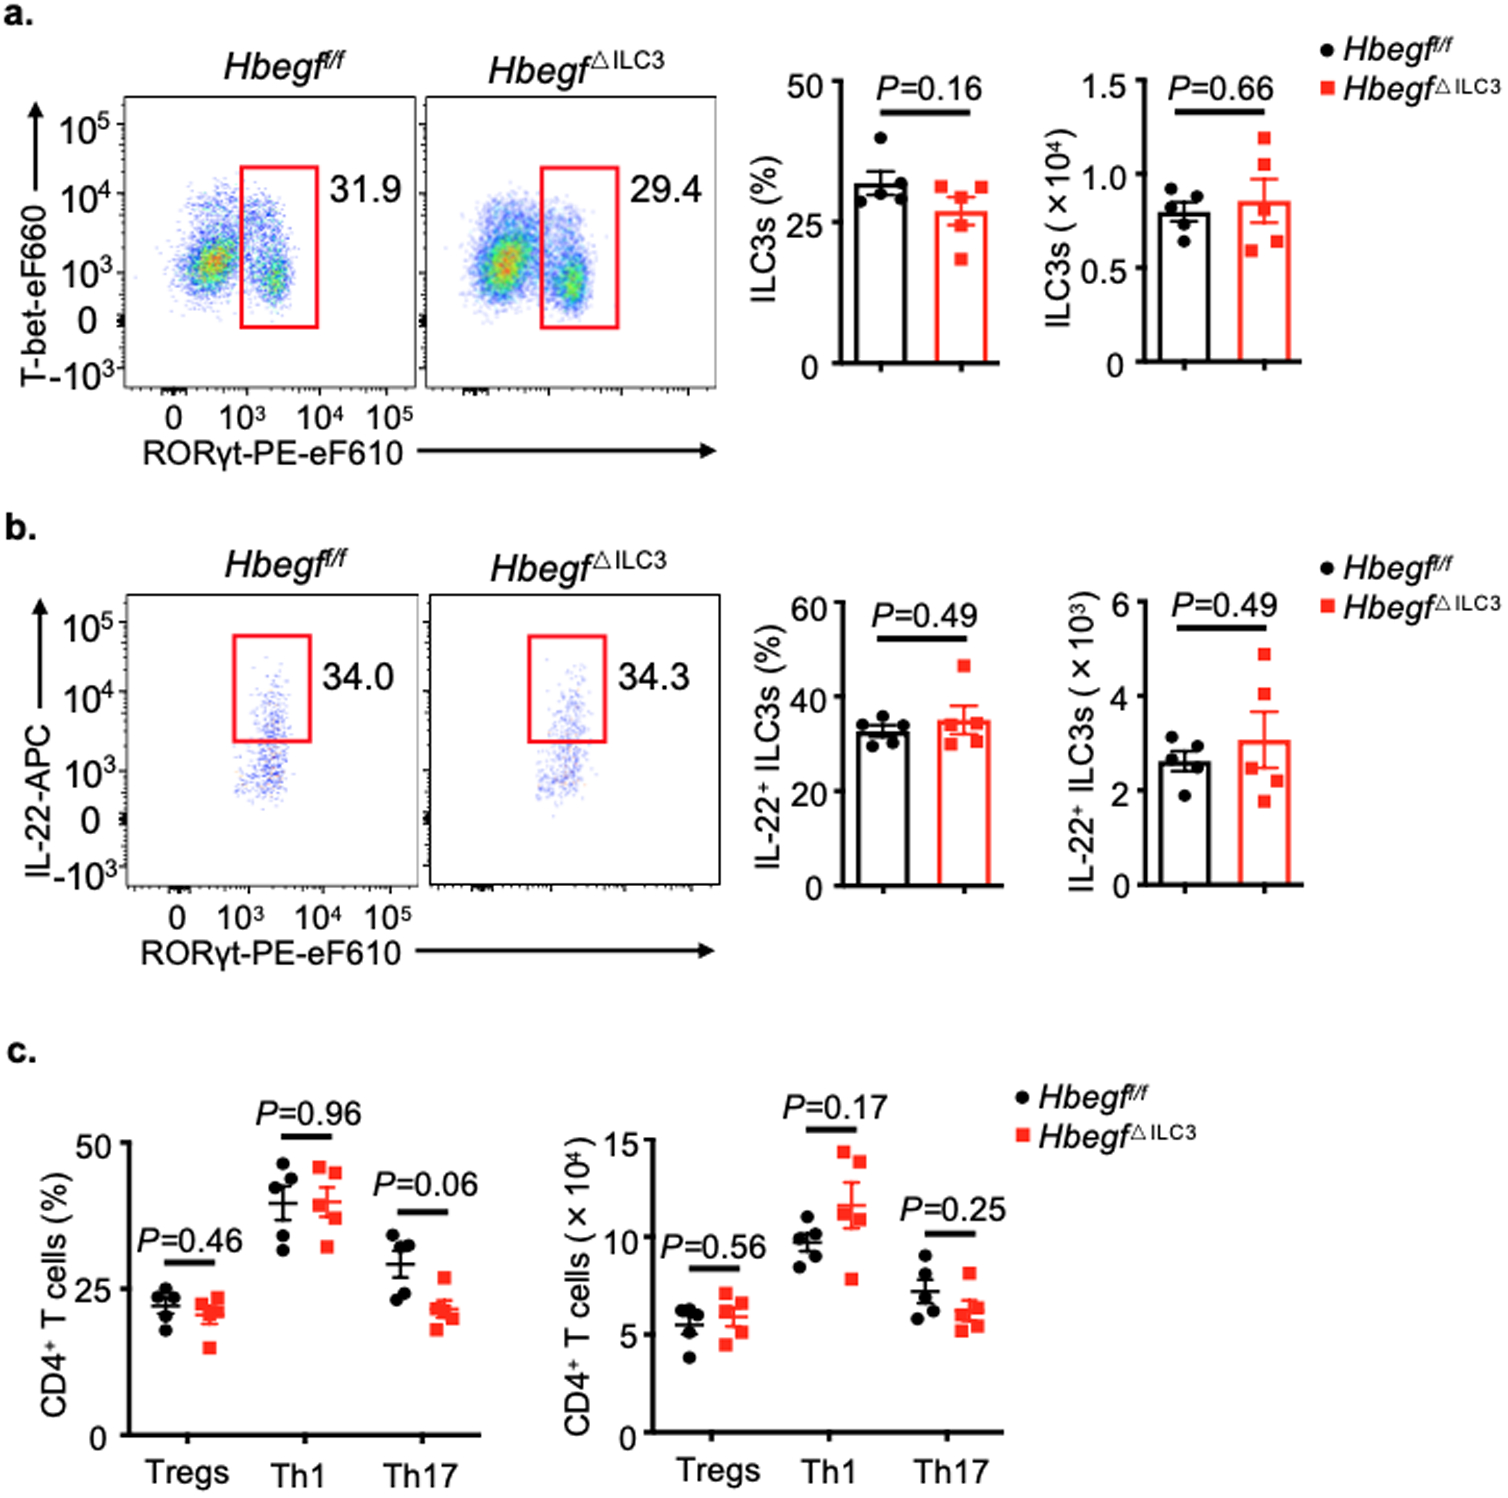
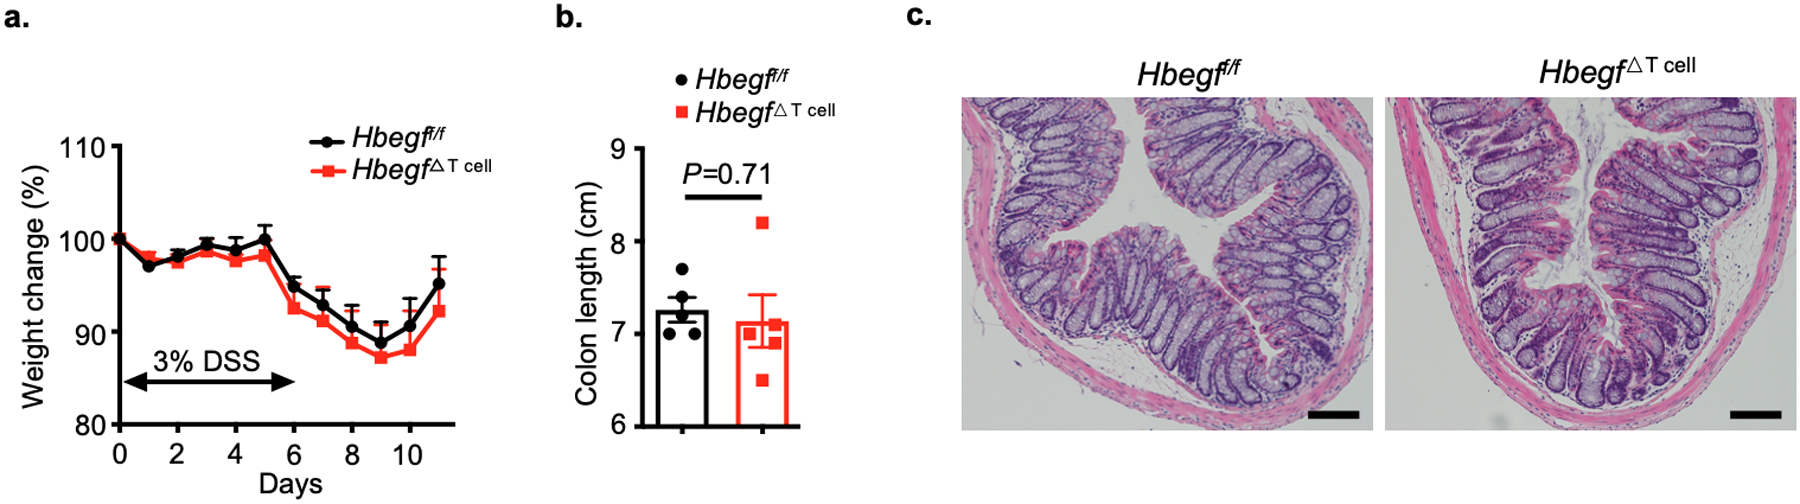
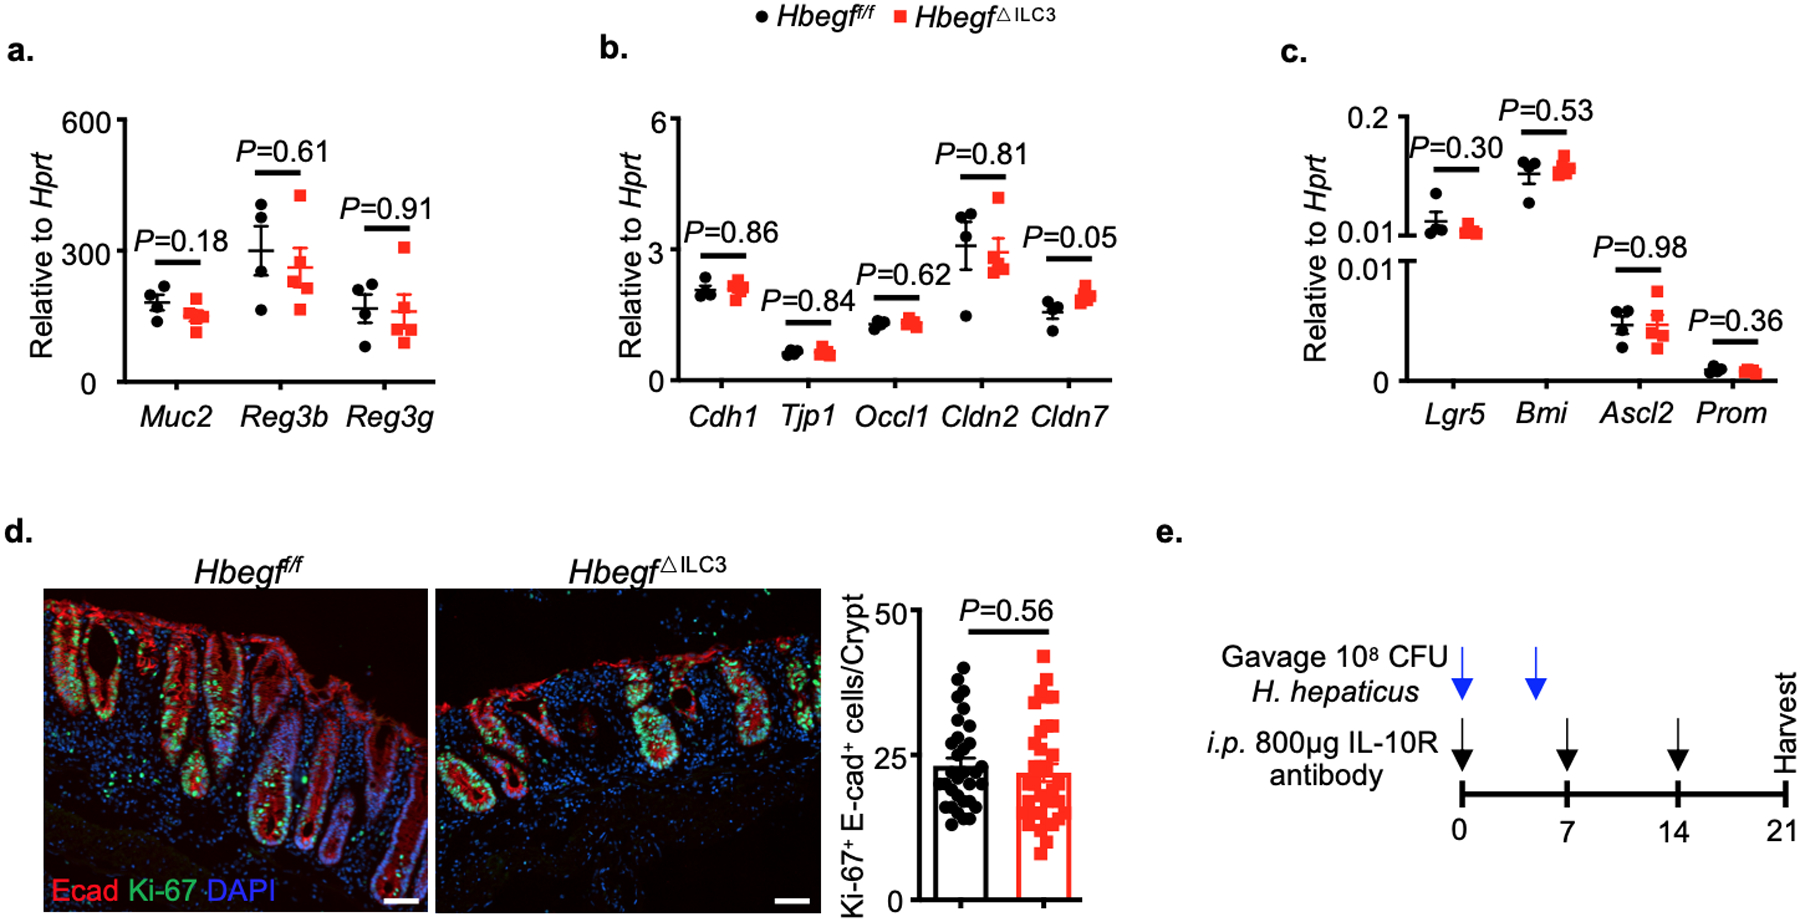
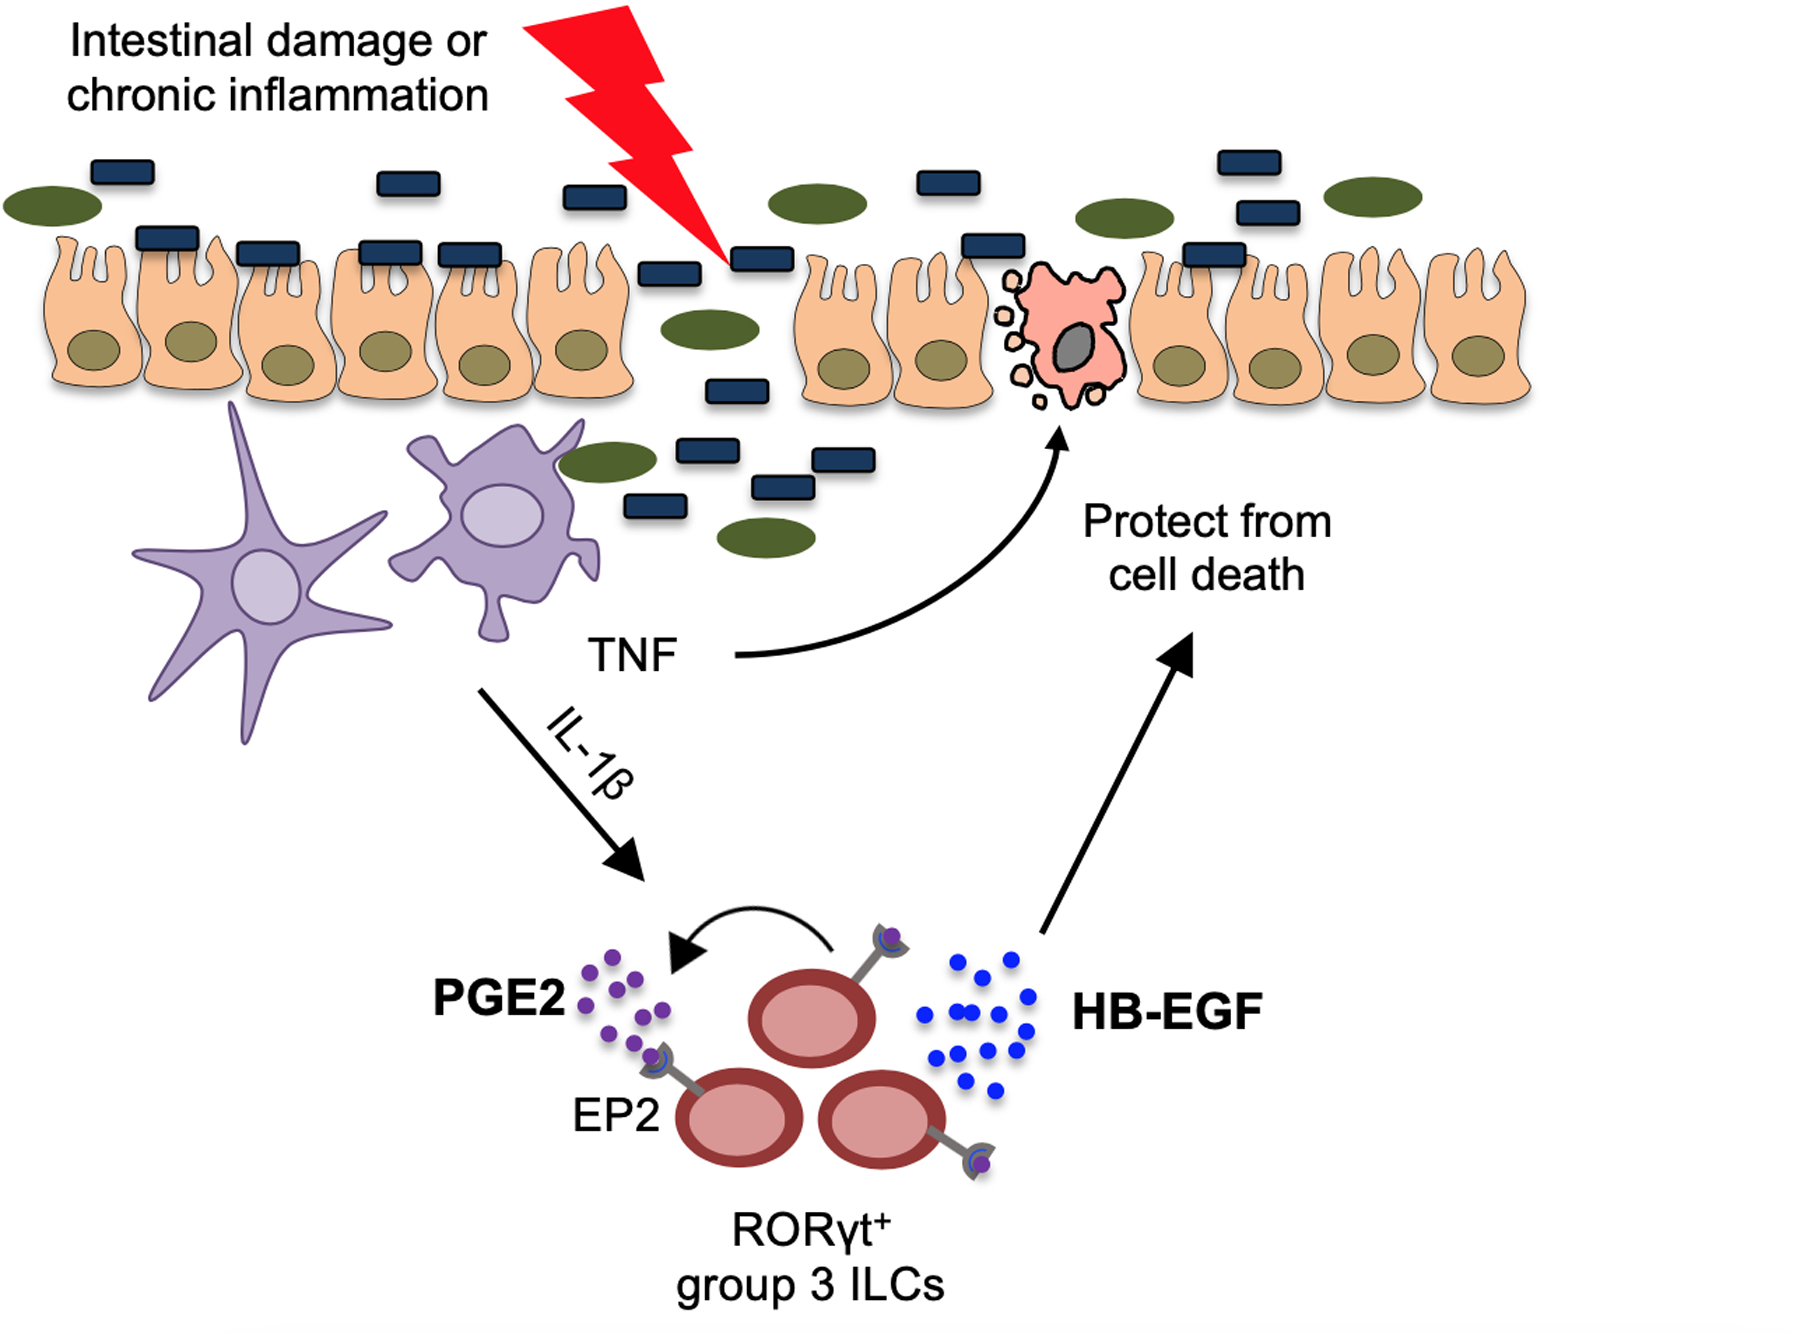
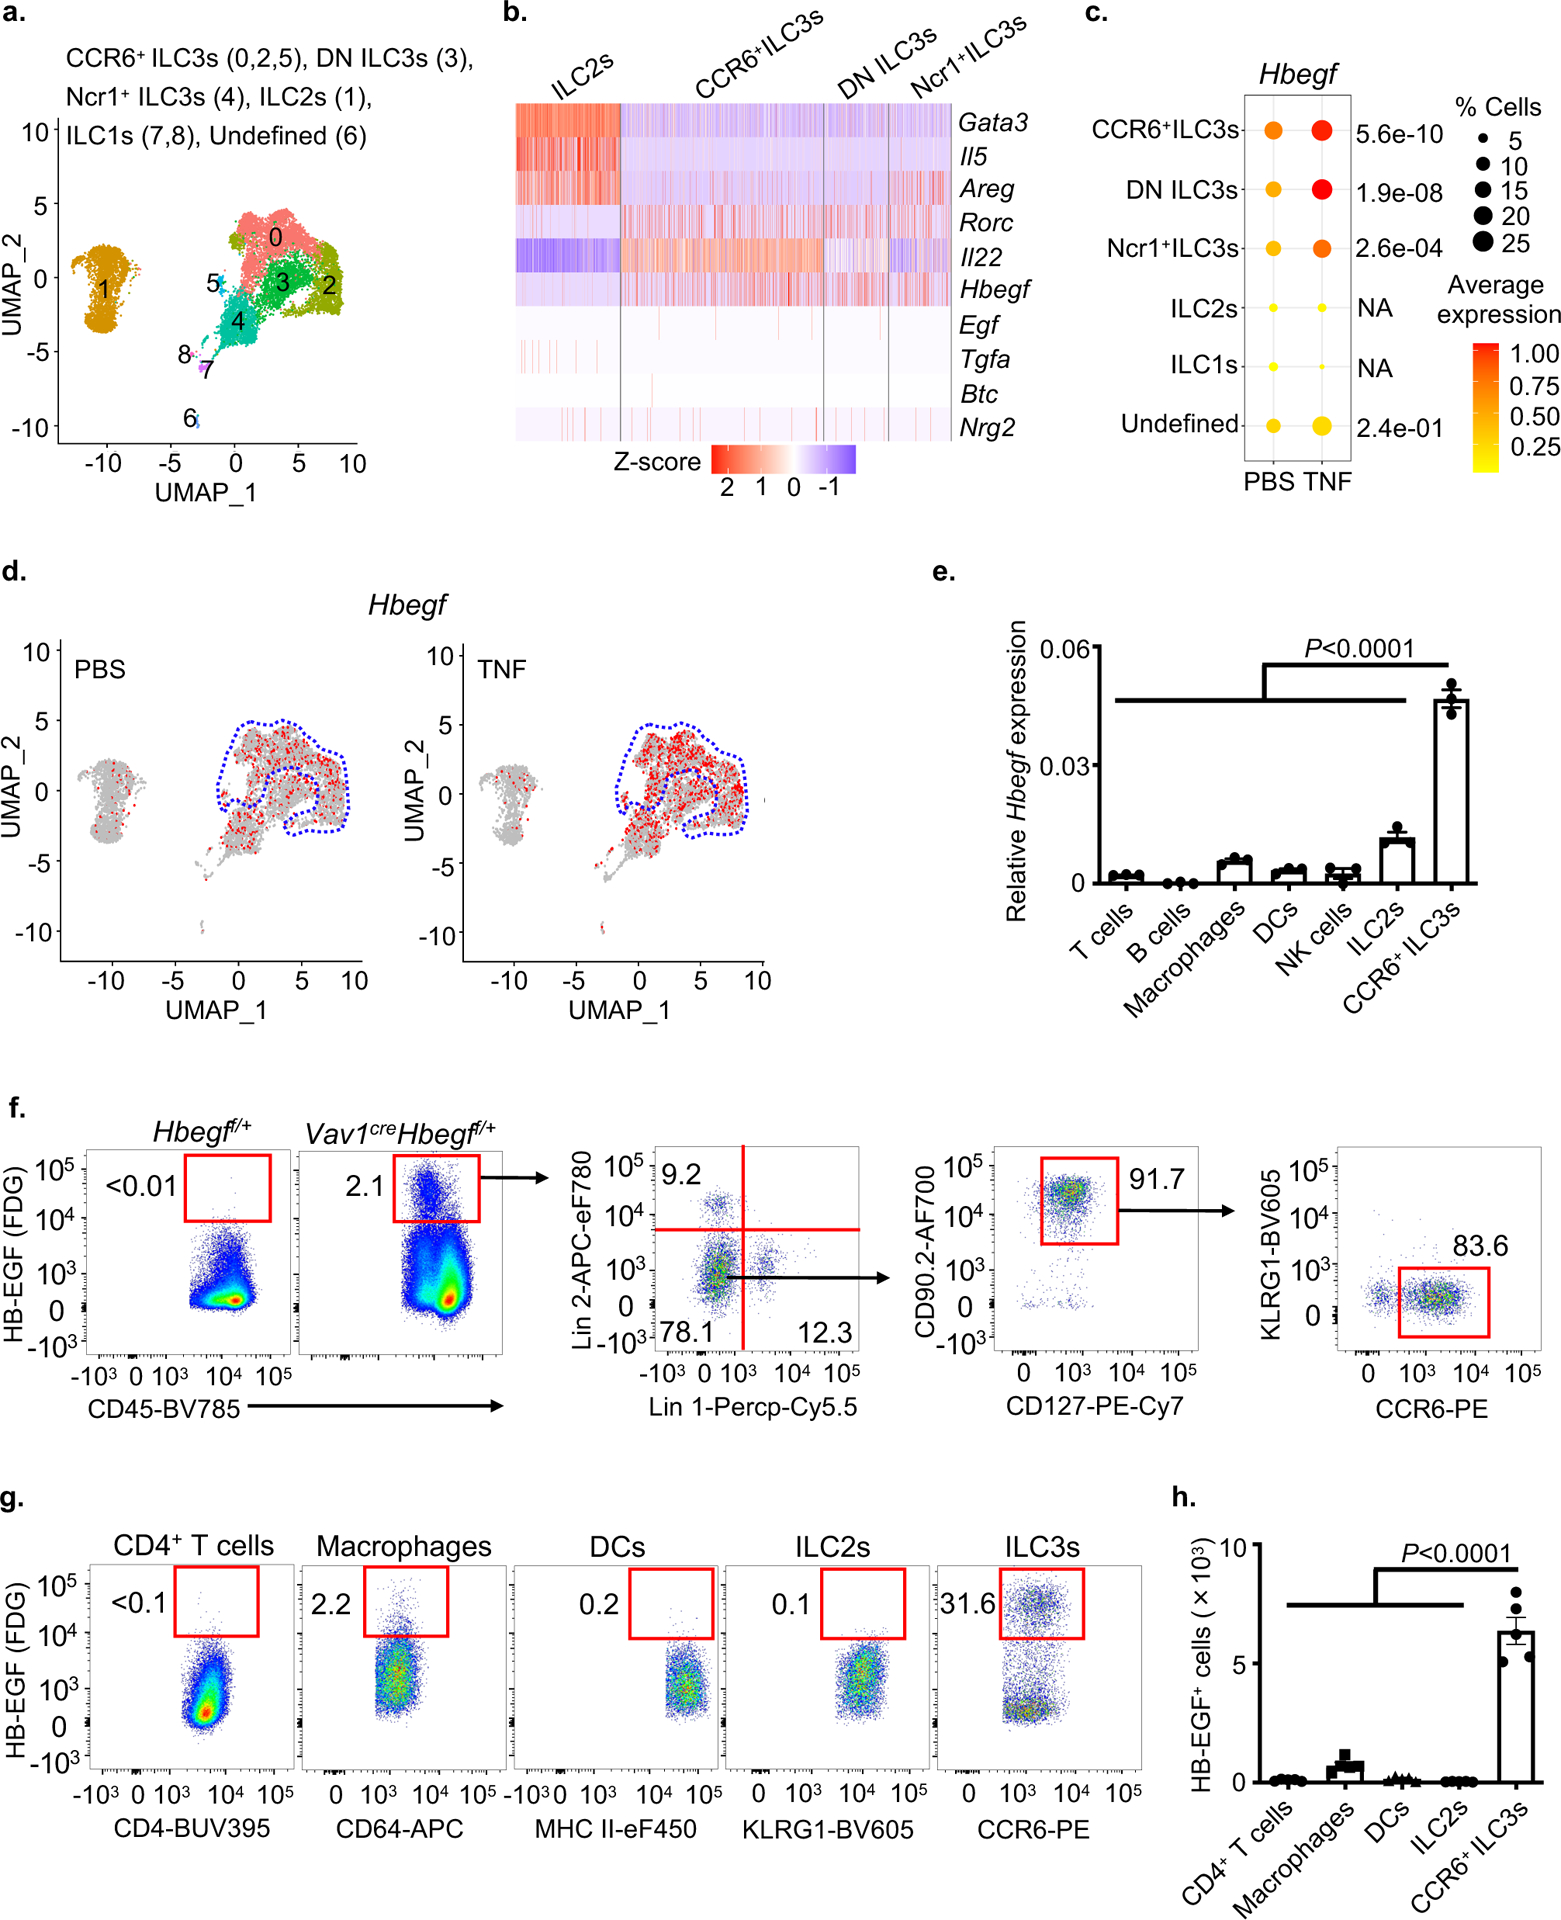
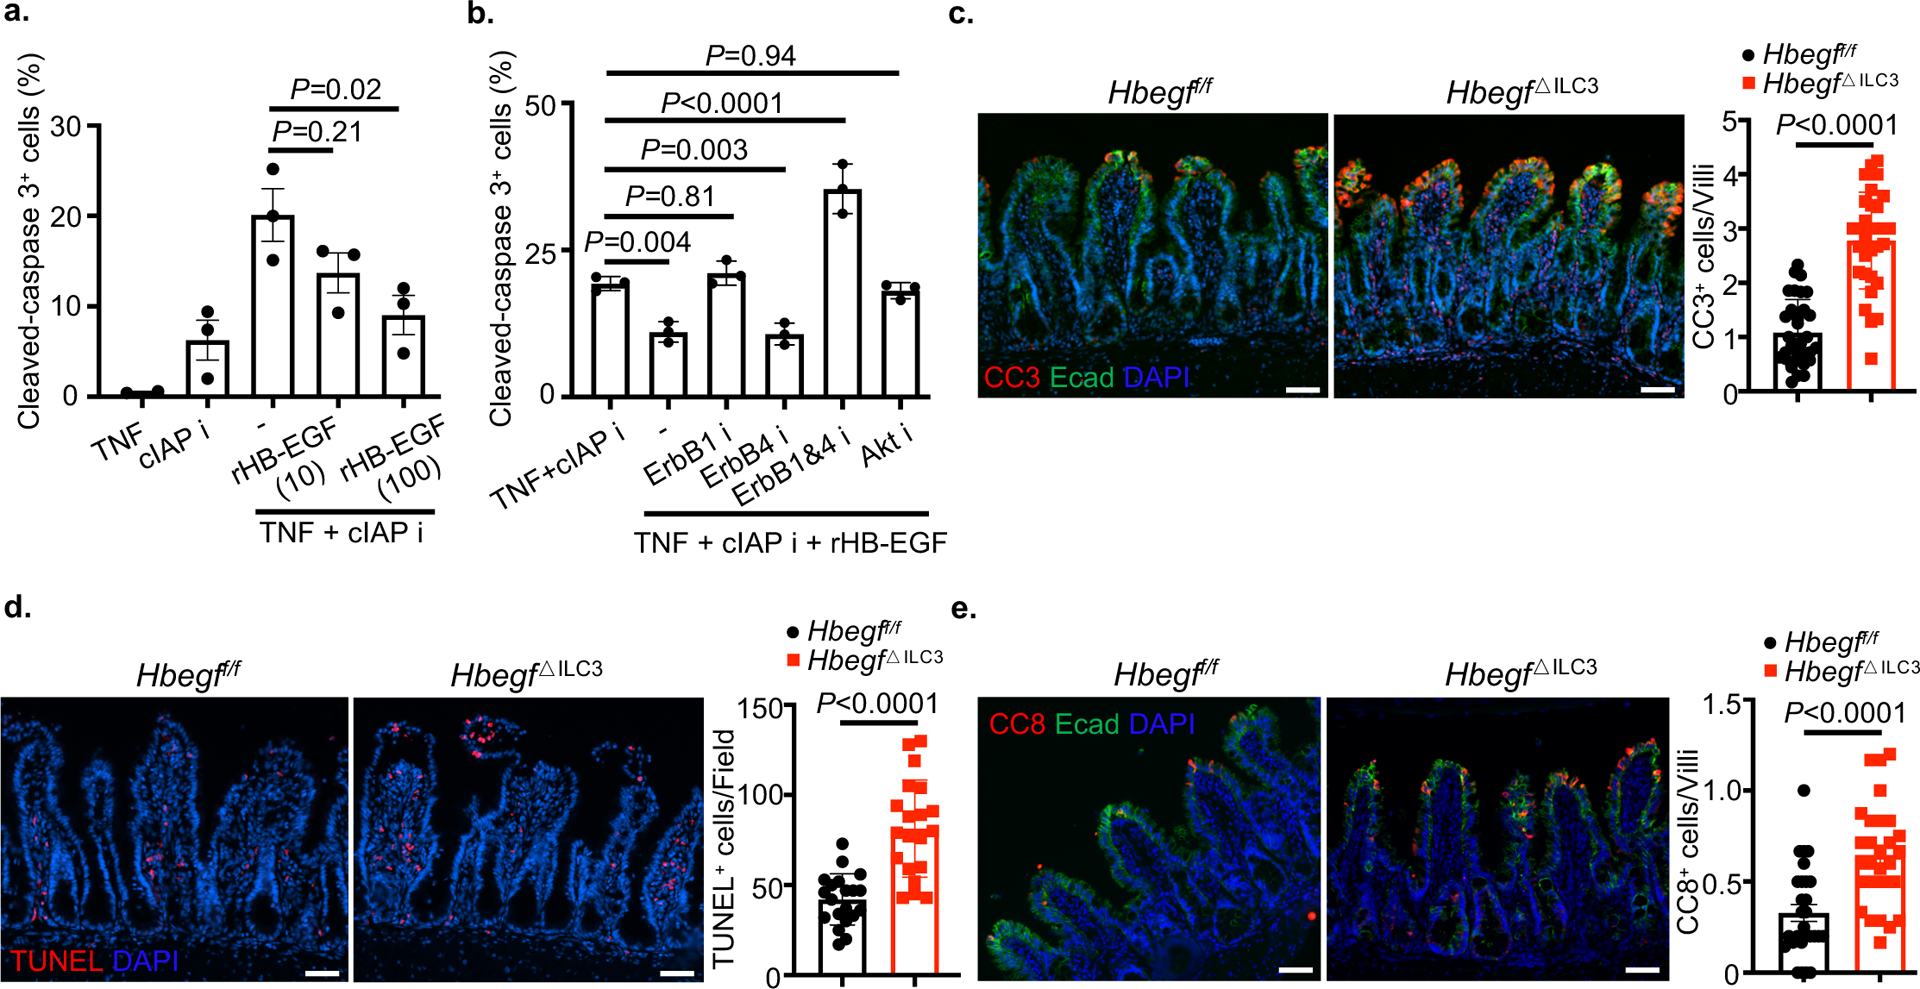
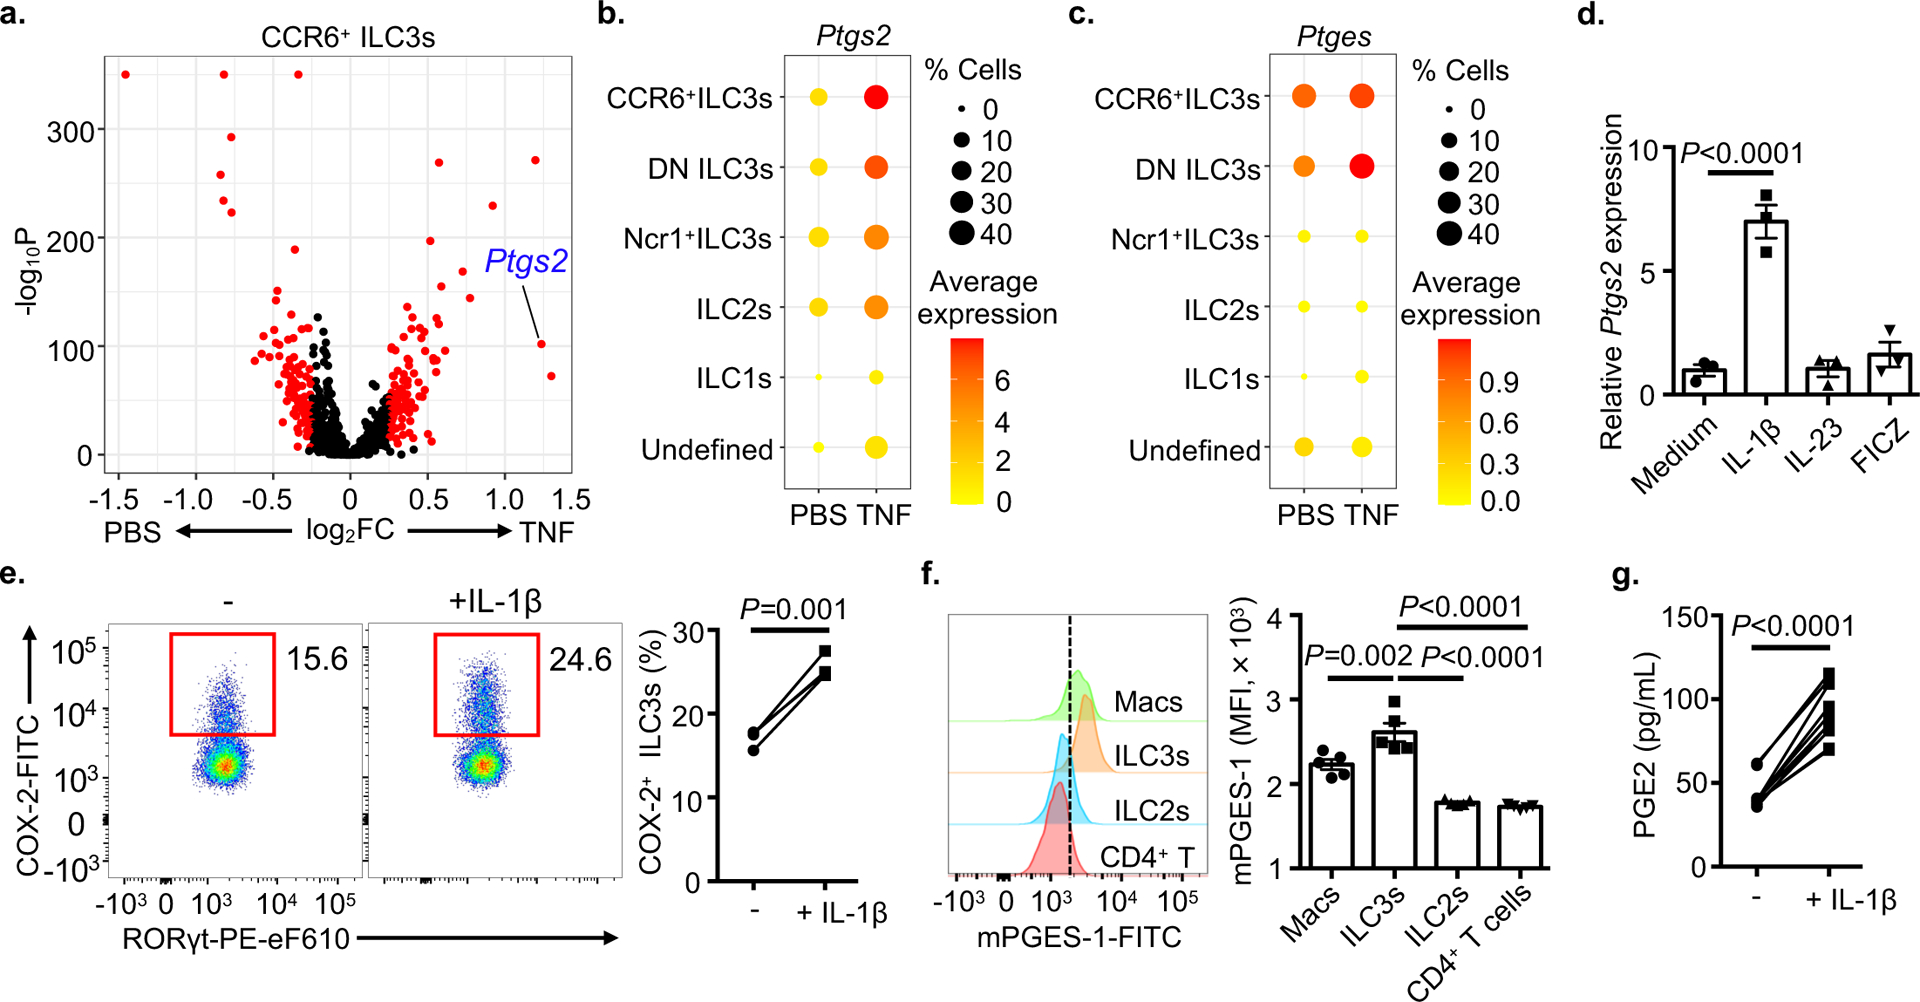
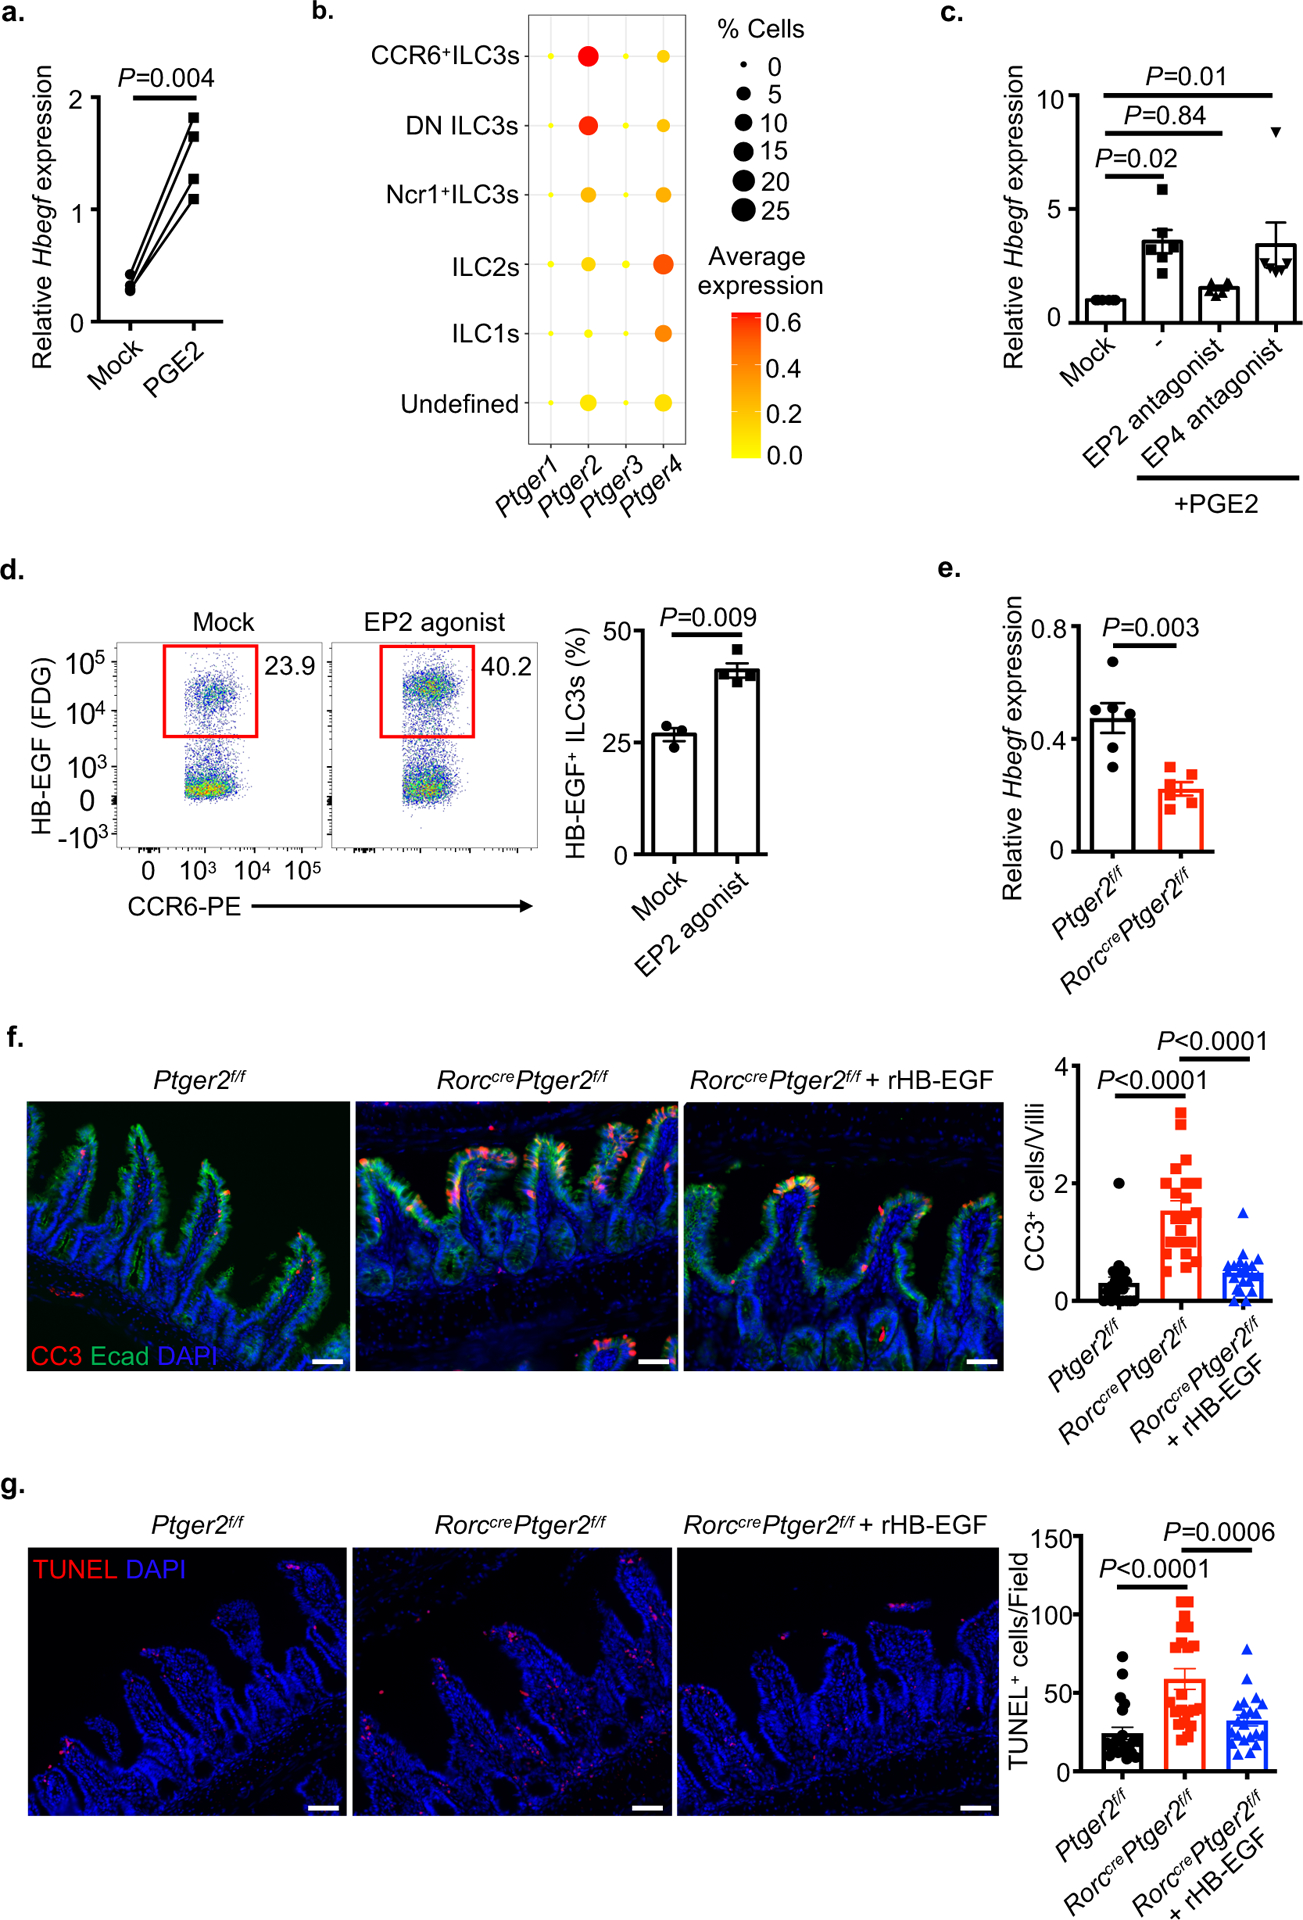
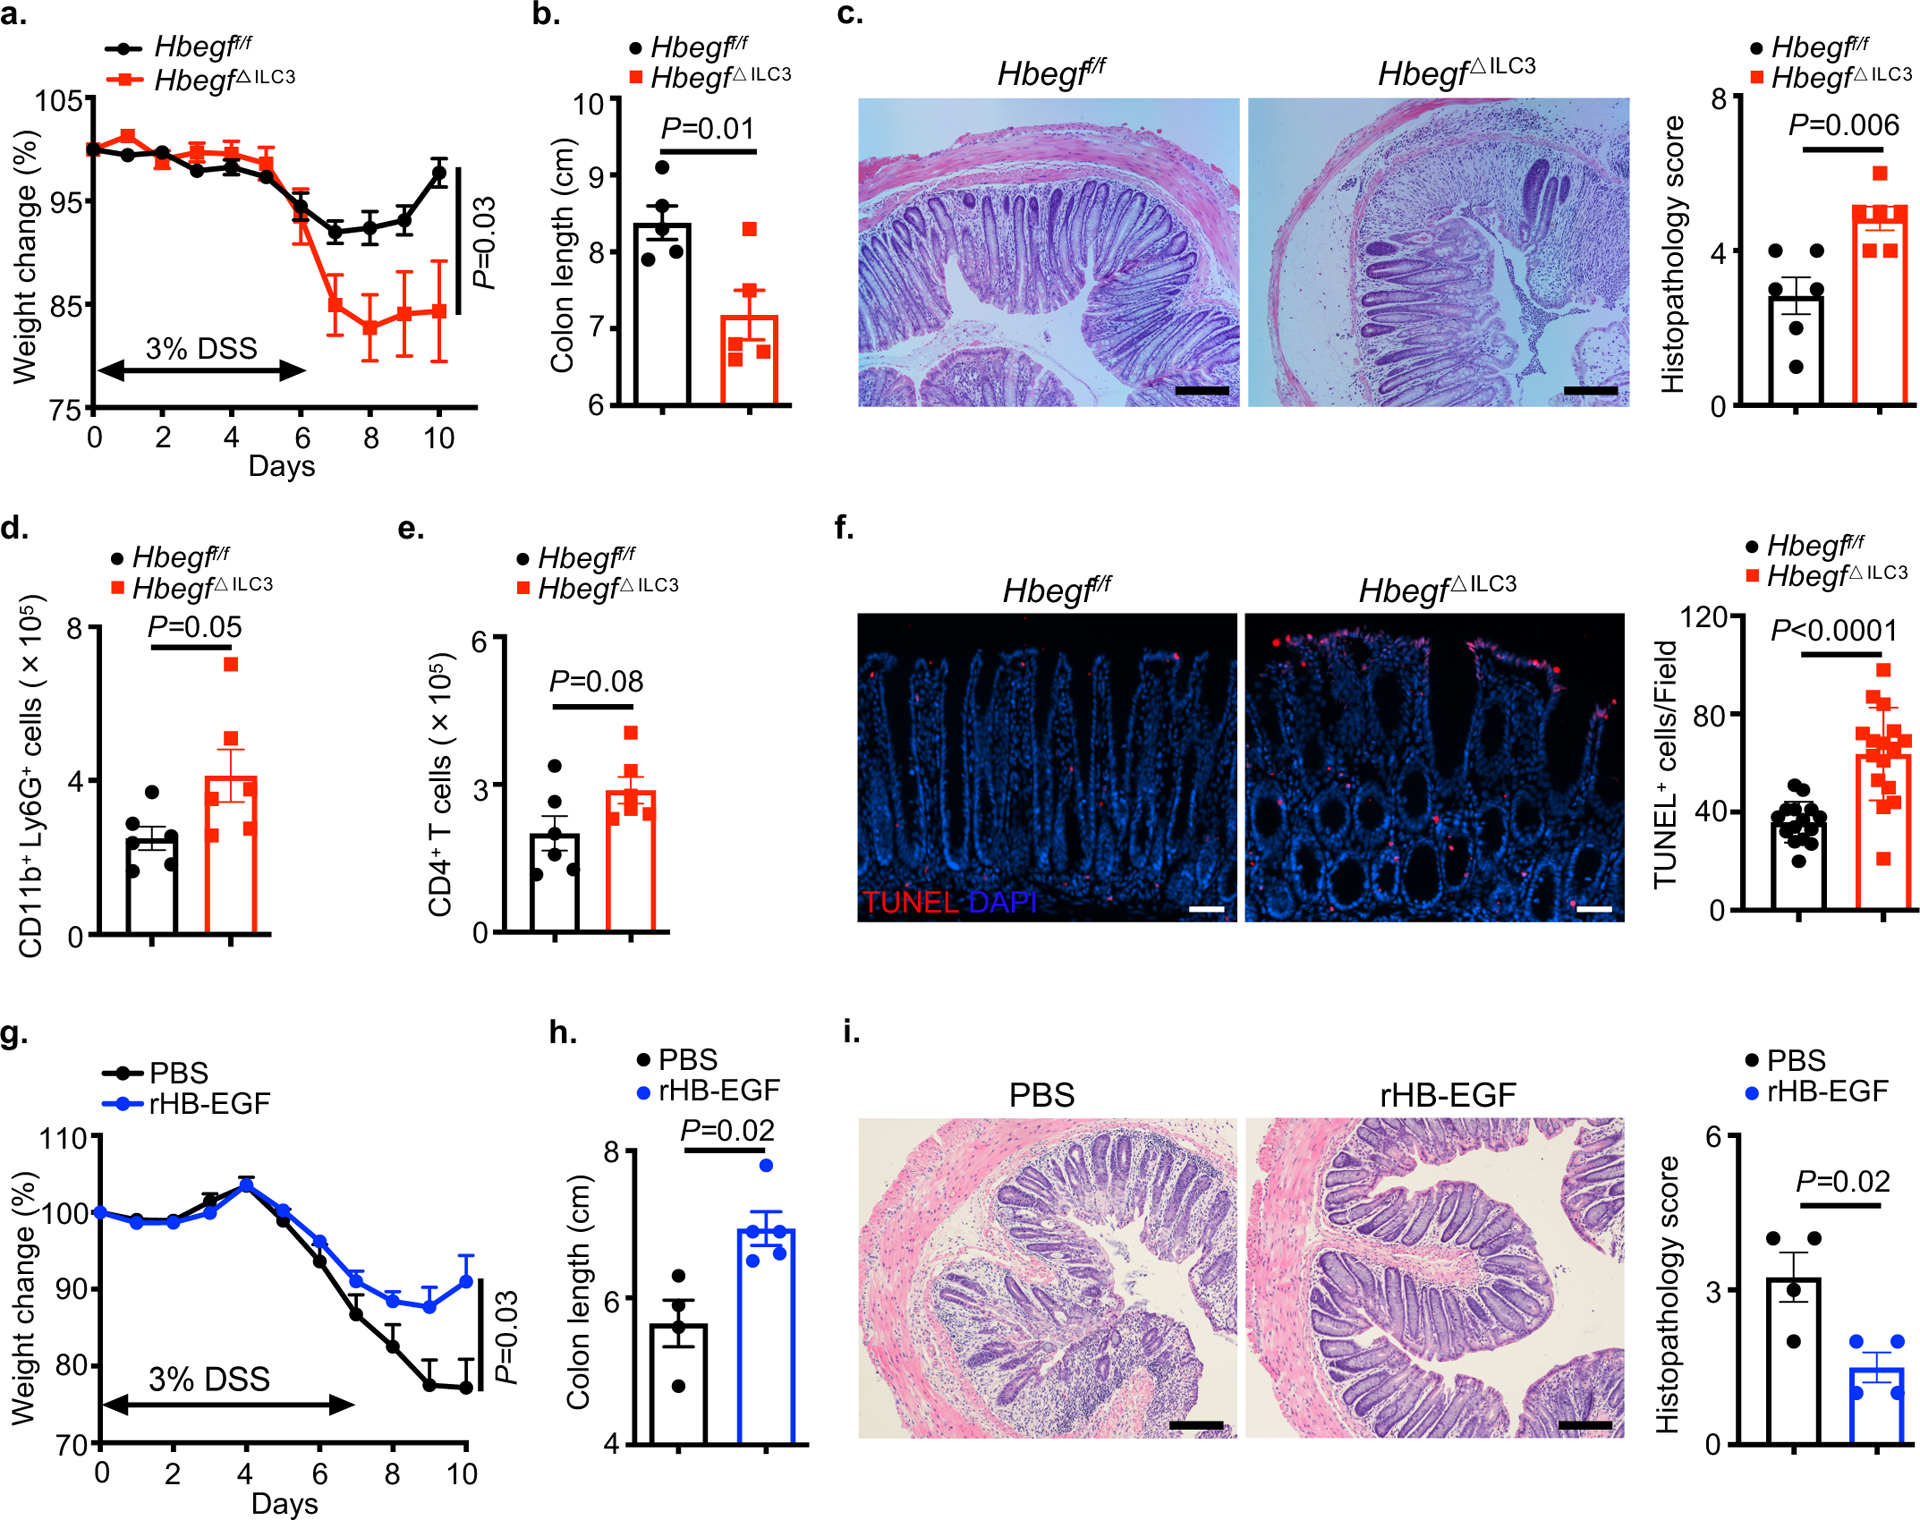
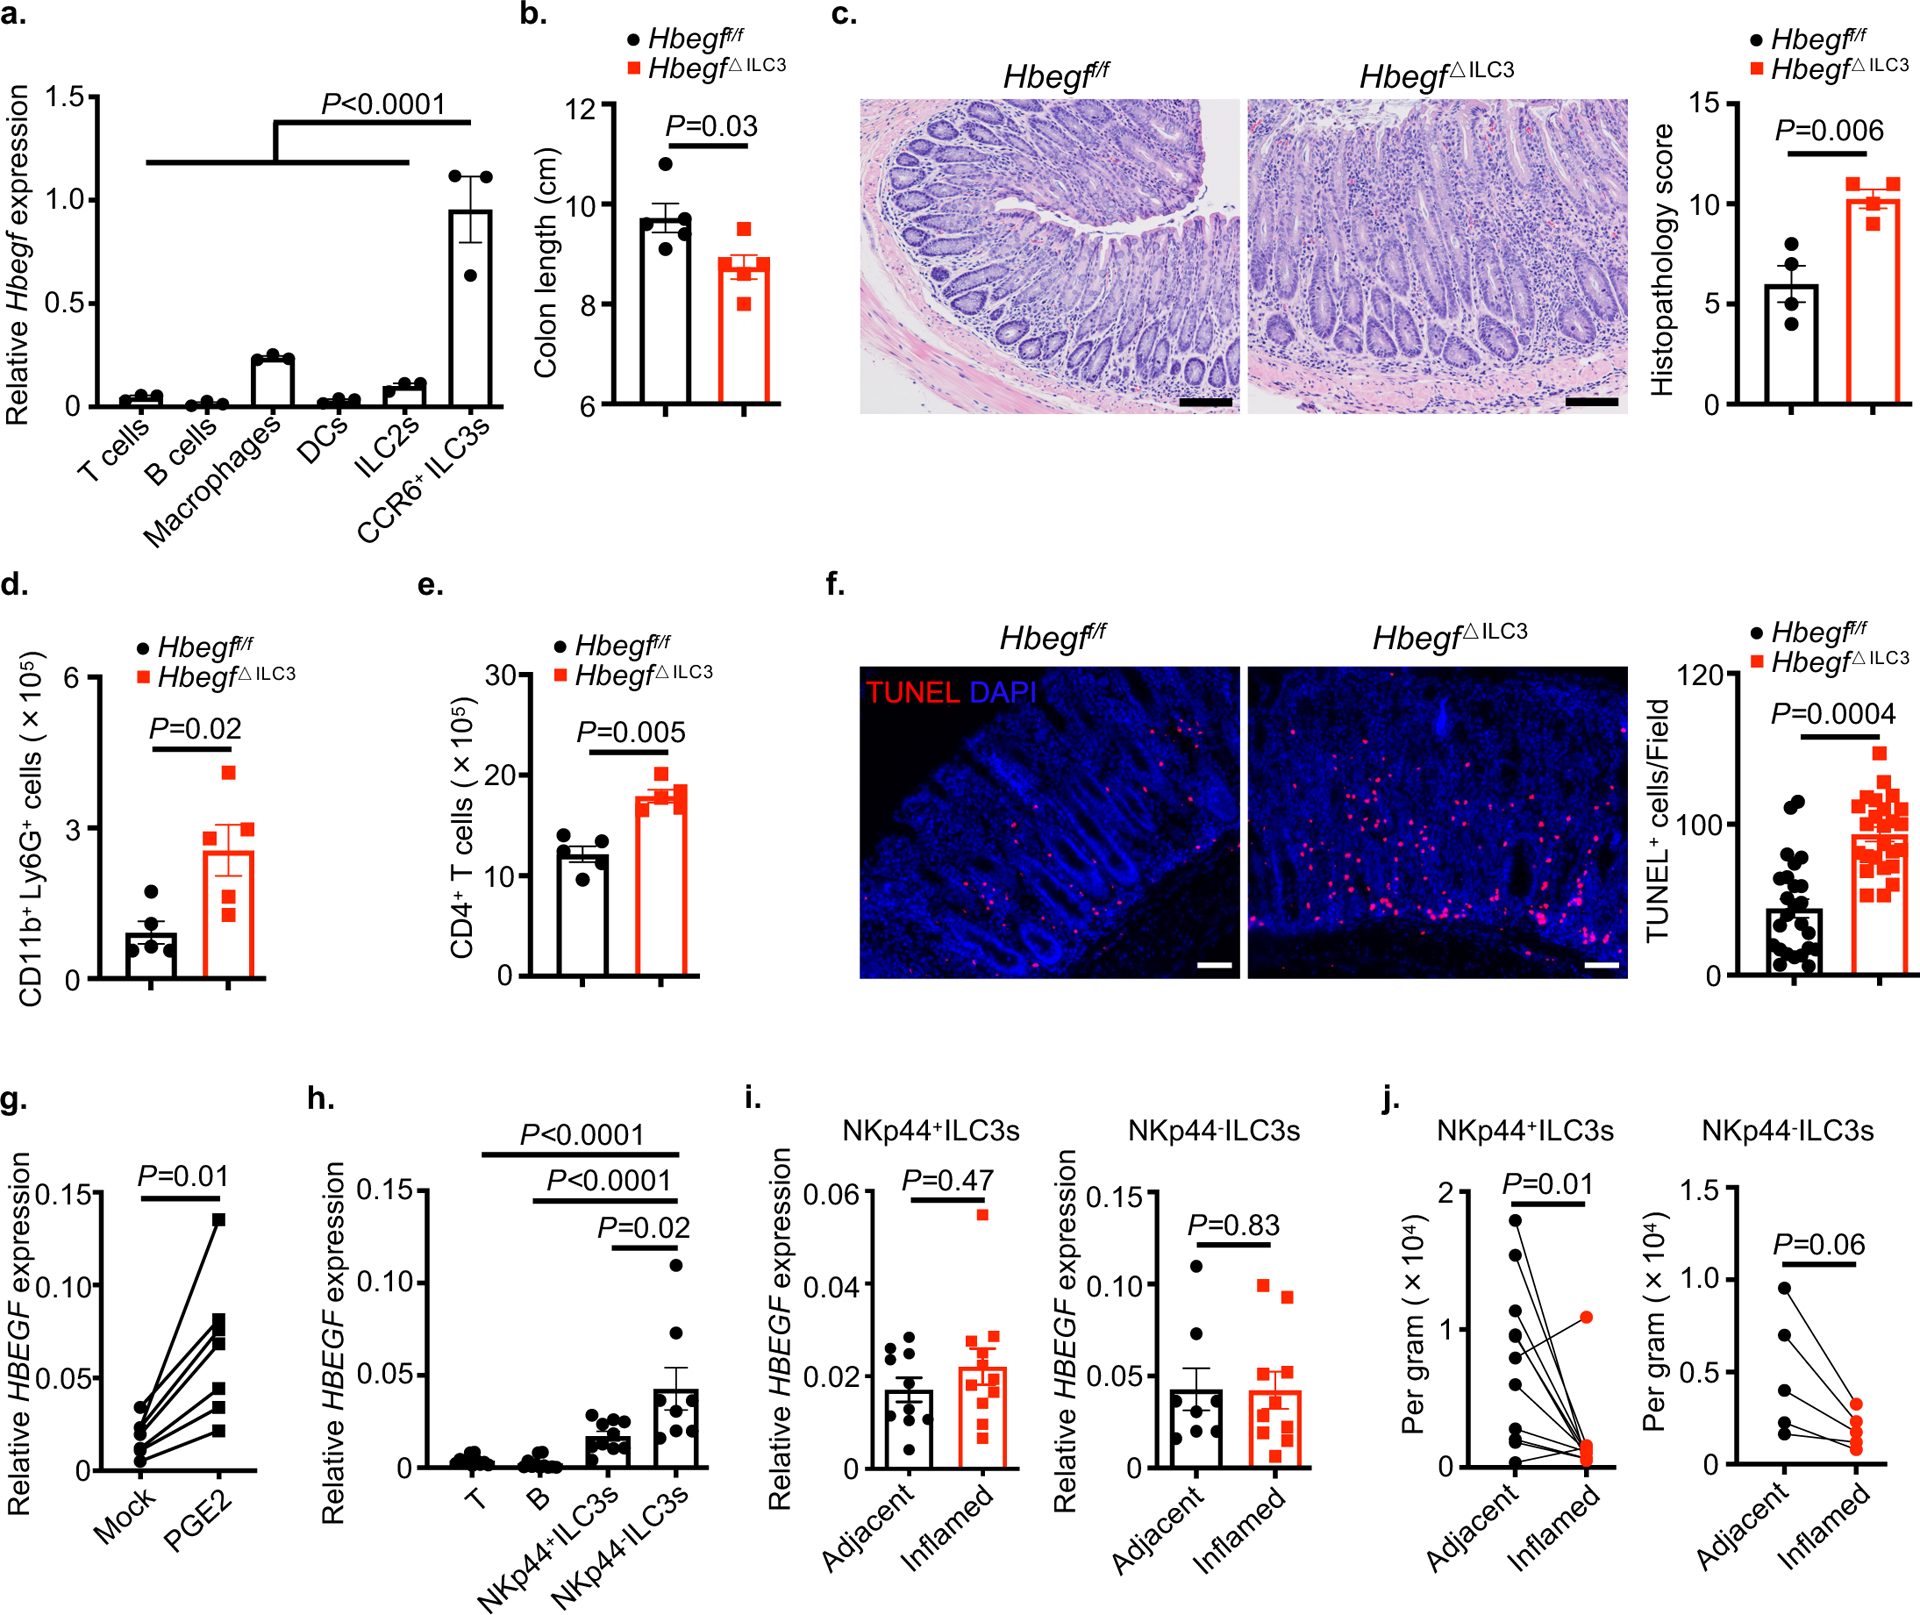
Tumor necrosis factor (TNF) drives chronic inflammation and cell death in the intestine, and blocking TNF is a therapeutic approach in inflammatory bowel disease (IBD). Despite this knowledge, the pathways that protect the intestine from TNF are incompletely understood. Here we demonstrate that group 3 innate lymphoid cells (ILC3s) protect the intestinal epithelium from TNF-induced cell death. This occurs independent of interleukin-22 (IL-22), and we identify that ILC3s are a dominant source of heparin-binding epidermal growth factor-like growth factor (HB-EGF). ILC3s produce HB-EGF in response to prostaglandin E2 (PGE2) and engagement of the EP2 receptor. Mice lacking ILC3-derived HB-EGF exhibit increased susceptibility to TNF-mediated epithelial cell death and experimental intestinal inflammation. Finally, human ILC3s produce HB-EGF and are reduced from the inflamed intestine. These results define an essential role for ILC3-derived HB-EGF in protecting the intestine from TNF and indicate that disruption of this pathway contributes to IBD.


Conflict of interest statement

Competing interests

The authors declare no competing interests.

Figures

Extended Data Fig. 1
Extended Data Fig. 1. The role of ILC3s and IL-22 in TNF-induced intestinal epithelial cell death
a. Experimental design of the assay. b. Mice in (a) were examined for the depletion efficiency of ILC3s in the small intestine. (n=3). c. CD90.2 levels in ILC2s or ILC3s were determined in IgG control mice. (n=3 individual mice). d. Mice in (a) were examined for the depletion efficiency of ILC2s in the small intestine. (n=3). e. Representative immunofluorescence sections and quantifications of TUNEL staining of the small intestine from noted mice 4 hours post recombinant TNF injection (N=3 mice per group, n=24 fields quantified per group). f. Mice in (a) were examined for the neutralization efficiency of endogenous IL-22 (n=3 individual mice). Data are representative of two independent experiments, shown as the means ± S.E.M. Statistics are calculated by unpaired two-tailed Student’s t-test (b-d and f) or one-way ANOVA (e). Scale bars=50 μm.
Extended Data Fig. 2
Extended Data Fig. 2. Signature gene expression of ILC clusters in the scRNA-Seq data set
Small intestinal ILCs were sort-purified from PBS- or TNF-treated mice and determined by scRNA-Seq. UMAP shows the relative expression of signature genes in all clusters of each treatment condition.
Extended Data Fig. 3
Extended Data Fig. 3. ILC3s express HB-EGF in the large intestine
a. Flow cytometry plots show HB-EGF expression in large intestine lamina propria (LI-LP) of noted mice as measured by conversion of the fluorescent LacZ substrate fluorescein di-β-d-galactopyranoside (FDG). b. Graph of frequency of HB-EGF+ cells in SI-LP of noted mice as measured by LacZ activity (n=5 individual mice). c-e. Flow cytometry plots (c), graph of frequency (d) and quantification of cell number (e) of HB-EGF+ cells in LI-LP of noted mice as measured by LacZ activity (n=4 individual mice). In both small and large intestines, CD4+ T cells were gated on CD45+CD3ε+CD4+, macrophages were gated on CD45+CD11b+CD11c+MHC II+CD64+, dendritic cells were gated on CD45+CD11b+CD11c+MHCII+CD64, ILC2s were gated on CD45+Lin CD127+CD90.2+KLRG1+, ILC3s were gated on CD45+LinCD127+CD90.2+KLRG1CD45dim CCR6+. Lineage 1: CD3ε, CD5, CD8α, NK1.1, TCRγδ. Lineage 2: CD11b, CD11c, B220. Data in a-e are representative of two or three independent experiments, shown as the means ± S.E.M. Statistics are calculated by one-way ANOVA.
Extended Data Fig. 4
Extended Data Fig. 4. HB-EGF protects from TNF-induced intestinal epithelial cell death
a-c. Cell death was induced in the murine rectum epithelial cell line CMT-93 by TNF and a cIAP inhibitor. Cell death was determined by representative flow cytometric analysis of cleaved-caspase 3 (a) or cleaved-caspase 8 (c) in the presence or absence of recombinant HB-EGF. Cell death was determined by representative flow cytometric analysis of cleaved-caspase 3 in the presence of various inhibitors (b). Data in a and b are representative of three independent experiments, data in c are pooled from three independent experiments, shown as the means ± S.E.M. Statistics are calculated by one-way ANOVA.
Extended Data Fig. 5
Extended Data Fig. 5. A PGE2-EP2 axis controls HB-EGF expression in ILC3s
a. qPCR analysis of Hbegf expression in sort-purified ILC3s cultured with or without TNF treatment, relative to Hprt (n=4 individual mice). b and c. UMAP show the expression of Ptgs2 (b) or Ptges (c) gene in all clusters of each treatment condition. The dotted line indicates CCR6+ ILC3 clusters. d. qPCR analysis of Hbegf expression in sort-purified ILC3s cultured with or without retinoic acid, relative to Hprt (n=6). e. Bar graph of the frequencies of IL-17A, IL-22, IFN-γ or GM-CSF in ILC3s in the presence or absence of PGE2 stimulation ex vivo (n=6). f. qPCR examination of Hbegf transcript in sort-purified ILC3s in the presence of various stimulus, relative to Hprt (n=4 individual mice). g. Flow cytometry plots with graph of the frequencies of HB-EGF+ immune cells in small intestine of RorccreHbegff/− mice with or without EP2 agonist in vivo treatment (n=3 individual mice of Mock and n=4 individual mice of EP2 agonist). h. Western blot analysis of pro-HB-EGF in sort-purified ILC2s or ILC3s from small intestine of Rag1−/− mice with or without EP2 agonist in vivo treatment. i. Sex- and age- matched Ptger2f/f and RorccrePtger2f/f mice were examined for the deletion efficiency of EP2 in ILC3s in the small intestines by qPCR, relative to Hprt (n=6 individual mice). j. Sort-purified ILC3s were stimulated with IL-1β in the presence or absence of EP2 antagonist, Hbegf expression was then examined by qPCR (n=6 individual mice). Data in a and f-h are representative of two independent experiments, data in d, e, i and j are pooled from two independent experiments, shown as the means ± S.E.M. Statistics are calculated by unpaired (a, g and i) or paired (d and e) two-tailed Student’s t-test or one-way ANOVA (f and j). *, non-specific band.
Extended Data Fig. 6
Extended Data Fig. 6. ILC3-derived HB-EGF does not impact immune homeostasis in the healthy gut
a and b. Flow cytometry plots with graph of frequencies and quantification of cell numbers of ILC3s (a) or IL-22+ ILC3s (b) in the large intestine of Hbegff/f and Hbegf△ILC mice at steady state (n=5 individual mice). c. Graph of frequencies and quantification of cell numbers of T cell subsets in the large intestine of Hbegff/f and Hbegf△ILC mice at steady state (n=5 individual mice). Data in a-c are representative of two independent experiments, shown as the means ± S.E.M. Statistics are calculated by unpaired two-tailed Student’s t-test.
Extended Data Fig. 7
Extended Data Fig. 7. Loss of T cell-derived HB-EGF does not alter susceptibility to experimental intestinal inflammation
a-c. Hbegff/f and Hbegf△T cell mice were given 3% DSS for 6 days, disease and recovery were monitored by weight loss (a), colon shortening (b) and H&E staining of the distal colon (c) at day 11 (n=5 individual mice). Data in a-c are representative of two independent experiments, shown as the means ± S.E.M. Statistics are calculated by unpaired two-tailed Student’s t-test. Scale bars=100 μm.
Extended Data Fig. 8
Extended Data Fig. 8. Intestinal epithelial cell responses in the absence of ILC3-specific HB-EGF
a-d. Hbegff/f and Hbegf△ILC mice were challenged with 3% DSS for 6 days (n=6 individual mice). The functional ability of intestinal epithelium was analyzed, including anti-microbial peptides production (a), tight junction proteins expression (b), stem cell composition (c) and proliferative ability (d) (N=4 individual mice per group, n=27 crypts quantified per group). e. Schematic model of chronic colitis induction. Data in a-d are representative of two independent experiments, shown as the means ± S.E.M. Statistics are calculated by unpaired two-tailed Student’s t-test. Scale bars=50 μm.
Extended Data Fig. 9
Extended Data Fig. 9. ILC3s produce HB-EGF to protect the intestine from TNF
Here we define a novel pathway of tissue protection in the mammalian intestine. Briefly, ILC3s sense intestinal damage or inflammation through IL-1β release, which amplifies ILC3 responses through a PGE2-EP2 axis, subsequently promoting HB-EGF production and protection against TNF-induced cell death in the intestinal epithelium.
Figure 1.
Figure 1.. ILC3s protect the intestinal epithelium from TNF-induced cell death.
a and b. Representative immunofluorescence sections and quantifications of cleaved-caspase 3 (CC3) (a) or TUNEL (b) staining of the small intestine from noted mice 4 hours post recombinant TNF injection (N=3 individual mice per group, n=18 fields per group). c and d. Representative immunofluorescence sections and quantifications of CC3 (c) or TUNEL (d) staining of small intestine from noted mice 4 hours post recombinant TNF injection (N=3 individual mice per group, n=18 fields per group). Data in a-d are representative of two independent experiments, shown as the means ± S.E.M. Statistics are calculated by one-way ANOVA. WT, wild type. Scale bars=50 μm.
Figure 2.
Figure 2.. ILC3s are a major cellular source of HB-EGF in the intestine.
a-d. Total ILCs were sort-purified from the small intestine of PBS- or TNF-treated mice and analyzed by scRNA-Seq. Uniform manifold approximation and projection (UMAP) embedding of 11,556 cells (dots), colored by cluster (a). Heatmap showing expression Z-scores of the indicated genes in ILC2s and ILC3s from TNF-treated mice (b). Dot plot shows the mean expression (color) of Hbegf in clusters grouped by cell type as noted, dot size represents the proportion of cells in a cluster with the gene detected (c). UMAP shows the expression of Hbegf gene in all clusters of each treatment condition and the dotted line indicates CCR6+ ILC3 clusters (d). e. Expression of Hbegf in the indicated sort-purified immune cells as determined by qPCR (n=3 individual mice). Relative to Actb. f. Flow cytometry plots show HB-EGF expression in small intestine lamina propria of noted mice as measured by conversion of the fluorescent LacZ substrate fluorescein di-β-d-galactopyranoside (FDG). g and h. Flow cytometry plots (g) and quantification of cell number (h) of HB-EGF+ cells in the small intestine of noted mice as measured by LacZ activity (n=5 individual mice). Lineage 1: CD3ε, CD5, CD8α, NK1.1, TCRγδ. Lineage 2: CD11b, CD11c, B220. Data in e-h are representative of two independent experiments, shown as the means ± S.E.M. Statistics are calculated by one-way ANOVA. DN, double-negative of CCR6 and Ncr1.
Figure 3.
Figure 3.. ILC3-derived HB-EGF protects the intestinal epithelium from TNF.
a and b. Cell death was induced in the murine rectum epithelial cell line CMT-93 by TNF and a cIAP inhibitor. Bar graph of frequencies of cleaved-caspase 3 (CC3) in the presence or absence of recombinant HB-EGF (a). Bar graph of frequencies of CC3 in the presence of various inhibitors (b). c-e. Representative immunofluorescence sections and quantifications of cleaved-caspase 3 (c) or TUNEL (d) or cleaved-caspase 8 (e) staining of small intestine 4 hours post recombinant TNF injection (N=3 individual mice per group. n=31 fields per group of c, n=20 fields per group of d, n=28 fields per group of e). Data in a and b are pooled from three independent experiments, shown as the means ± S.E.M, calculated by one-way ANOVA. Data in c-e are representative of two independent experiments, shown as the means ± S.E.M, calculated by unpaired two-tailed Student’s t-test. i, inhibition. Scale bars=50 μm.
Figure 4.
Figure 4.. ILC3s produce PGE2 in response to IL-1β.
a. Volcano plot of differential expression between PBS and TNF in CCR6+ ILC3s of scRNA-Seq data set. b and c. Dot plot show the mean expression (color) of Ptgs2 (b) or Ptges (c) in clusters grouped by cell type as noted. d. Ptgs2 transcript in sort-purified ILC3s in the presence of various stimulus, relative to Hprt (n=3 individual mice). e. Flow cytometry plots with graph of frequency of COX-2+ ILC3s from the SI-LPs of wild type mice following ex vivo culture (n=4 individual mice). f. Histograms and bar graph examination of mPGES-1 expression in indicated cells from the small intestine of wild type mice (n=5 individual mice). g. Sort-purified ILC3s were stimulated with or without IL-1β and PGE2 in supernatants were determined by ELISA (n=10 individual mice). Data in d-f are representative of two or three independent experiments, data in g are pooled from three independent experiments, shown as the means ± S.E.M. Statistics are calculated by paired two-tailed Student’s t-test (e and g) or one-way ANOVA (d and f).
Figure 5.
Figure 5.. PGE2 elicits ILC3-intrinsic HB-EGF production through the EP2 receptor.
a. qPCR analysis of Hbegf expression in sort-purified ILC3s with or without PGE2 treatment, relative to Hprt (n=4 individual mice). b. Dot plot shows the mean expression (color) of Ptger1-4 in clusters grouped by cell type as noted from the small intestine of TNF-treated mice. c. Sort-purified ILC3s were stimulated with PGE2 in the presence of EP2 or EP4 antagonist, Hbegf expression was then examined by qPCR, relative to Hprt (n=6 individual mice). d. Flow cytometry plots with graph of the frequencies of HB-EGF+ ILC3s in small intestine of RorccreHbegff/+ mice with or without EP2 agonist in vivo treatment (n=3 individual mice in Mock, n=4 individual mice in EP2 agonist). e. ILC3-intrinsic HB-EGF of indicated mice at steady state was determined by qPCR, relative to Hprt (n=6 individual mice). f and g. Representative immunofluorescence sections and quantifications of cleaved-caspase 3 (CC3) (f) (N=3 individual mice per group, n=21 fields per group) or TUNEL (g) (N=3 mice per group, n=21 fields per group) staining of the small intestine from noted mice 4 hours post recombinant TNF injection. Data in a, d, f and g are representative of two or three independent experiments, data in c and e are pooled from two independent experiments, shown as the means ± S.E.M. Statistics are calculated by paired (a) or unpaired (d and e) two-tailed Student’s t-test or one-way ANOVA (c, f and g). Scale bars=50 μm.
Fig 6.
Fig 6.. ILC3-derived HB-EGF protects from acute intestinal damage and inflammation.
a-f. Mice were given 3% DSS for 6 days, followed by normal water for recovery. Disease and recovery were monitored by weight loss (a), colon shortening (b), hematoxylin and eosin (H&E) staining with histopathology scores of the distal colon (c), lamina propria neutrophil infiltration (d) and CD4+ T cell response (e) at day 10 (n=6 individual mice). Intestinal epithelial cell death was examined by TUNEL staining at day 6 (f) (N=4 individual mice per group, n=16 fields per group). g-i. Wild-type mice were exposed to 3% DSS in the drinking water for 7 days and treated with PBS or 1 mg/kg recombinant HB-EGF intraperitoneally every other day starting on day 2 of DSS exposure. Mice were examined for weight loss (g) over the course of treatment, and colon length (h) and H&E staining with histopathology scores of the distal colon (i) were assessed on day 10 (n=4 individual mice in PBS, n=5 individual mice in rHB-EGF). Data are representative of two or three independent experiments, shown as the means ± S.E.M. Statistics are calculated by unpaired two-tailed Student’s t-test. Scale bars=50 μm in f. Scale bars=100 μm in c and i.
Fig 7.
Fig 7.. HB-EGF-producing ILC3s protect from chronic intestinal inflammation and are altered in IBD.
a. Expression of Hbegf in the indicated sort-purified immune cells from large intestine of IL-10-deficient mice as determined by qPCR (n=3 individual mice). Relative to Hprt. b-f. Mice were orally infected with H. hepaticus and blockade of the regulatory response with anti-IL10R antibody (n=5 individual mice). Colon shortening (b), hematoxylin and eosin (H&E) staining with histopathology scores of the distal colon (c) (n=4 individual mice), lamina propria neutrophil infiltration (d) and CD4+ T cell response (e), and intestinal epithelial cell death was examined by TUNEL staining (f) (N=4 mice per group, n=25 fields per group) at day 21. g. Sort-purified ILC3s from human tonsils were stimulated with or without PGE2 and HBEGF transcript was determined by qPCR (n=7 individual donors). h-j, Human lamina propria lymphocytes were sort-purified from adjacent non-inflamed versus matched inflamed surgical resection tissues from the small intestine of Crohn’s disease patients (n=11 individual donors). HBEGF in the indicated cells of non-inflamed tissues were determined by qPCR, relative to ACTB (h). HBEGF in the NKp44ILC3s or NKp44+ILC3s of adjacent versus inflamed tissues were determined by qPCR (i). Quantification of NKp44ILC3s or NKp44+ILC3s numbers per gram of tissue between adjacent and inflamed tissues (j). Data in a-f are representative of two independent experiments, data in g-j are pooled from two or three independent experiments, shown as the means ± S.E.M. Statistics are calculated by one-way ANOVA (a) or unpaired two-tailed Student’s t-test (b-f), statistic in g and j are performed using two-tailed Wilcoxon matched-pairs test (paired), statistics in h and i are performed using two-tailed Mann–Whitney U-test (unpaired), Scale bars=50 μm in f. Scale bars=100 μm in c.

Comment in

  • Intestinal barrier protection.
    Minton K. Minton K. Nat Rev Immunol. 2022 Mar;22(3):144-145. doi: 10.1038/s41577-022-00685-5. Nat Rev Immunol. 2022. PMID: 35105977 No abstract available.

References

    1. Kalliolias GD & Ivashkiv LB TNF biology, pathogenic mechanisms and emerging therapeutic strategies. Nature reviews. Rheumatology 12, 49–62, doi:10.1038/nrrheum.2015.169 (2016). - DOI - PMC - PubMed
    1. Tracey KJ & Cerami A Tumor necrosis factor: a pleiotropic cytokine and therapeutic target. Annual review of medicine 45, 491–503, doi:10.1146/annurev.med.45.1.491 (1994). - DOI - PubMed
    1. Friedrich M, Pohin M & Powrie F Cytokine Networks in the Pathophysiology of Inflammatory Bowel Disease. Immunity 50, 992–1006, doi:10.1016/j.immuni.2019.03.017 (2019). - DOI - PubMed
    1. Graham DB & Xavier RJ Pathway paradigms revealed from the genetics of inflammatory bowel disease. Nature 578, 527–539, doi:10.1038/s41586-020-2025-2 (2020). - DOI - PMC - PubMed
    1. Neurath MF Current and emerging therapeutic targets for IBD. Nature reviews. Gastroenterology & hepatology 14, 269–278, doi:10.1038/nrgastro.2016.208 (2017). - DOI - PubMed

Publication types

MeSH terms

Substances