

A Guide to Estimating the Reference Range From a Meta-Analysis Using Aggregate or Individual Participant Data
- PMID: 35102410
- PMCID: PMC9431652
- DOI: 10.1093/aje/kwac013
A Guide to Estimating the Reference Range From a Meta-Analysis Using Aggregate or Individual Participant Data
Abstract
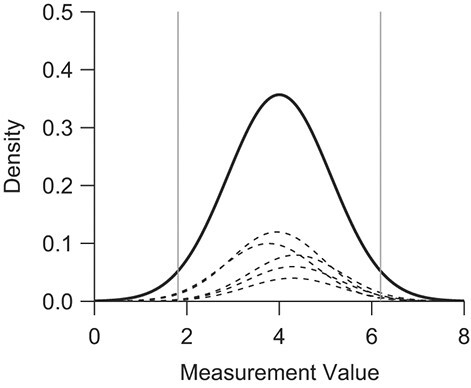
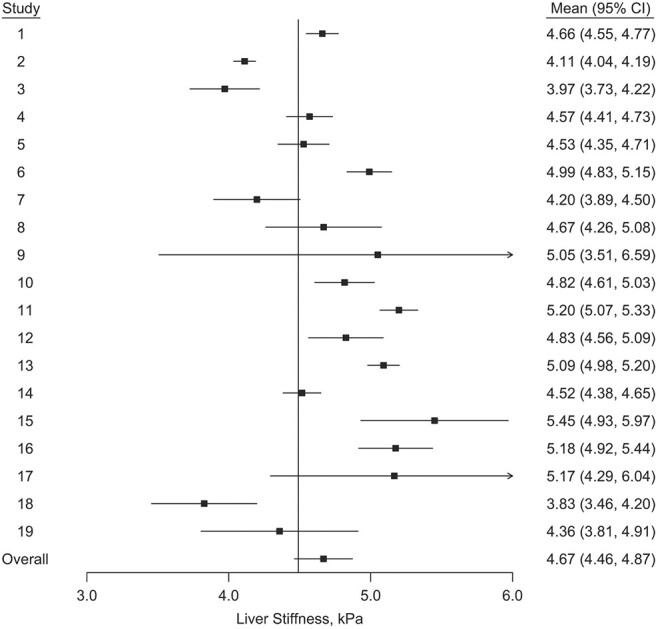
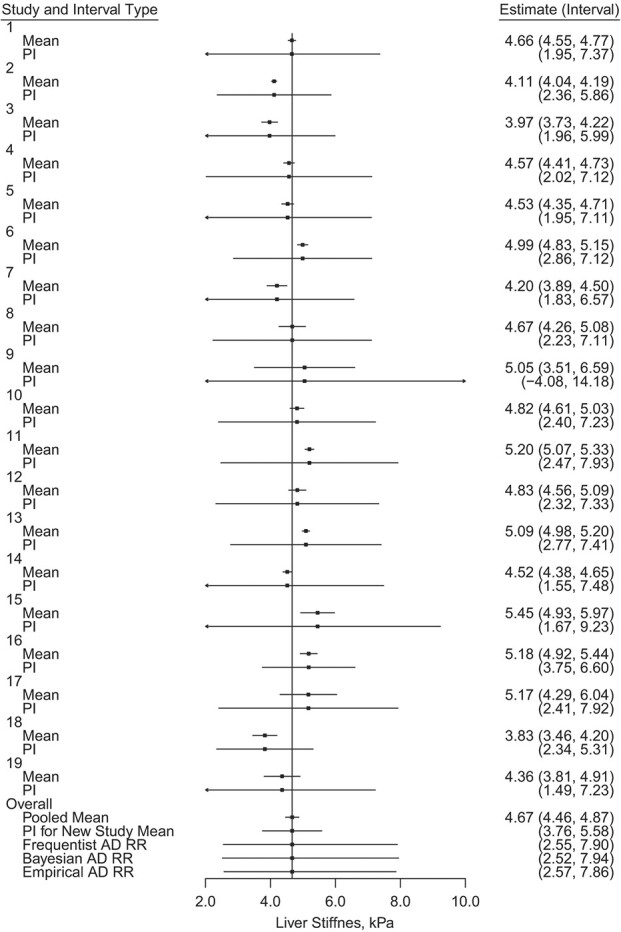
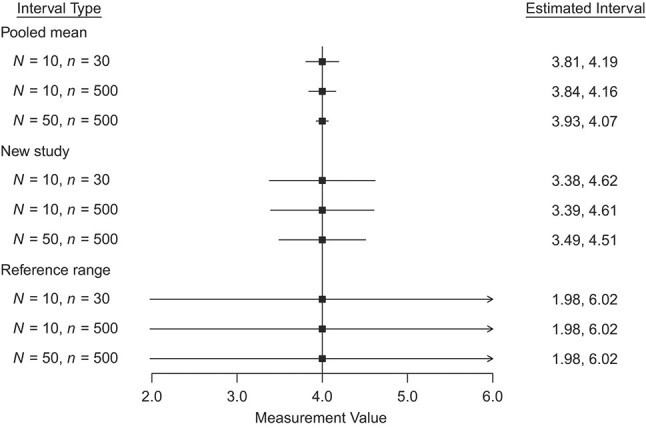
Clinicians frequently must decide whether a patient's measurement reflects that of a healthy "normal" individual. Thus, the reference range is defined as the interval in which some proportion (frequently 95%) of measurements from a healthy population is expected to fall. One can estimate it from a single study or preferably from a meta-analysis of multiple studies to increase generalizability. This range differs from the confidence interval for the pooled mean and the prediction interval for a new study mean in a meta-analysis, which do not capture natural variation across healthy individuals. Methods for estimating the reference range from a meta-analysis of aggregate data that incorporates both within- and between-study variations were recently proposed. In this guide, we present 3 approaches for estimating the reference range: one frequentist, one Bayesian, and one empirical. Each method can be applied to either aggregate or individual-participant data meta-analysis, with the latter being the gold standard when available. We illustrate the application of these approaches to data from a previously published individual-participant data meta-analysis of studies measuring liver stiffness by transient elastography in healthy individuals between 2006 and 2016.
Keywords: meta-analysis; normative data; prediction interval; random effects; reference range.
© The Author(s) 2022. Published by Oxford University Press on behalf of the Johns Hopkins Bloomberg School of Public Health. All rights reserved. For permissions, please e-mail: journals.permissions@oup.com.
Figures
References
-
- Bazerbachi F, Haffar S, Wang Z, et al. Range of normal liver stiffness and factors associated with increased stiffness measurements in apparently healthy individuals. Clin Gastroenterol Hepatol. 2019;17(1):54–64.e1. - PubMed
-
- Pathan F, D’Elia N, Nolan M, et al. Normal ranges of left atrial strain by speckle tracking echocardiography: a systematic review and meta-analysis of 1,789 healthy subjects. J Am Coll Cardiol. 2016;67(13):1582. - PubMed
-
- Venner AA, Doyle-Baker PK, Lyon ME, et al. A meta-analysis of leptin reference ranges in the healthy paediatric prepubertal population. Ann Clin Biochem. 2009;46(1):65–72. - PubMed
-
- Staessen JA, Fagard RH, Lijnen PJ, et al. Mean and range of the ambulatory pressure in normotensive subjects from a meta-analysis of 23 studies. Am J Cardiol. 1991;67(8):723–727. - PubMed
