. 2022 Jun 8;14(2):mjac008.
doi: 10.1093/jmcb/mjac008.

Intrinsic entropy model for feature selection of scRNA-seq data

Affiliations

Intrinsic entropy model for feature selection of scRNA-seq data

Lin Li et al. J Mol Cell Biol. .

Abstract

Recent advances of single-cell RNA sequencing (scRNA-seq) technologies have led to extensive study of cellular heterogeneity and cell-to-cell variation. However, the high frequency of dropout events and noise in scRNA-seq data confounds the accuracy of the downstream analysis, i.e. clustering analysis, whose accuracy depends heavily on the selected feature genes. Here, by deriving an entropy decomposition formula, we propose a feature selection method, i.e. an intrinsic entropy (IE) model, to identify the informative genes for accurately clustering analysis. Specifically, by eliminating the 'noisy' fluctuation or extrinsic entropy (EE), we extract the IE of each gene from the total entropy (TE), i.e. TE = IE + EE. We show that the IE of each gene actually reflects the regulatory fluctuation of this gene in a cellular process, and thus high-IE genes provide rich information on cell type or state analysis. To validate the performance of the high-IE genes, we conduct computational analysis on both simulated datasets and real single-cell datasets by comparing with other representative methods. The results show that our IE model is not only broadly applicable and robust for different clustering and classification methods, but also sensitive for novel cell types. Our results also demonstrate that the intrinsic entropy/fluctuation of a gene serves as information rather than noise in contrast to its total entropy/fluctuation.

Keywords: entropy decomposition; extrinsic entropy; feature selection; informative genes; intrinsic entropy; scRNA-seq.


Figures

Figure 1
Figure 1
Overview of the IE model. (A) TE of each gene can be decomposed into IE and EE in the IE model. High-IE genes are more informative and thus can be used for downstream analysis of scRNA-seq data. (B) Performance of various feature selection methods evaluated by ARI in simulated datasets. The IE model shows better performance than other methods in terms of ARI.
Figure 2
Figure 2
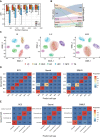
The IE model accurately identifies informative genes. (A) Performance of three feature selection methods in real datasets measured by ARI. (B) The Sankey diagram shows the clustering result (ARI = 0.97) of the Tabula Muris (Mammary Gland) dataset based on genes selected by the IE model (high-IE genes). (C) t-SNE plots show the dimensional reduction results based on the genes selected by the IE model, S–E, and HVG. (D) Heatmap plots for the confusion matrix of the results by different clustering methods on the Chu-time dataset. The clustering analysis was performed based on genes selected by the IE model. (E) Heatmap plots for the confusion matrix of the results by different clustering methods on the Tabula Muris (Heart and Aorta) dataset. The clustering analysis was performed based on genes selected by the IE model.
Figure 3
Figure 3
The performance of the IE model on cell type classification of the Tabula Muris dataset. (A) Classification accuracy was measured on 20 single-cell datasets by using six classification methods. The center line indicates the median classification accuracy. The lower and upper hinges represent the 25th and 75th percentiles, respectively. Each dot represents the accuracy for one dataset. (B) Kappa coefficient evaluation for 6 methods on 20 single-cell datasets from Tabula Muris. The center line indicates the median kappa coefficient. The lower and upper hinges represent the 25th and 75th percentiles, respectively. Each dot represents the mean kappa coefficient of one dataset by using 10-fold cross-validation. (C) Sankey plots show the xGBoost classification results of the Large-Intestine dataset based on genes selected by IE, S–E, and HVG.
Figure 4
Figure 4
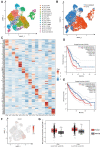
IE-guided cluster analysis identifies distinct subtypes in myeloid cells. (A) UMAP plots show the reclustered results of lung cancer-associated myeloid cells, colored by clusters. (B) UMAP plots of myeloid cells. Each cell is colored by its origin (tumor or nonmalignant lung). (C) The heatmap shows the relative expression levels of the top 10 marker genes (rows) in each cluster (columns). (D and E) Kaplan‒Meier survival analysis curves of TCGA LUAD (D) and LUSC (E) patients grouped by the top 15 markers of M_C3_CCL20. (F) The t-SNE plot shows the expression level of the CCL20 gene. (G) The subtype M_C3_CCL20 (M3) signature expression levels in tumor and normal samples of LUAD and LUSC patients.

Similar articles

Cited by

References

    1. Breiman L. (2001). Random forests. Mach. Learn. 45, 5–32.
    1. Brennecke P., Anders S., Kim J.K.et al. (2013). Accounting for technical noise in single-cell RNA-seq experiments. Nat. Methods 10, 1093–1095. - PubMed
    1. Chen L., Liu R., Liu Z.P.et al. (2012). Detecting early-warning signals for sudden deterioration of complex diseases by dynamical network biomarkers. Sci. Rep. 2, 342. - PMC - PubMed
    1. Chen T.Q., Guestrin C. (2016). ‘XGBoost: a scalable tree boosting system’. In: Proceedings of the 22nd ACM SIGKDD International Conference on Knowledge Discovery and Data Mining, San Francisco, CA, 2016. 785–794. New York, NY, USA: Association for Computing Machinery.
    1. Chen W., Qin Y., Liu S. (2020). CCL20 signaling in the tumor microenvironment. Adv. Exp. Med. Biol. 1231, 53–65. - PubMed

Publication types