. 2022 Feb;11(2):e12162.
doi: 10.1002/jev2.12162.

The impact of storage on extracellular vesicles: A systematic study

Affiliations

The impact of storage on extracellular vesicles: A systematic study

Stefano Gelibter et al. J Extracell Vesicles. 2022 Feb.

Abstract

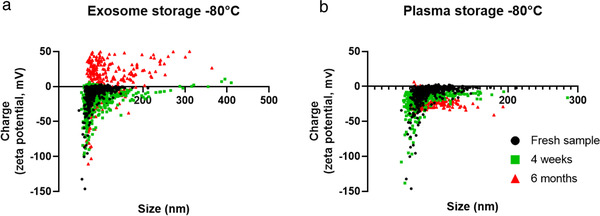
Mounting evidence suggests that storage has an impact on extracellular vesicles (EVs) properties. While -80°C storage is a widespread approach, some authors proposed improved storage strategies with conflicting results. Here, we designed a systematic study to assess the impact of -80°C storage and freeze-thaw cycles on EVs. We tested the differences among eight storage strategies and investigated the possible fusion phenomena occurring during storage. EVs were collected from human plasma and murine microglia culture by size exclusion chromatography and ultracentrifugation, respectively. The analysis included: concentration, size and zeta potential (tunable resistive pulse sensing), contaminant protein assessment; flow cytometry for the analysis of two single fluorescent-tagged EVs populations (GFP and mCherry), mixed before preservation. We found that -80°C storage reduces EVs concentration and sample purity in a time-dependent manner. Furthermore, it increases the particle size and size variability and modifies EVs zeta potential, with a shift of EVs in size-charge plots. None of the tested conditions prevented the observed effects. Freeze-thaw cycles lead to an EVs reduction after the first cycle and to a cycle-dependent increase in particle size. With flow cytometry, after storage, we observed a significant population of double-positive EVs (GFP+ -mCherry+ ). This observation may suggest the occurrence of fusion phenomena during storage. Our findings show a significant impact of storage on EVs samples in terms of particle loss, purity reduction and fusion phenomena leading to artefactual particles. Depending on downstream analyses and experimental settings, EVs should probably be processed from fresh, non-archival, samples in majority of cases.

Keywords: extracellular vesicles; flow cytometry; fusion; preservation; size exclusion chromatography; storage; tunable resistive pulse sensing.


Conflict of interest statement

Gelibter S, Marostica G, Mandelli A, Siciliani S, Podini P, Finardi A report no disclosures. Furlan R received honoraria for serving on scientifc advisory boards or as a speaker from Biogen, Novartis, Roche, Merck, and funding for research from Merck.

Figures

FIGURE 1
FIGURE 1
EVs characterization: Western blot analysis and TEM imaging – (a) Western Blot probing for vesicular and non‐vesicular markers of plasma EVs samples and BV2 samples. As specific EVs associated markers, we used LAMP1, ALIX, Flotillin‐1, ANXA1. As non‐EVs markers, we used apolipoprotein E (ApoE), histone 3 (H3), GM130. GFP and mCherry proteins marked EVs isolated from fGFP‐engineered BV2 and fmCherry‐engineered BV2, respectively. BV EVs were isolated by ultracentrifugation from wild‐type BV2 (WT EVs), fGFP engineered BV2 (fGFP EVs), and fmCherry engineered BV2 (fmCherry EVs) in three independent preparations. Plasma EVs were isolated with SEC columns as described in methods, from three different healthy donors. fGFP engineered BV2 (fGFP BV2) and fmCherry engineered BV2 (fmCherry BV2) are included as positive controls. (b) Representative TEM images of fresh plasma EVs stained with uranyl acetate. In (c) immunogold labelling performed with anti‐CD63 antibody confirmed the EVs nature of the observed particles (c)
FIGURE 2
FIGURE 2
Effects of −80°C storage on EVs concentration, size and contaminant protein concentration – Storage reduces EVs yield (a) and EVs recovery from plasma samples (e) in a time‐dependent manner. In (b) and (f), the contaminant protein concentration showed a trend to increase over time both in stored fresh EVs samples (b) and when EVs are recovered after plasma storage (f). EVs storage leads to a significant increase in median particle size (c) and size variability (d). On the opposite, the storage of plasma sample did not significantly affect size (g) and particle size variability (h) in EVs recovered after storage. In all figures, significance is expressed as follows: * P≤0.05, ** P≤0.01, *** P≤0.001, **** P≤0.0001, if not otherwise specified. The test performed is Friedman test followed by Dunn's procedure for pairwise comparisons if not otherwise specified
FIGURE 3
FIGURE 3
Effect of −80°C storage on charge versus size plots – Plots describe the distribution at three different time points of the particles from a single healthy donor as a representative example of the changes occurring during storage. In (a) are shown the changes in stored EVs samples. After 6 months of storage, we observed a shift of the particle population towards positive zeta potential values and increased particle size. The change in distribution was prevented in EVs recovered from stored plasma samples (b)
FIGURE 4
FIGURE 4
Effect of different storage strategies on EVs samples – A time‐dependent significant reduction in EVs yield was observed regardless the tested storage strategies (two‐way mixed ANOVA). The overall effect of time was significant for all the tested conditions, with a reduction of concentration after 6 months (post‐hoc analysis fresh vs. 6 months P = 0.001, 4 weeks vs. 6 months P = 0.003). No difference has been found among different conditions nor significant interaction between time and storage condition. Significant differences are expressed as *** P≤0.001 for fresh versus 6 months samples and as ## P≤0.01 for 4 weeks vs. 6 months
FIGURE 5
FIGURE 5
Effect of freeze‐thaw cycles on EVs samples – Both snap and slow freeze‐thaw cycles led to a significant reduction in particle yield after cycle 1 (a) and to a cycle‐dependent increase in particle size (b) (Significance is referred to comparisons with fresh samples; no difference was found according to the cycle velocity). EVs preservation through freeze‐thaw cycles was also assessed with TEM imaging. In (c) representative TEM images of EVs samples, analysed freshly and after each of three freeze‐thaw cycles. Freeze‐thaw cycles induced an important reduction of particle yield compared to fresh samples, with no differences observed between snap and slow cycles. In (d) representative immunogold labelling of EVs sample analysed freshly and after a freeze‐thaw cycle. EVs were probed by immunogold with CD63 specific antibody and 20 nm gold‐conjugated secondary antibody. Black arrows point to CD63 specific labelling on EVs structures. After the freeze‐thaw procedure, we observed an increased size of the CD63 labelled particles
FIGURE 6
FIGURE 6
Storage leads to EVs disruption and fusion phenomena – In (a) flow cytometer analysis of the whole EVs population (a mix of GFP+ and mCherry+ single positive particles) before and after freeze‐thaw cycles. Freeze‐thaw cycles induce a reduction in particle concentration (total IB4+ events) and an increased percentage of double‐positive EVs (GFP‐mCherry+ events). In sEVs subpopulation (b), we observed a marked reduction EVs concentration mostly occurring after the first two freeze‐thaw cycles. The percentage of double‐positive events showed only a slight increase In lEVs subpopulation (c), freeze‐thaw cycles induce a fluctuation of the number of IB4+ events and a marked increase in double‐positive events comparing fresh and first cycle samples to subsequent freeze‐thaw cycles.
FIGURE 7
FIGURE 7
TRPS analysis of BV2‐derived EVs undergoing freeze‐thaw cycles TRPS analysis showed a reduction in particle concentration in the overall EVs population (a) and in sEVs (b). In (a) Friedman was performed for overall EVs population, resulting significant for wild‐type (WT) (P = 0.028, post hoc analysis fresh vs. second cycle P = 0.0143), GFP (P = 0.028, post hoc analysis fresh vs. second cycle P = 0.0143) and mixed (GFP and mCherry) BV2‐derived EVs (P = 0.028, post hoc analysis fresh vs. second cycle P = 0.0143) (overall median values: fresh 2.54 × 1011; first cycle 1.44 × 1011; second cycle 7.93 × 1010). In (B) Friedman test performed for sEVs, significant for WT, GFP and mixed population (for all conditions, P = 0.028, post hoc analysis fresh vs. second cycle P = 0.0143) (overall median values: fresh 2.25 × 1011; first cycle 1.26 × 1011; second cycle 5.91 × 1010). In (c) we found no significant difference in lEVs concentration (P = 0.36 for WT, P = 0.19 for all other conditions. Overall median values: fresh 3.63 × 1010; first cycle 1.65 × 1010; second cycle 1.84 × 1010). In (D) we observed a significant cycle‐dependent increase of the percentage of lEVs on the total EVs population (P = 0.013, post‐hoc analysis: fresh vs. second cycle P = 0.24, first cycle vs. second P = 0.014). In (E) EVs size increased after the second freeze‐thaw cycle in WT (P = 0.028, post hoc analysis fresh vs. second cycle P = 0.0143), GFP (P = 0.028, post hoc analysis fresh vs. second cycle P = 0.0143) and mCherry samples (P = 0.019, post hoc analysis fresh vs. second cycle P = 0.041) (Overall median values: fresh 139±29 nm, first cycle 134.5±17 nm, second cycle 181±47 nm)

References

    1. Agrawal, A. K. , Aqil, F. , Jeyabalan, J. , Spencer, W. A. , Beck, J. , Gachuki, B. W. , Alhakeem, S. S. , Oben, K. , Munagala, R. , Bondada, S. , & Gupta, R. C. (2017).Milk‐derived exosomes for oral delivery of paclitaxel. Nanomedicine: Nanotechnology, Biology and Medicine, 13(5), 1627–1636. - PubMed
    1. Ayers, L. , Kohler, M. , Harrison, P. , Sargent, I. , Dragovic, R. , Schaap, M. , Nieuwland, R. , Brooks, S. A. , & Ferry, B. (2011).Measurement of circulating cell‐derived microparticles by flow cytometry: Sources of variability within the assay. Thrombosis Research, 127(4), 370–377. - PubMed
    1. Ayoub, A. E. , & Salm, A. K. (2003).Increased morphological diversity of microglia in the activated hypothalamic supraoptic nucleus. Journal of Neuroscience, 23(21), 7759–7766. - PMC - PubMed
    1. Beit‐Yannai, E. , Tabak, S. , & Stamer, W. D. (2018).Physical exosome:eXosome interactions. Journal of Cellular and Molecular Medicine, 22(3), 2001–2006. - PMC - PubMed
    1. Bosch, S. , De Beaurepaire, L. , Allard, M. , Mosser, M. , Heichette, C. , Chrétien, D. , Jegou, D. , & Bach, J. ‐. M. (2016).Trehalose prevents aggregation of exosomes and cryodamage. Scientific Reports, 6(1), 36162. - PMC - PubMed

Publication types