. 2022 Mar 16;14(636):eabl6141.
doi: 10.1126/scitranslmed.abl6141. Epub 2022 Mar 16.

Infection or a third dose of mRNA vaccine elicits neutralizing antibody responses against SARS-CoV-2 in kidney transplant recipients

Affiliations

Infection or a third dose of mRNA vaccine elicits neutralizing antibody responses against SARS-CoV-2 in kidney transplant recipients

Xavier Charmetant et al. Sci Transl Med. .

Abstract

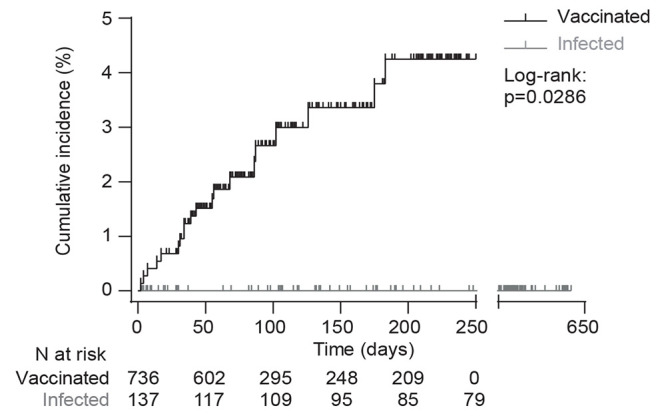
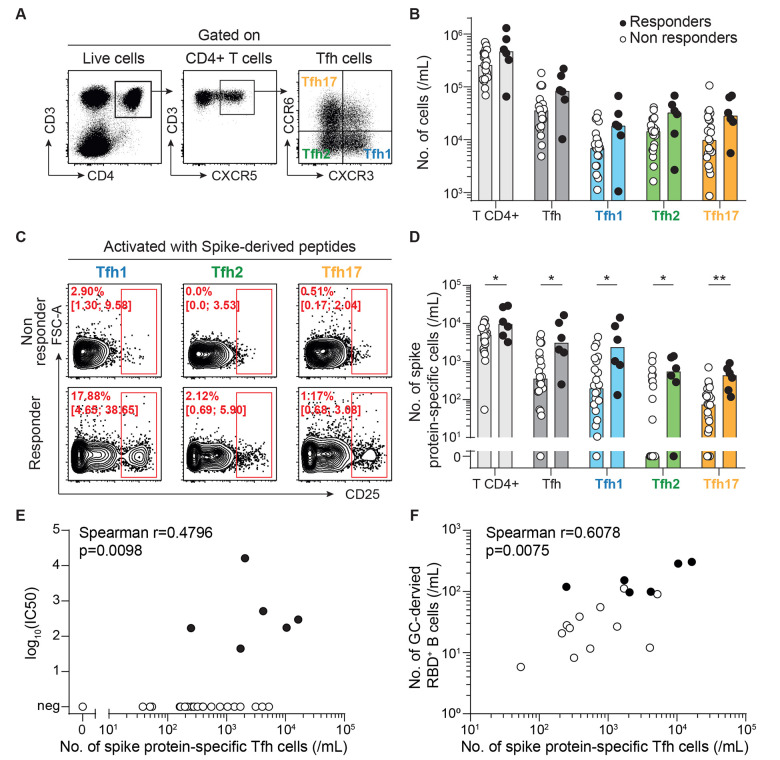
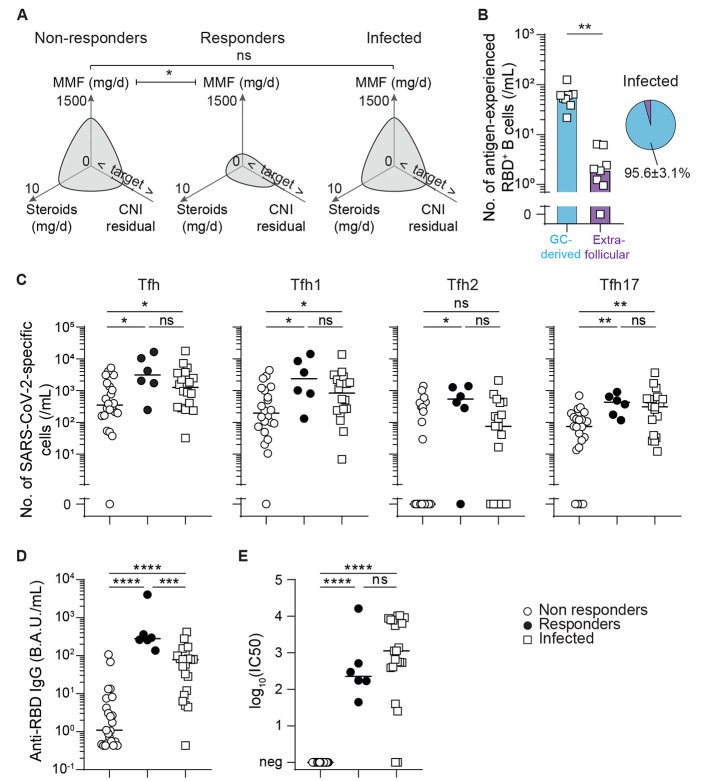
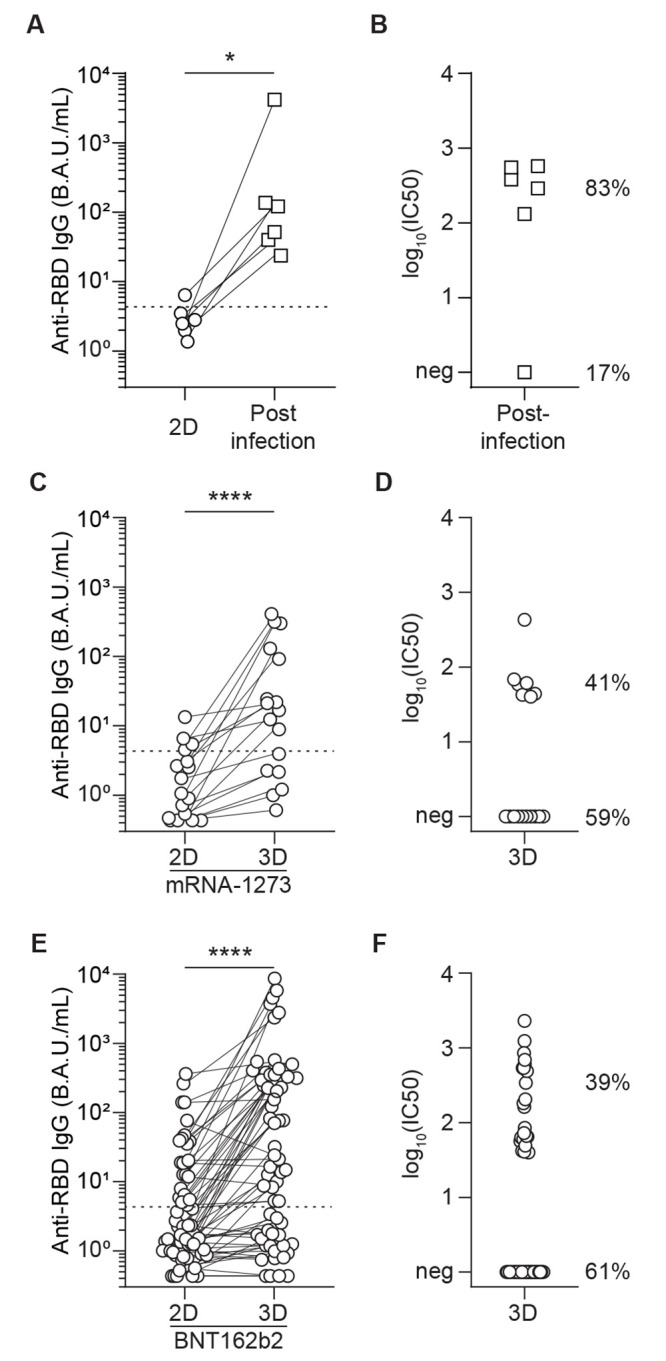
Transplant recipients, who receive therapeutic immunosuppression to prevent graft rejection, are characterized by high coronavirus disease 2019 (COVID-19)-related mortality and defective response to vaccines. We observed that previous infection with severe acute respiratory syndrome coronavirus 2 (SARS-CoV-2), but not the standard two-dose regimen of vaccination, provided protection against symptomatic COVID-19 in kidney transplant recipients. We therefore compared the cellular and humoral immune responses of these two groups of patients. Neutralizing anti-receptor-binding domain (RBD) immunoglobulin G (IgG) antibodies were identified as the primary correlate of protection for transplant recipients. Analysis of virus-specific B and T cell responses suggested that the generation of neutralizing anti-RBD IgG may have depended on cognate T-B cell interactions that took place in germinal center, potentially acting as a limiting checkpoint. High-dose mycophenolate mofetil, an immunosuppressive drug, was associated with fewer antigen-specific B and T follicular helper (TFH) cells after vaccination; this was not observed in patients recently infected with SARS-CoV-2. Last, we observed that, in two independent prospective cohorts, administration of a third dose of SARS-CoV-2 mRNA vaccine restored neutralizing titers of anti-RBD IgG in about 40% of individuals who had not previously responded to two doses of vaccine. Together, these findings suggest that a third dose of SARS-CoV-2 mRNA vaccine improves the RBD-specific responses of transplant patients treated with immunosuppressive drugs.


Figures

Fig. 1.
Fig. 1.. Infection confers better protection against symptomatic COVID-19 than vaccination in transplant recipients.
Protection against COVID-19 was compared between renal transplant recipients with previous history of infection with SARS-CoV-2 (group “infected”, gray curve) and those who received the standard two-dose regimen of mRNA-1273 (group “vaccinated”, black curve). The follow-up started at the time of COVID-19 symptoms onset for infected patients and at the time of the second vaccine administration for the vaccinated patients. Cumulative incidence in the two groups was plotted using the Kaplan–Meier method. Data were analyzed by a Log-rank test; p=0.0286.
Fig. 2.
Fig. 2.
SARS-CoV-2-specific cellular immunity was comparable in previously infected and vaccinated transplant recipients. (A and B) CD4+ (A) and CD8+ (B) T cells were enumerated in the circulation of recently infected (n=21; open squares) and vaccinated (n=29; open circles) transplant recipients. (C to L) CD8+ T cells (C to G) and CD4+ Th1 cells (H to L) directed against the spike (S), nucleocapsid (NCAP), and membrane (VME) proteins of SARS-CoV-2 were enumerated in the circulation of recently infected and vaccinated transplant recipients. Data were background subtracted against DMSO negative control. (C) Flow cytometry profiles of a representative patient of each group are shown. Median percentage and interquartile range are indicated. (D) The count of CD8+ T cells specific to each viral protein is plotted for each patient. (E) For each patient, the total number of virus-specific CD8+ cytotoxic T cells is plotted. (F) Concatenated flow cytometry profiles of the two groups of patients are shown. Median percentage and interquartile range are indicated. FSC-A, forward scatter area. (G) The proportion of INFγ-producing SARS-CoV-2-specific CD8+ cytotoxic T cells is plotted for each patient (infected patients, n=7; vaccinated patients, n=18). (H) Flow cytometry profiles of a representative patient of each group are shown. Median percentage and interquartile range are indicated. (I) The count of Th1-polarized CD4+ T cells specific to each viral protein is plotted for each patient. (J) For each patient, the total number of virus-specific Th1-polarized CD4+ T cells is plotted. (K) Concatenated flow cytometry profiles of the two groups of patients are shown. Median percentage and interquartile range are indicated. (L) The proportion of IFN-γ-producing SARS-CoV-2-specific Th1 CD4+ T cells is plotted for each patient (infected patients, n=7; vaccinated patients, n=18). The bars indicate the median. Data were analyzed using a Mann-Whitney test; ns, p>0.05; *p≤0.05; ****p<0.0001.
Fig. 3.
Fig. 3.. Anti-SARS-CoV-2 specific humoral immunity elicited by infection and vaccination differ in transplant recipients.
(A and B) The titers of IgG antibodies directed against the nucleocapsid protein (A) or receptor binding domain (B) of SARS-CoV-2 were measured in the circulation of recently infected (n=21; open squares) and vaccinated (n=29; open circles) transplant recipients. A.U., arbitrary units; B.A.U., binding antibody units. (C). The neutralizing capacity of patients’ serum was compared between recently infected (n=21; open squares) and vaccinated (n=29; open circles) transplant recipients. Neutralizing titers are presented as the log 10 of the dilution inhibiting 50% of target infection, or log10(IC50). Neg indicates no evidence of neutralizing antibodies. For (A to C), the bars indicate median values. Pie charts are used to compare proportions. (D and E) The values of anti-RBD IgG titers and neutralizing capacity of the serum were log-transformed and plotted. (D) Results for the patients of the COVATRHUS cohort who were infected (n=21; open squares) or vaccinated (n=29; open circles) are plotted. The relation between the two variables was analyzed with a non-linear regression model using a 4 parameters slope. The result of Spearman correlation test is shown on the graph. The pie charts represent the proportion of patients with (white) anti-RBD IgG among those with or without neutralizing humoral response. (E) Results for the 14 patients from the epidemiological cohort, who developed COVID-19 after vaccination, are plotted. Dotted lines indicate the threshold of positivity of each assay. Mann-Whitney tests were used to compare antibody or neutralizing titers in (A to C) and Fisher’s exact test was used to compare proportions in (A to D); *p≤0.05; ****p<0.0001.
Fig. 4.
Fig. 4.
Generation of neutralizing IgG antibodies after vaccination is associated with evidence of a germinal center reaction. (A) The gating strategy used for flow cytometry analysis of RBD-specific B cell response is shown. (B) RBD-specific cells were enumerated among antigen-experienced B cells in the circulation of vaccinated renal transplant recipients. Left panel: concatenated flow cytometry profiles of non-responders (upper thumbnail) and responders (lower thumbnail) to vaccine are shown. Median percentage and interquartile range are indicated. Proportions of RBD-specific B cells were compared. Right panel: the numbers of RBD-specific antigen-experienced B cells of non-responders (n=12; open circles) and responders (n=6; black circles) were compared. (C) The site in which the humoral response against the vaccine developed was indirectly analyzed based upon the phenotype of RBD-specific B cells. Extrafollicular responses are characterized by the generation of type 2 double-negative (CD11chigh CD21low IgD- CD27-) B cells (purple gate). The rest of antigen-experienced B cells (blue gates) are thought to be derived from the germinal center. Left panels: concatenated flow cytometry profiles of all vaccinated patients are shown, together with the gating strategy used for analysis. Right panel: Bar graphs (left) show the number of RBD-specific antigen-experienced B cells likely derived from germinal centers (GC, blue) or extrafollicular (purple) responses for non-responders (n=12; open circles) and responders (n=6; black circles) to vaccine. The proportions of RBD-specific antigen-experienced B cells derived from germinal center and extrafollicular responses in responders to vaccine are shown in the pie chart (right). Data in (B and C) were analyzed using a Mann-Whitney test. **p<0.01; ***p<0.001; ****p<0.0001. (D and E) The correlation between the number of germinal center-derived RBD-specific antigen-experienced B cells and the titer of anti-RBD IgG (D) or the viral neutralization capacity of the serum (E) are shown. The results of Spearman correlation test are shown on the graphs.
Fig. 5.
Fig. 5.. Generation of neutralizing antibodies after vaccination correlates with the number of spike protein-specific Tfh cells.
Follicular helper T cells (Tfh) were enumerated in the circulation of responders (n=6; black circles) and non-responders (n=22; open circles) after two doses of SARS-CoV-2 mRNA vaccine. (A) Representative flow cytometry profiles are shown with the gating strategy used to identify the 3 subsets of follicular helper T cells (Tfh): Tfh1 (blue), Tfh2 (green), and Tfh17 (orange). (B) The counts of circulating CD4+ T cell subsets are plotted for each patient. (C and D) Spike protein-specific cells were enumerated among each CD4+ T cell subset for each vaccinated patient. Data were background subtracted against a DMSO-only negative control. (C) Representative flow cytometry profiles of non-responders (upper row) and responders (lower row) are shown. Median percentage and interquartile range are indicated. (D) The counts of circulating spike protein-specific CD4+ T cell subsets are plotted for each patient. Bars indicate median values. Data in (D) were compared using Mann-Whitney tests. *p<0.05; **p<0.01. (E) The correlation between the number of spike protein-specific Tfh cells and viral neutralization capacity of the serum is shown. The result of Spearman correlation test is shown on the graph. (F) The correlation between the number of spike protein-specific Tfh cells and germinal center-derived RBD-specific antigen-experienced B cells is shown. The result of Spearman correlation test is shown on the graph.
Fig. 6.
Fig. 6.
High mycophenolate mofetil dose was associated with evidence of poorer vaccination-induced germinal center reactions. (A) Polar plots were used to compare maintenance immunosuppression regimens for non-responders (n=23; left panel) and responders (n=6; middle panel) to two doses of SARS-CoV-2 mRNA vaccine, and patients previously infected with SARS-CoV-2 (n=21; right panel). Median values are plotted. MMF, mycophenolate mofetil; CNI, calcineurin inhibitor. Target indicates the target residual blood concentration of CNI. < and > symbols indicate residual blood concentrations of CNI below or above the target, respectively. (B) The bar graph (left) shows the number of RBD-specific antigen-experienced B cells thought to be derived from germinal center (blue) and extrafollicular (purple) responses of each recently infected patient (n=8; open squares). The proportions of RBD-specific antigen-experienced B cells likely derived from germinal center and extrafollicular responses in recently infected patients are shown in the pie chart (right). (C) SARS-CoV-2-specific Tfh subsets were enumerated in the circulation of non-responders (n=22; open circles) and responders (n=6; black circles) to two doses of SARS-CoV-2 mRNA vaccine, as well as for patients recently infected with SARS-CoV-2 (n=18; open squares). (D) The titers of anti-RBD antibodies were measured in the circulation for non-responders (n=23; open circles) and responders (n=6; black circles) to two doses of SARS-CoV-2 mRNA vaccine, as well as for patients recently infected with SARS-CoV-2 (n=21; open squares). B.A.U. indicates binding antibody units. (E) The neutralizing capacity of patients’ serum was compared for non-responders (n=23; open circles) and responders (n=6; black circles) to two doses of SARS-CoV-2 mRNA vaccine, as well as for patients recently infected with SARS-CoV-2 (n=21; open squares). Neutralizing titers are presented as log10(IC50). Bars indicates the median. Data were analyzed by Mann-Whitney tests; ns, p>0.05; *p≤0.05, **p<0.01; ***p<0.001, ****p<0.0001.
Fig. 7.
Fig. 7.
Infection after vaccination or a third dose of mRNA vaccination improves SARS-CoV-2-specific antibody responses. (A) Anti-RBD IgG titers were measured pre- and post-SARS-CoV-2 infection in individuals who received two doses (2D) of mRNA vaccine (n=6). (B) Virus neutralization capacity of the serum was measured after SARS-CoV-2 infection in transplant recipients who did not respond to two doses of mRNA vaccine (n=6). Percentages indicate the fraction of individuals with (83%) or without (17%) measurable neutralizing titers after two doses of vaccine and SARS-CoV-2 infection. (C) A discovery cohort (mRNA-1273 vaccine; n=17) was used to compare anti-RBD IgG titers after the second (2D) and third (3D) dose of mRNA vaccine in the same patients; these patients were considered non-responders after two doses of mRNA-1273 vaccine. (D) Virus neutralization capacity of the patients’ serum was measured after 3D (n=17). Percentages indicate the fraction of individuals with (41%) or without (59%) measurable neutralizing titers after three doses of mRNA-1273 vaccine. (E) An external validation cohort (BNT162b2 vaccine; n=62) was used to compare anti-RBD IgG titers after the second (2D) and third (3D) dose of mRNA vaccine in those who were non-responders to two doses of BNT162b2 mRNA vaccine. (F) Virus neutralization capacity of the patients’ serum was measured after 3D (n=62). Percentages indicate the fraction of individuals with (39%) or without (61%) measurable neutralizing titers after three doses of BNT162b2 vaccine. Wilcoxon test; *, p<0.05, ****, p<0.0001.

References

    1. Zhu N., Zhang D., Wang W., Li X., Yang B., Song J., Zhao X., Huang B., Shi W., Lu R., Niu P., Zhan F., Ma X., Wang D., Xu W., Wu G., Gao G. F., Tan W.; China Novel Coronavirus Investigating and Research Team , A Novel Coronavirus from Patients with Pneumonia in China, 2019. N. Engl. J. Med. 382, 727–733 (2020). 10.1056/NEJMoa2001017 - DOI - PMC - PubMed
    1. COVID-19 situation update worldwide, as of week 1, updated 13 January 2022. European Centre for Disease Prevention and Control, (available at https://www.ecdc.europa.eu/en/geographical-distribution-2019-ncov-cases).
    1. Williamson E. J., Walker A. J., Bhaskaran K., Bacon S., Bates C., Morton C. E., Curtis H. J., Mehrkar A., Evans D., Inglesby P., Cockburn J., McDonald H. I., MacKenna B., Tomlinson L., Douglas I. J., Rentsch C. T., Mathur R., Wong A. Y. S., Grieve R., Harrison D., Forbes H., Schultze A., Croker R., Parry J., Hester F., Harper S., Perera R., Evans S. J. W., Smeeth L., Goldacre B., Factors associated with COVID-19-related death using OpenSAFELY. Nature 584, 430–436 (2020). 10.1038/s41586-020-2521-4 - DOI - PMC - PubMed
    1. Caillard S., Anglicheau D., Matignon M., Durrbach A., Greze C., Frimat L., Thaunat O., Legris T., Moal V., Westeel P. F., Kamar N., Gatault P., Snanoudj R., Sicard A., Bertrand D., Colosio C., Couzi L., Chemouny J. M., Masset C., Blancho G., Bamoulid J., Duveau A., Bouvier N., Chavarot N., Grimbert P., Moulin B., Le Meur Y., Hazzan M.; French SOT COVID Registry , An initial report from the French SOT COVID Registry suggests high mortality due to COVID-19 in recipients of kidney transplants. Kidney Int. 98, 1549–1558 (2020). 10.1016/j.kint.2020.08.005 - DOI - PMC - PubMed
    1. Jager K. J., Kramer A., Chesnaye N. C., Couchoud C., Sánchez-Álvarez J. E., Garneata L., Collart F., Hemmelder M. H., Ambühl P., Kerschbaum J., Legeai C., Del Pino Y Pino M. D., Mircescu G., Mazzoleni L., Hoekstra T., Winzeler R., Mayer G., Stel V. S., Wanner C., Zoccali C., Massy Z. A., Results from the ERA-EDTA Registry indicate a high mortality due to COVID-19 in dialysis patients and kidney transplant recipients across Europe. Kidney Int. 98, 1540–1548 (2020). 10.1016/j.kint.2020.09.006 - DOI - PMC - PubMed

Publication types